1957
REPRODUCIBILITY OF A SINGLE FINITE ELEMENT METHODOLOGY USED TO CALCULATE SEVERAL CARDIOVASCULAR PARAMETERS FROM 4D FLOW MRI DATA.1Biomedical Imaging Center, Pontificia Universidad Catolica de Chile, Santiago, Chile, 2Department of Electrical Engineering, Pontificia Universidad Catolica de Chile, Santiago, Chile, 3Millennium Nucleus for Cardiovascular Magnetic Resonance, Pontificia Universidad Catolica de Chile, Santiago, Chile, 4Department of Radiology, School of Medicine, Pontificia Universidad Catolica de Chile, Santiago, Chile, 5Department of Structural and Geotechnical Engineering, Pontificia Universidad Catolica de Chile, Santiago, Chile, 6Institute for Biological and Medical Engineering, Schools of Engineering, Medicine and Biological Sciences, Pontificia Universidad Catolica de Chile, Santiago, Chile
Synopsis
Several cardiovascular parameters can be calculated using multiple approaches from 4D flow MRI data.
INTRODUCTION
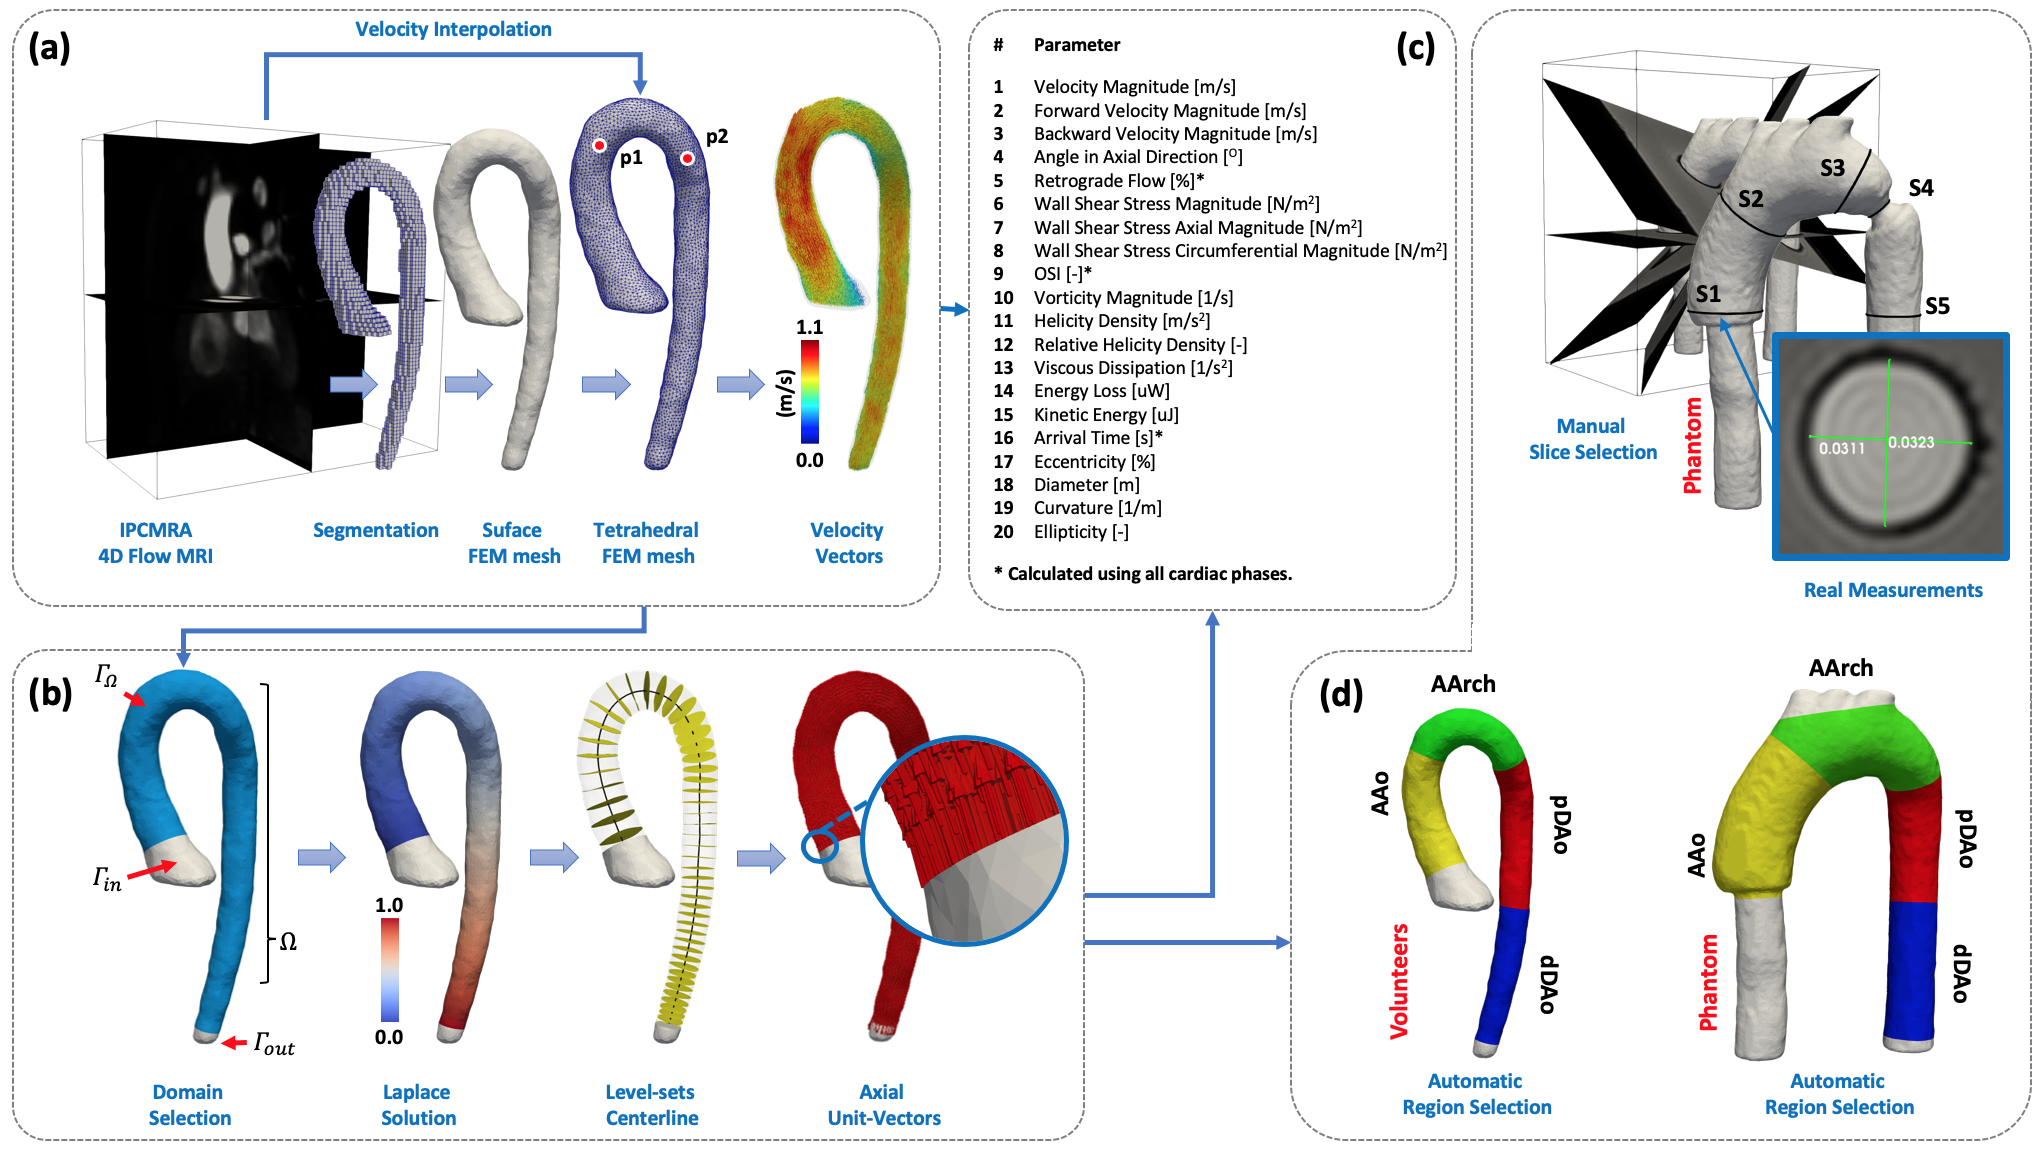
The analysis of different cardiovascular parameters can reveal additional information to study the cardiovascular diseases progression1-3. However, the application of multiple approaches to calculate several cardiovascular parameters is time-consuming and also affects the reproducibility of the method. The purpose of this work is to study the reproducibility of a novel methodology based on finite element (FE) methods that allow obtaining several quantitative cardiovascular parameters (Fig1c) along the entire aorta from a single segmentation of 4D Flow MRI data.METHODS
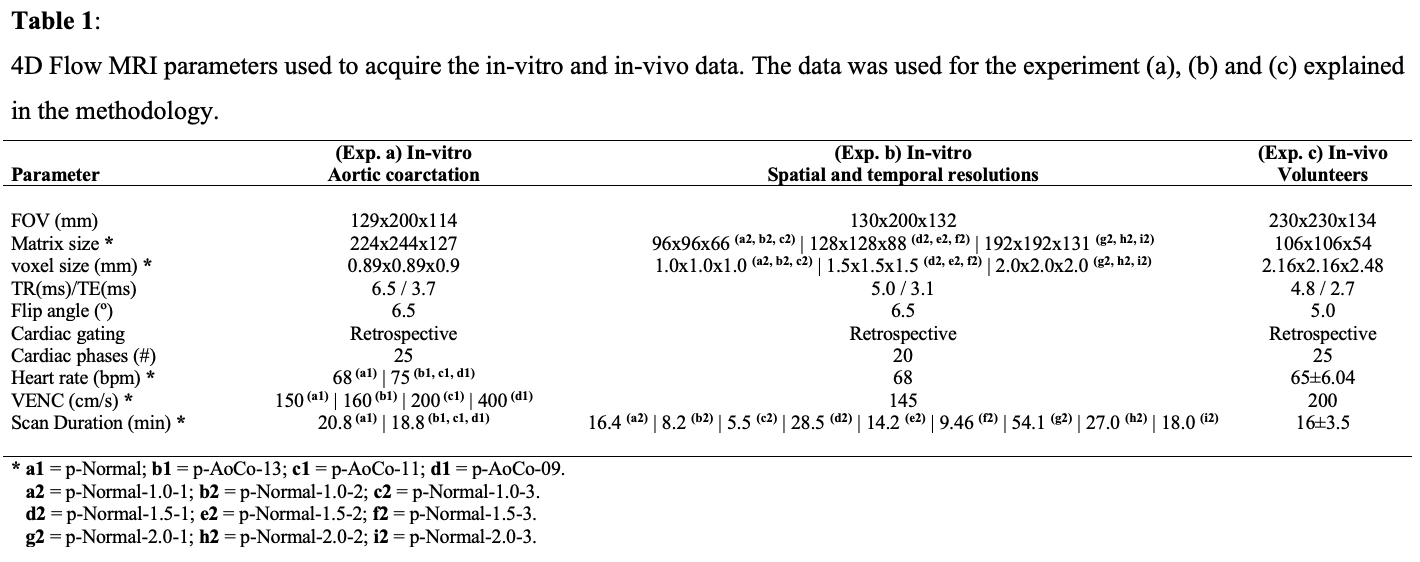
We apply a global least-squares stress projection method4-5, and a standard Galerkin FE formulation6. In Fig1a-b is shown how to obtain several geometric and flow parameters (i.e. wall shear stress, vorticity, diameter, curvature among others). The methodology of this work was divided into three different experiments: a) in in-vitro data7 we evaluated the comparison of diameter and ellipticity with real measurements in five locations of the aorta (Fig1d), for different coarctation (AoCo) levels (without, 13mm, 11mm, 9mm). b) we evaluated the variability of each cardiovascular parameter subjected to different spatial (1.0mm, 1.5mm, 2.0mm isotropic voxel, or HR, MR, LR) and temporal resolution (20ms, 40ms, 60ms; TFE1, TFE2, TFE3 respectively), in four different regions of the aortic phantom (Fig1d). Finally, c) we evaluated intra and inter-observer variability of all cardiovascular parameters in sixteen healthy volunteers (12 males and 4 females, age 30±5 years-old), in four regions of the aorta (Fig1d-bottom). The 4D flow MRI data were acquired using a clinical 1.5T Philips MR scanner (Achieva, Best, The Netherlands). The acquisition parameters for the in vitro and in vivo experiments are summarized in Fig2. To compare the results, we use the Mann-Whitney U test and Pearson correlation. The statistical analysis was performed using SPSS Statistics (version 25.0 IBM SPSS, Chicago, IL). The quantification of cardiovascular parameters was performed in MATLAB (MathWorks, Natick, MA, USA), and for visualization purpose, we use Paraview (KitwareInc., Clifton Park, New York, USA).RESULTS
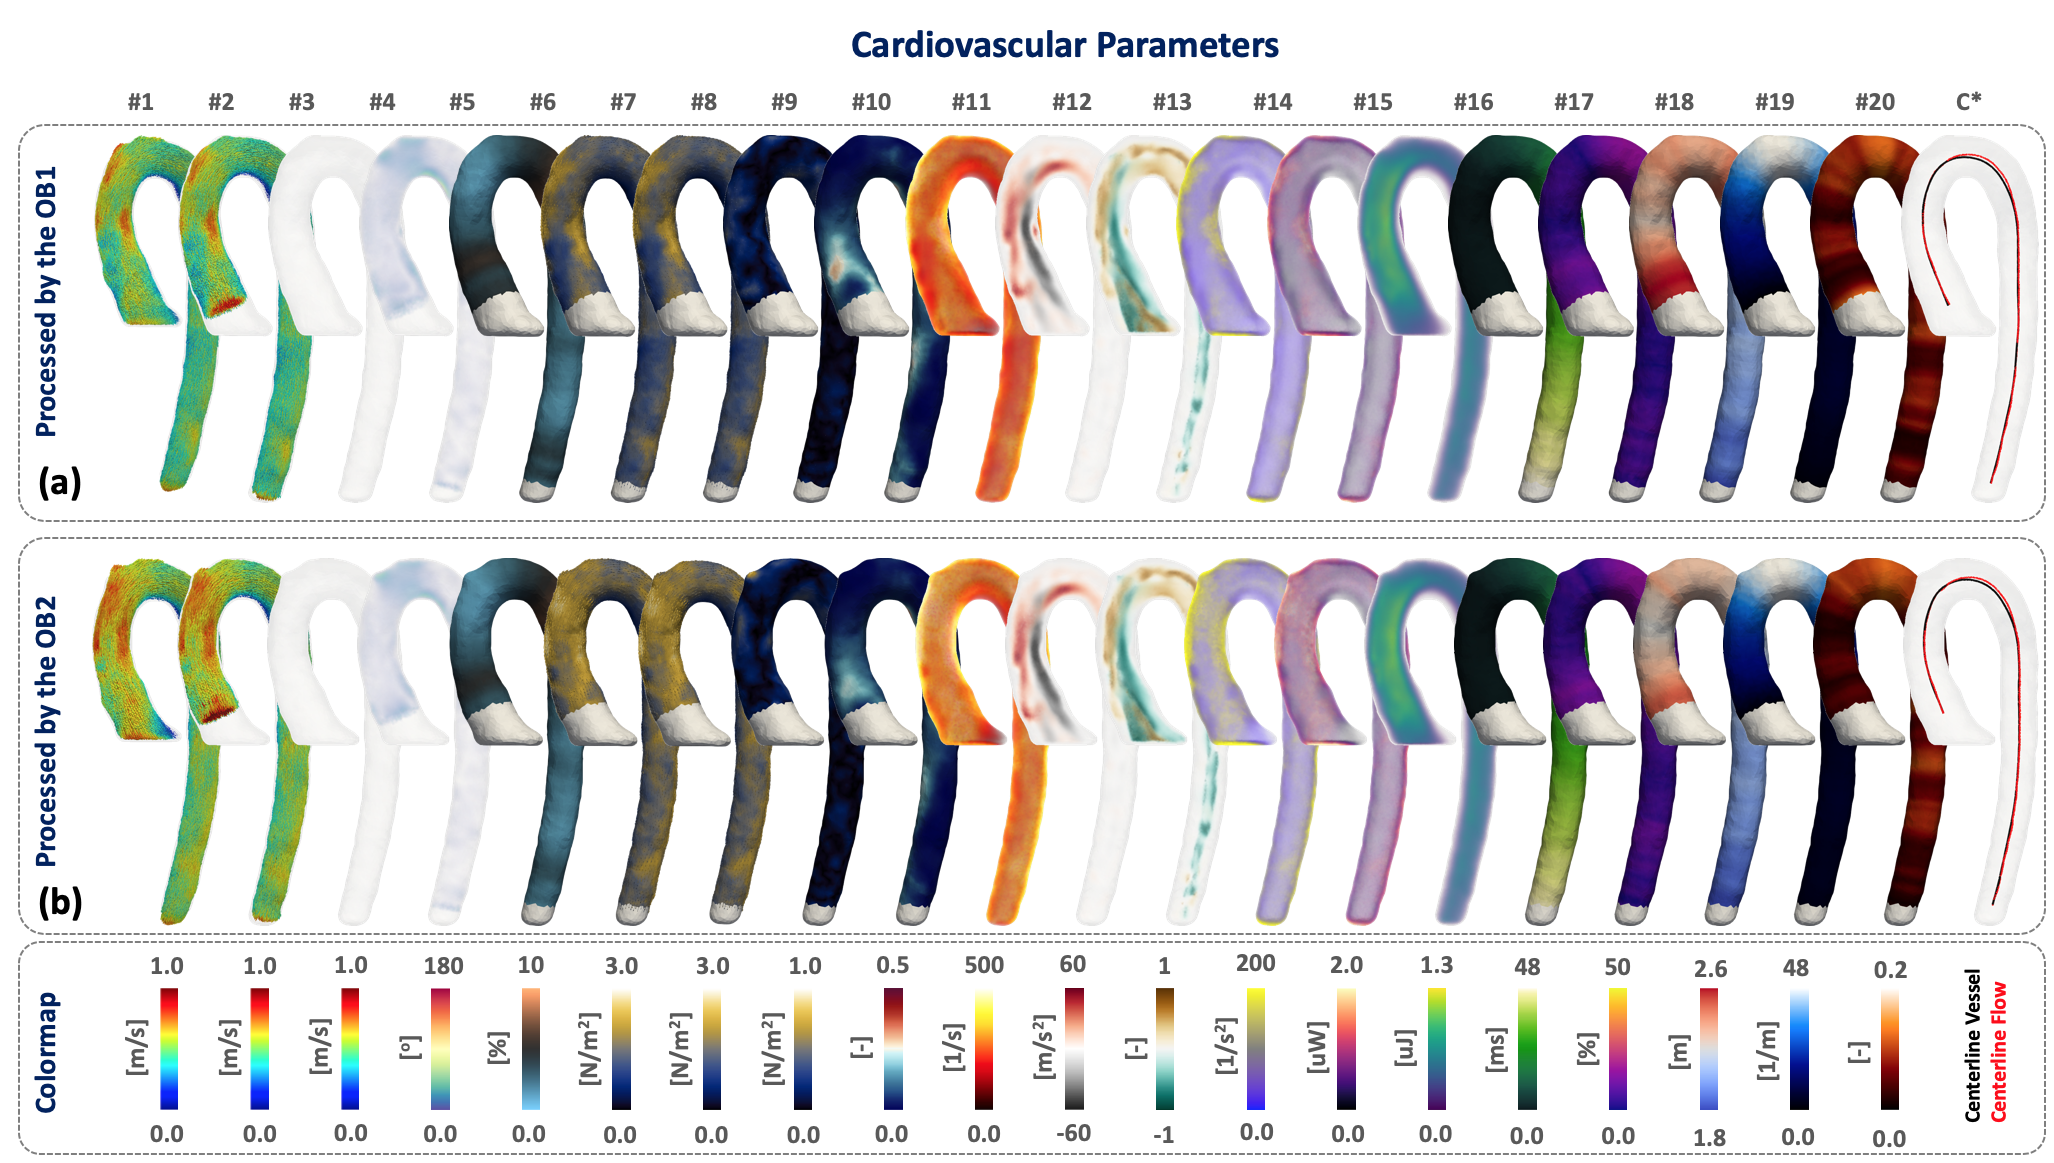
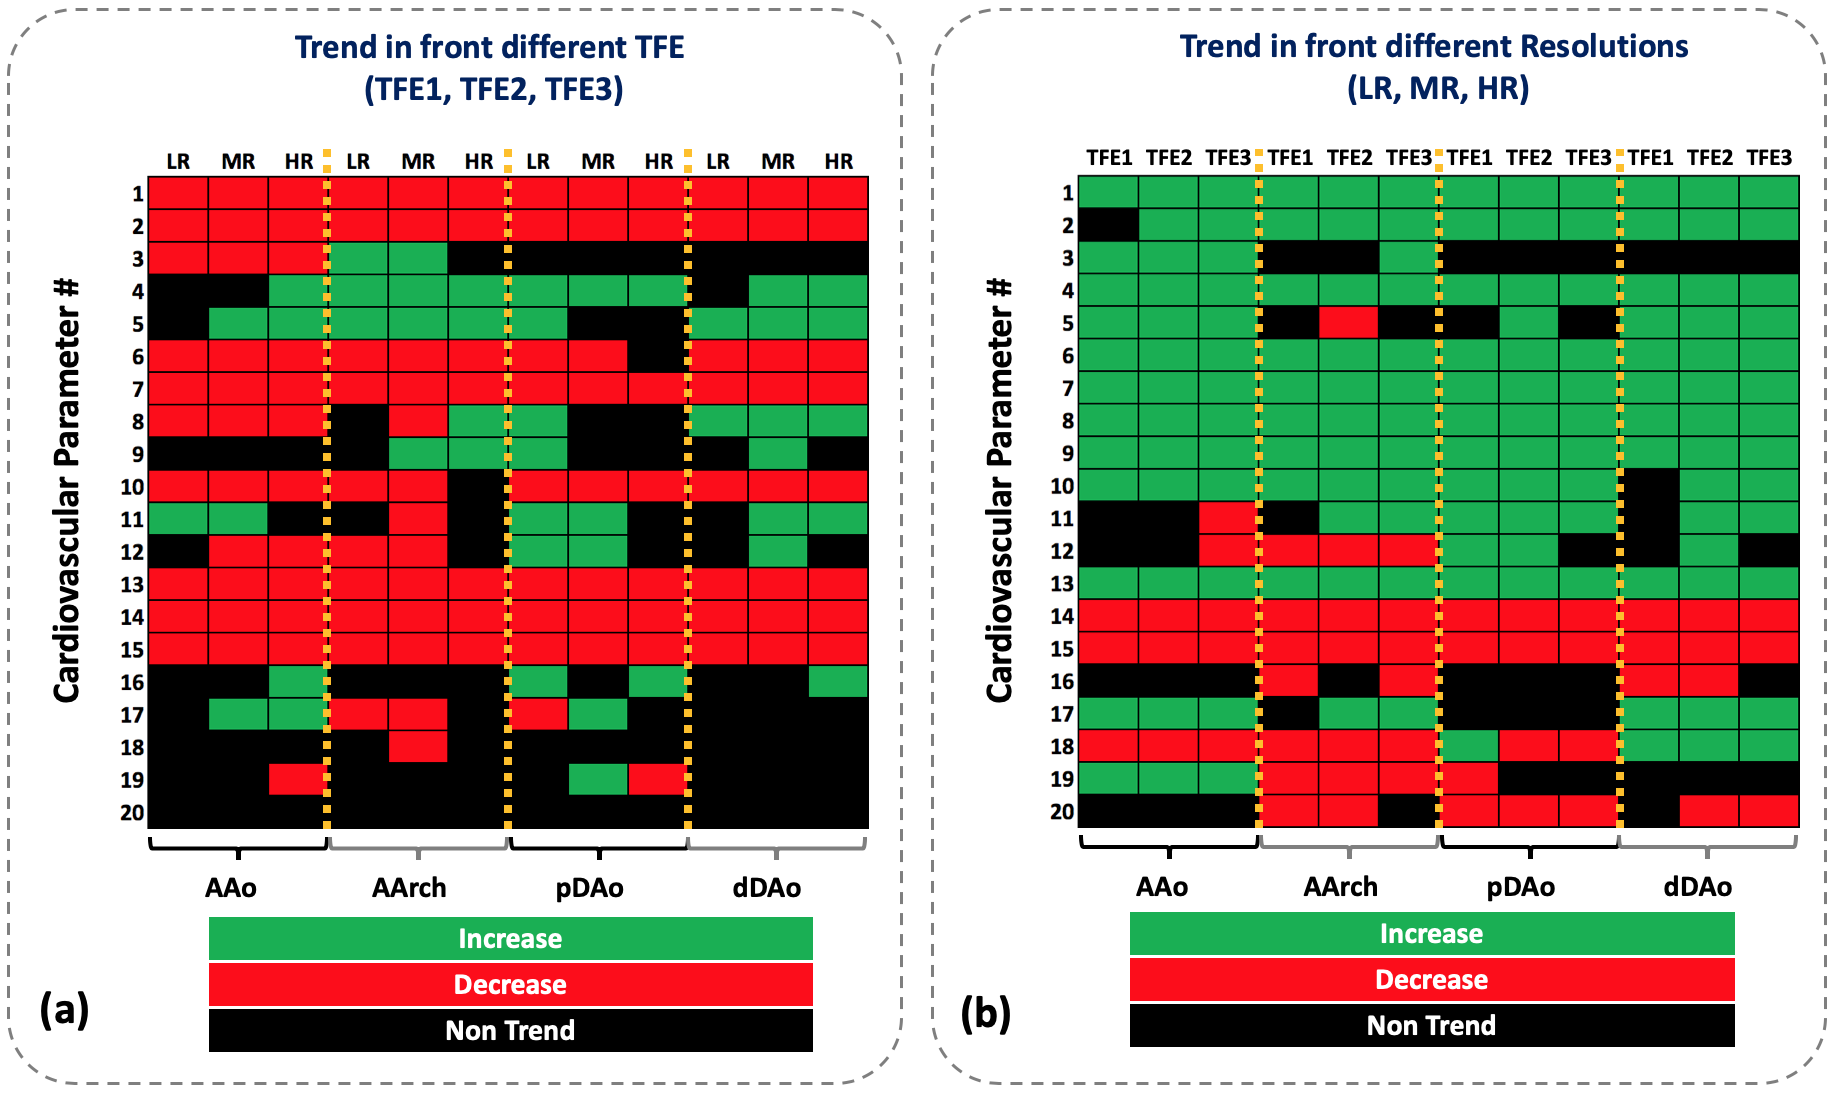
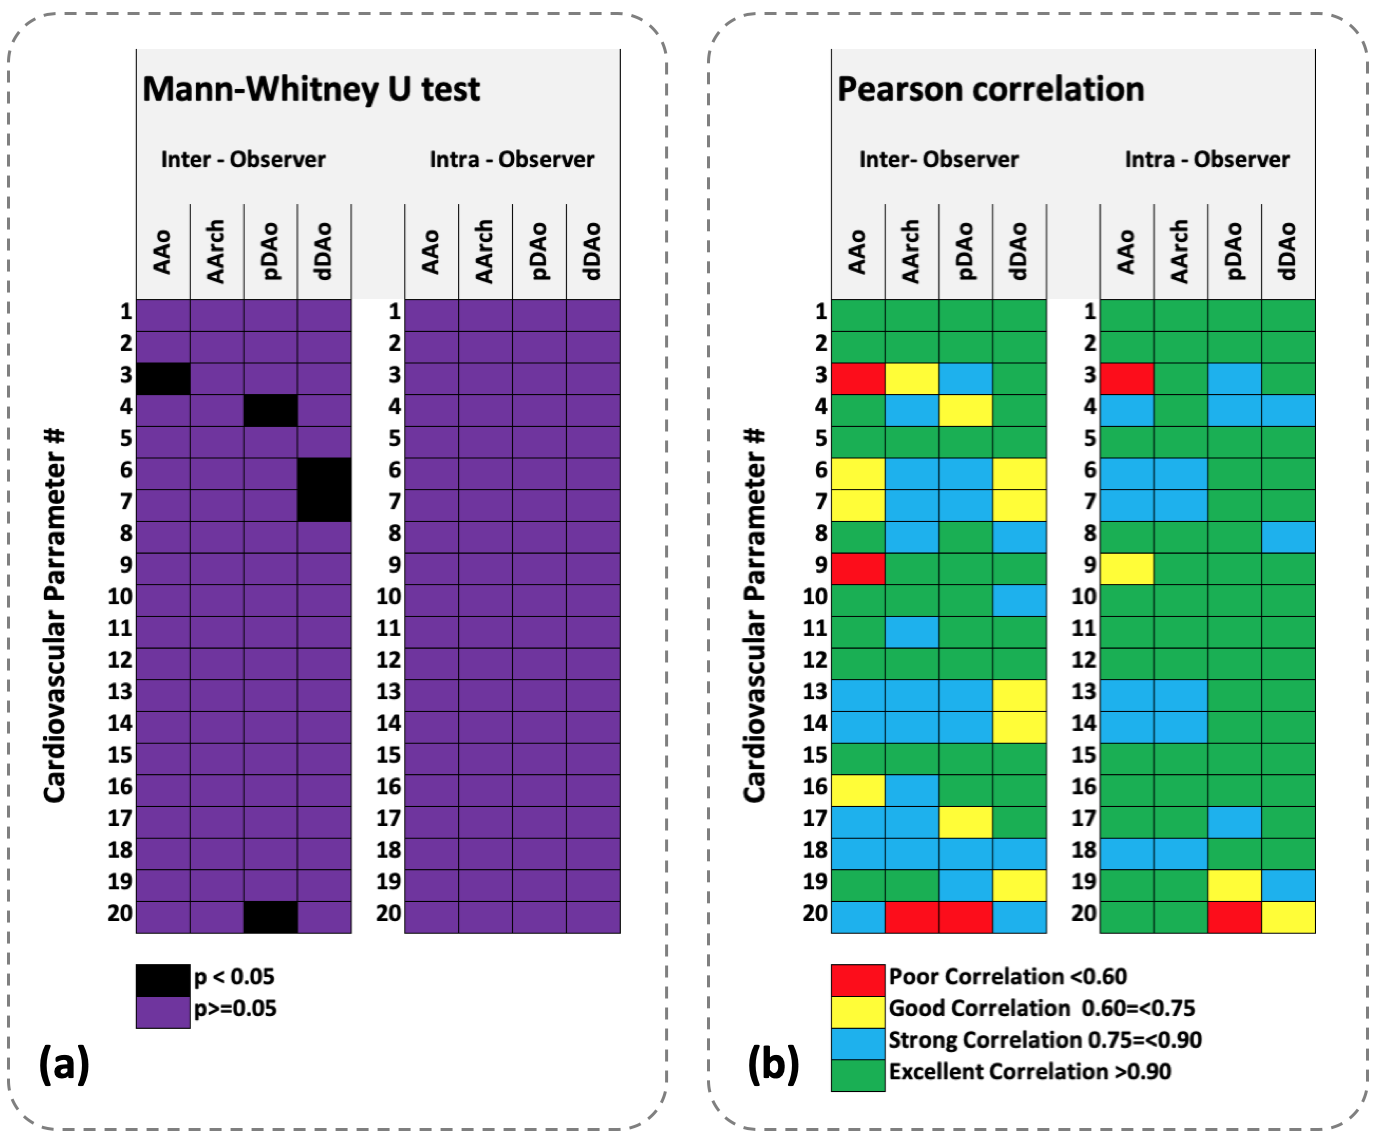
Three-dimensional maps of each cardiovascular parameter and the centerline analyzed in this study are shown in Fig3. The Mann-Whitney U test predicts no significant differences (p-value 0.59 for the diameter and 0.957 for the ellipticity) between manual measurements (mean value 2.56±0.7cm for the diameter, 3.2±3% for the ellipticity) and our FEM approach (mean value 2.59±0.7cm for the diameter, 2.6±1.8% for the ellipticity). The trend of each cardiovascular parameter (Fig1c) in different regions of the aorta for different spatial and temporal resolutions are shown in the Fig4. In the Fig5 we show the Mann-Whitney U test and Pearson correlations for the intra and interobserver analysis on in-vivo data. From this analysis, we observed that 81.2% and 93.7% of the values showed a strong and excellent correlation. A 5% and 2.5% present a poor correlation for inter-observer and intra-observer analysis respectively.DISCUSSION
We found no statistical differences between manual and automatic measurements of the diameter and ellipticity, in the phantom data (p-value 0.59 for the diameter and 0.957 for the ellipticity). For different spatial and temporal resolution, our algorithm showed different results. When we decrease the temporal resolution (from 20ms to 60ms), most of the cardiovascular parameters decrease their values (red box in Fig4a), for the different resolutions (LR,MR,HR) and regions (AAo,AArch,pDAo,dDAo). When we increase the resolution (2mm to 1mm, or LR to HR), most of the cardiovascular parameters augmented their values (green box in Fig4b), for the different temporal resolution and regions (AAo,AArch,pDAo,dDAo). Energy loss, kinetic energy, the angle in axial direction and retrograde flow showed the same trend in both cases because the first two are multiplied by the volume, while the others depend on the directionality of the flow. Regarding the intra-observer analysis, we found no significant differences between the two observations (see Fig5a). If we analyze both observations, a 97.5% of the parameters have strong, excellent and good correlation, only a 2.5% with poor correlations (see Fig5b). However, for the inter-observer analysis, we found significant differences in three different locations of the aorta (AAo,pDAo,dDAo) see Fig5a, parameters #3,4,6,7,20, normally related with the segmentation of the vessel. Although these differences, the correlation between the two observers shown that 95% of the parameters have a strong, excellent and good correlation, only a 5% with poor correlations (see Fig5b).CONCLUSION
our 3D formulation and computational method used to estimate different cardiovascular parameters, using a single segmentation provide robust and consistent results with excellent intra and inter-observer reproducibility, independent of the observer experiences (J.S. with more than 7years of the experience in postprocessing the 4D flow MRI data and R.H. without any experience). Parameters as the axial angle (#4), retrograde flow (#5), energy loss (#14) and kinetic energy (#15) were insensitive to changes in spatial and temporal resolution.Acknowledgements
This publication has received funding from Millenium Science Initiative of the Ministry of Economy, Development and Tourism, grant Nucleus for Cardiovascular Magnetic Resonance. Also, has been supported by CONICYT - PIA - Anillo ACT1416, CONICYT FONDEF/I Concurso IDeA en dos etapas ID15|10284, and FONDECYT # 1181057. Sotelo J. thanks to FONDECYT Postdoctorado 2017 #3170737.References
1.- Dyverfeldt P, Bissell M, Barker AJ, et al. 4D flow cardiovascular magnetic resonance consensus statement. J Cardiovasc Magn Reson. 2015 Aug 10;17:72.
2.- Hojin Ha, Guk Bae Kim, Jihoon Kweon, et al. Hemodynamic Measurement Using Four-Dimensional Phase-Contrast MRI: Quantification of Hemodynamic Parameters and Clinical Applications. Korean J Radiol. 2016 Jul-Aug; 17(4): 445–462.
3.- Markl M, Schnell S, Wu C, et al. Advanced flow MRI: emerging techniques and applications. Clin Radiol. 2016 Aug;71(8):779-95.
4.- Sotelo J, Urbina J, Valverde I, et al. Three-dimensional quantification of vorticity and helicity from 3D cine PC-MRI using finite-element interpolations. Magn Reson Med. 2018 Jan;79(1):541-553.
5.- Sotelo J, Urbina J, Valverde I, et al. 3D Quantification of Wall Shear Stress and Oscillatory Shear Index Using a Finite-Element Method in 3D CINE PC-MRI Data of the Thoracic Aorta. IEEE Trans Med Imaging. 2016 Jun;35(6):1475-87
6.- Sotelo J, Dux-Santoy L, Guala A, et al. 3D axial and circumferential wall shear stress from 4D flow MRI data using a finite element method and a Laplacian approach. Magn Reson Med. 2018 May;79(5):2816-2823.
7.- Urbina J, Sotelo J, Springmüller D, et al. Realistic aortic phantom to study hemodynamics using MRI and cardiac catheterization in normal and aortic coarctation conditions. J Magn Reson Imaging. 2016 Sep;44(3):683-97.
Figures