1945
Accuracy of proton magnetic resonance technique for diagnosing non-alcoholic steatohepatitis: a meta-analysis1Medical Convergence Research Center, Wonkwang University, Iksan, Korea, Republic of, 2Medical Science, Wonkwang University, Iksan, Korea, Republic of, 3Radiology, Wonkwang University School of Medicine, Iksan, Korea, Republic of
Synopsis
Non-alcoholic fatty liver disease (NAFLD) is a rapidly increasing health problem in world wide. NAFLD comprises a wide spectrum of liver damage, ranging from simple macrovesicular steatosis, liver inflammation, fibrosis, and cirrhosis. Liver biopsy has been regarded as the reference standard for diagnosing hepatic inflammation, fibrosis and cirrhosis in NAFLD. A subset non-alcoholic steatohepatitis (NASH) is the early stage of progression that develops to cirrhosis in 15-25% of patients and can lead to the development of hepatocellular carcinoma. Thus, non-invasive diagnostics of NASH are clinically important issue and are warranted. Recently, considerable effort is underway to identify screening strategies that non-invasively diagnose NASH using a variety of techniques such as laboratory tests and imaging techniques. Up to date, there are several published studies using serum biochemical tests, ultrasound and CT, however there was no strong evidence in clinical practice. In this study, the diagnostic accuracy in NAFLD using 1H MR modality have not yet been clearly identified. Our meta-analysis study was estimated the accuracy of 1H MRI on this topic, non-invasively diagnosing NASH.
Introduction
Liver biopsy has been regarded as the reference standard for diagnosing hepatic inflammation, fibrosis and cirrhosis in NAFLD. A subset non-alcoholic steatohepatitis (NASH) is the early stage of progression that develops to cirrhosis in 15-25% of patients and can lead to the development of hepatocellular carcinoma. Therefore, non-invasive diagnostics of NASH are clinically important issue and are warranted. Biomarkers of NASH that can be measured are of particular interest for their potential to provide a noninvasive screening modality and high diagnostic accuracy suitable for use in large populations. Recently, considerable effort is underway to identify screening strategies that non-invasively diagnose NASH using a variety of techniques such as laboratory tests and imaging techniques. There are several published studies using serum biochemical tests, US and CT, however there was no strong evidence (> 80%) in clinical practice. The diagnostic accuracy in NAFLD using 1H MR modality have not yet been clearly identified. This meta-analysis study was to assess the accuracy of 1H MRI on this topic, non-invasively diagnosing NASH.
Material and Methods
A quantitative systematic search was performed. A comprehensive search of the Medline and Cochrane library database was conducted from 2000 to 2017 using defined keywords, limited to English full-text papers. For inclusion in this systematic review, the papers must have measured MR examinations with histologically-proven diagnosis; simple steatosis (or non-NASH) vs. NASH. For each study, 2×2 contingency tables were constructed. We calculated the sensitivity, specificity, likelihood ratios (LR) and diagnostic odds ratio (DOR). The verification bias was performed according to QUADAS-2. Statistical analysis was performed with the software Meta-DiSc® and meta-analysis of diagnostic accuracy (MADA) on the R program.Results and Discussion
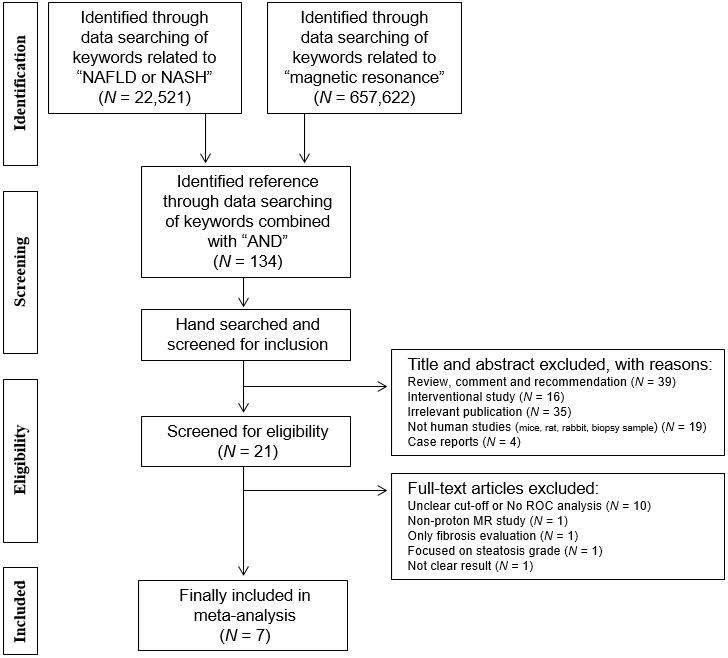
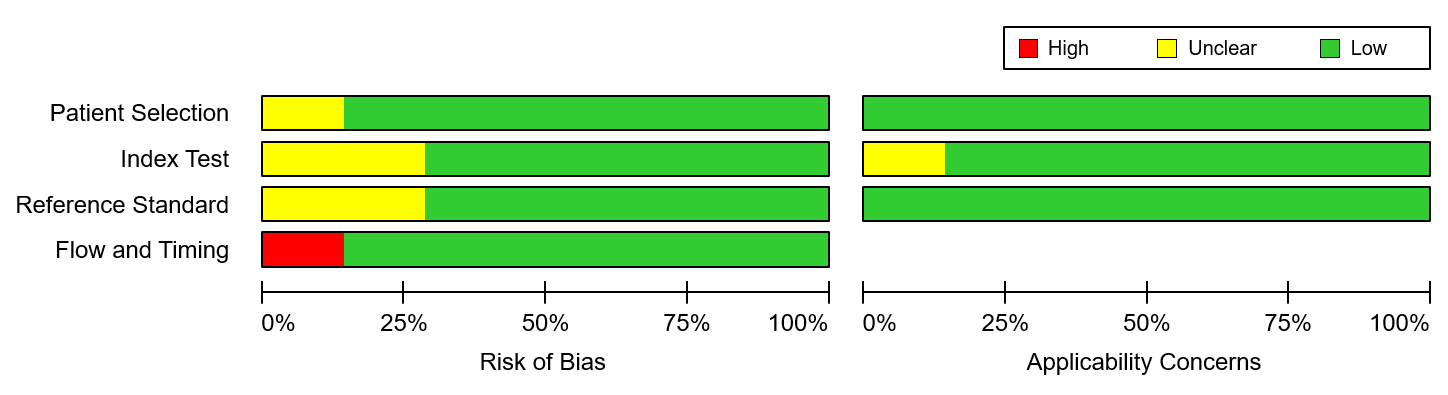
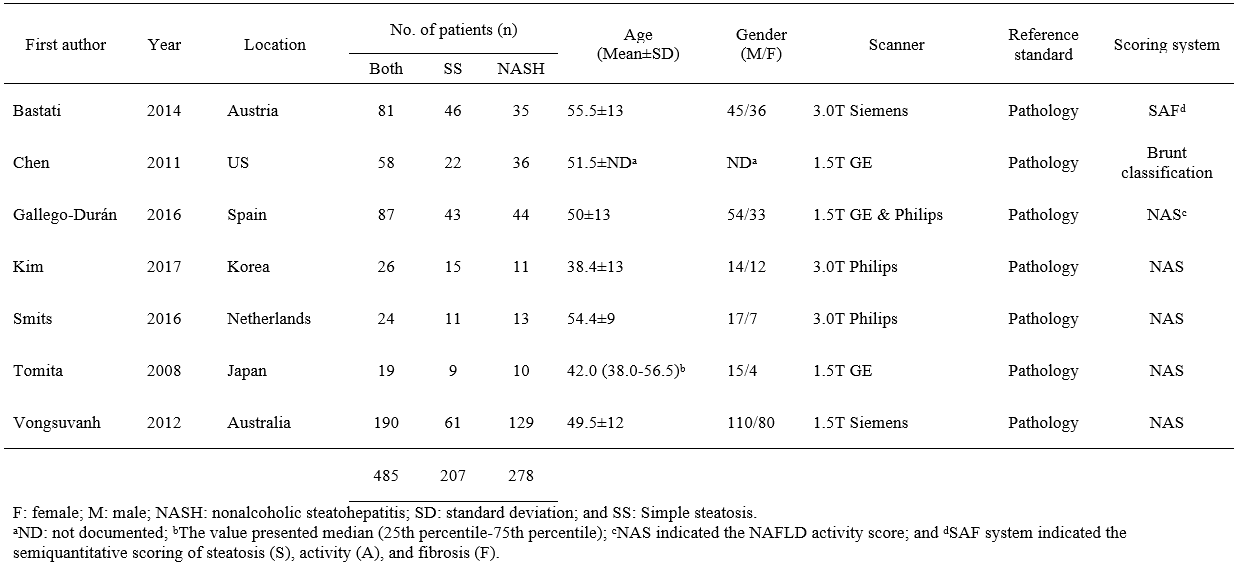
Figure 1 shows flowchart showing the process for the inclusion of studies. Finally, 7 studies were included for assessing the diagnostic accuracy of NASH. These studies showed the diagnostic accuracy between biopsy-proven NASH and SS in hepatic fat content (n=2), liver stiffness (n=1), contrast enhanced signal intensity (n=3) and hepatic metabolites (n=1) (Table 1). Seven studies were analyzed 485 patients, which included 207 SS and 278 NASH. Using the QUADAS-2 assessment tool, all included studies were considered at almost low risk of bias (Fig. 2).
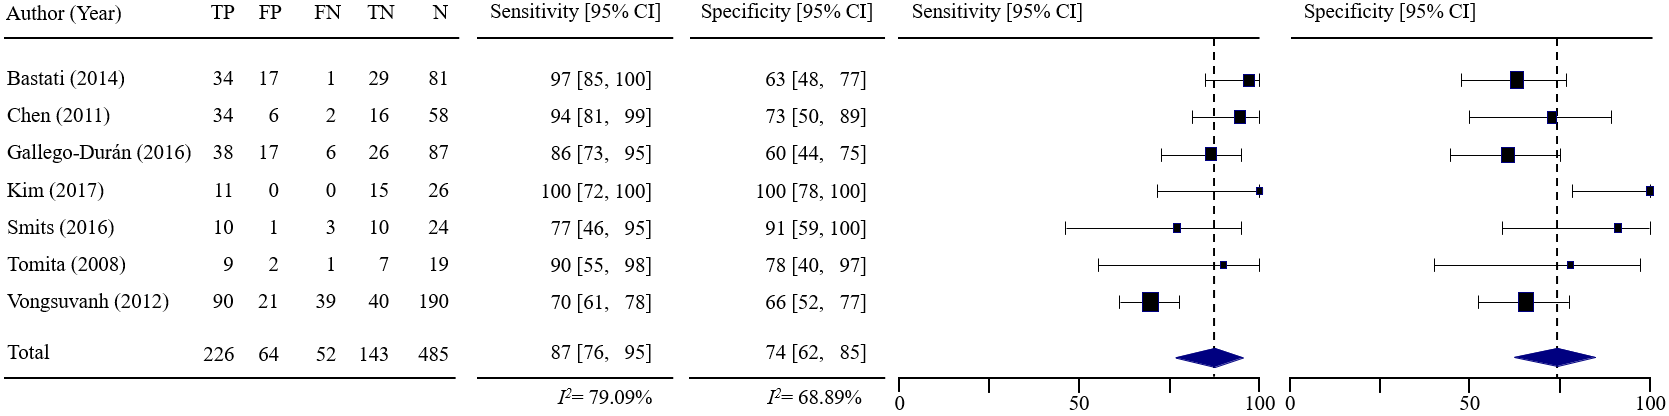
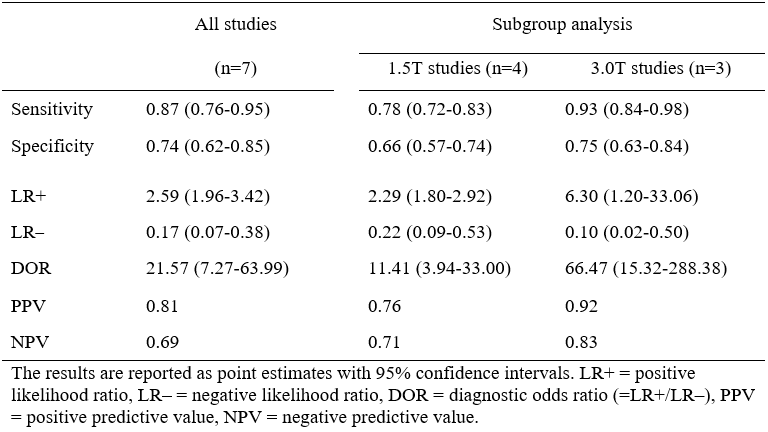
Figure 3 shows forest plots of the sensitivity and specificity of the included studies. The pooled sensitivity from random-effects regression was 87.4% (95% CI, 76.4%–95.3%) and the pooled specificity was 74.3% (95% CI, 62.4%–84.6%). Table 2 lists the estimated LR+, LR– and DOR. Pooled LR+ was 2.59 (95% CI, 1.96–3.42) and LR– was 0.17 (95% CI, 0.07–0.38). LR+ and LR– values show weak diagnostic evidence. The DOR was calculated 21.57 (95% CI, 7.27–63.99). The AUC of SROC curve was 0.8921, indicating very good accuracy.
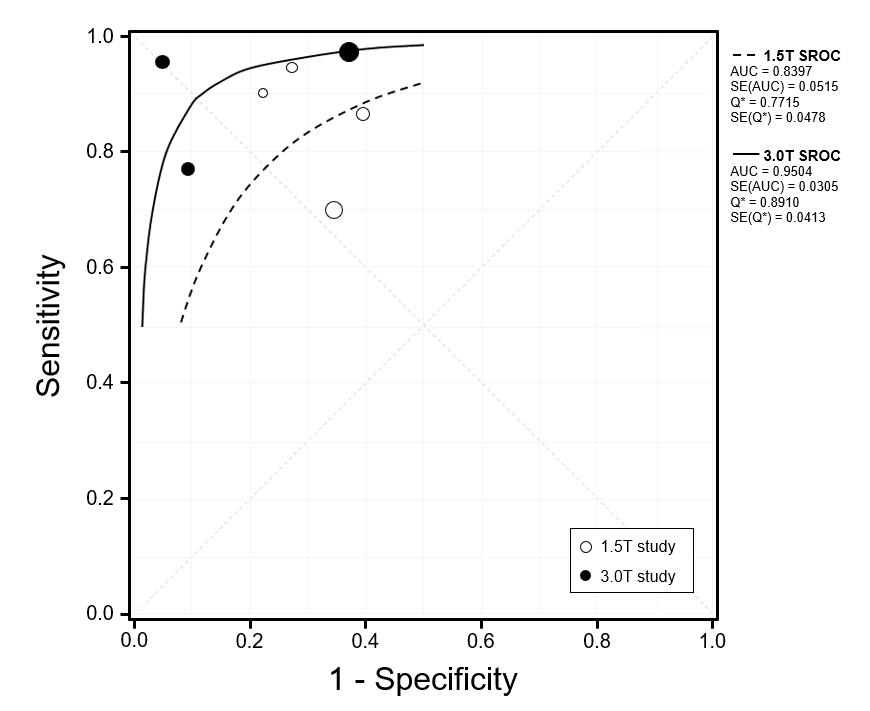
The values of scanner field strength were dichotomized as 1.5T (n = 4) and 3.0T (n = 3) scanner. Table 2 summarizes the sensitivity and specificity in each subgroup using 1.5T and 3.0T scanner. Sensitivities at 1.5T and 3.0T ranged from 70% to 94% and from 77% to 100%, respectively. The pooled sensitivity at 1.5T was 78% (95% CI, 72%–83%) and at 3.0T was 93% (95% CI, 84–98%). Specificities at 1.5T and 3.0T ranged from 60% to 78% and from 63% to 100%, respectively. The pooled specificity at 1.5T was 66% (95% CI, 57%–74%) and at 3.0T was 75% (95% CI, 63%–84%). The pooled sensitivity and specificity at 3.0T was higher than that at 1.5T. Pooled LR+ was 2.29 (95% CI, 1.80–2.92) at 1.5T and 6.30 (95% CI, 1.79–33.06) at 3.0T. Pooled LR– was 0.22 (95% CI, 0.09–0.53) at 1.5T and 0.10 (95% CI, 0.02–0.50) at 3.0T. LR+ and LR– values at 1.5 T indicate weak diagnostic evidence and at 3.0 T were strong diagnostic evidence. The DOR was 11.41 (95% CI, 3.94–33.00) at 1.5T and 66.47 (95% CI, 15.32–288.38) at 3.0T. Figure 4 shows the SROC curves in each subgroup. The AUCs of SROC were 0.8397 at 1.5T and 0.9504 at 3.0T, indicating very good differentiation.
Conclusion
Our meta-analysis summarizes the evidence about the accuracy of 1H MRI tests for non-invasively diagnosing NASH. The pooled results reveal good sensitivity and diagnostic performance. The 1H MRI examination would be useful for screening of early identification of NASH and reducing of liver biopsy in clinical. However, the 1H MR techniques used in the eligible studies are multiple, it is limited for exclusively use in clinical applications.Acknowledgements
This study was supported by the grants of the National Research Foundation of Korea (NRF) (2016M3A9A7918501) and the Korea Health Technology R&D Project through the Korea Health Industry Development Institute (KHIDI), funded by the Ministry of Health & Welfare (HI18C1216).References
1. Bastati N, et al. Radiology 2014; 271: 739-747.
2. Chen J, et al. Radiology 2011; 259: 749-756.
3. Gallego-Duran R, et al. Sci Rep 2016; 6: 31421.
4. Kim TH, et al. J Magn Reson Imaging 2017; 46: 1298-1310.
5. Smits LP, et al. Radiology 2016; 278: 782-791.
6. Tomita K, et al. J Magn Reson Imaging 2008; 28: 1444-1450.
7. Vongsuvanh R, et al. J Hepatol 2012; 57: 392-398.
Figures