1943
Changes of hepatocellular lipids and phosphorus metabolite content in diabetes patients over 5 years after diagnosis1Institute for Clinical Diabetology, German Diabetes Center, Leibniz Institute for Diabetes Research, Düsseldorf, Germany, 2German Center for Diabetes Research (DZD e.V.), München-Neuherberg, Germany, 3Division of Endocrinology and Diabetology, Medical Faculty, Heinrich Heine University, Düsseldorf, Germany
Synopsis
This study aimed at monitoring possible
changes in hepatocellular lipids, γ-adenosine triphosphate and inorganic
phosphate contents using 1H- and 31P-MRS in patients with
type 1 or type 2 diabetes mellitus in the 1st year and at 5 years
after diagnosis. Hepatocellular lipids content was higher at the 5-year follow-up in type
2, but not in type 1 diabetes patients. Diabetes patients generally exhibited decreases
of phosphorus metabolites during the first 5 years of the disease.
Introduction
Noninvasive quantification of hepatocellular lipids (HCL) and phosphorus metabolites has developed as a useful tool for measuring energy metabolism, particularly in type 1 and type 2 diabetes mellitus (T1DM, T2DM). Cross-sectional analyses showed that T2DM patients frequently have increased HCL content1, while hepatic adenosine triphosphate (ATP) and inorganic phosphate (Pi) are lower in diabetes patients than in healthy humans2-3. However, studies on HCL and phosphorus metabolites during the course of diabetes have rarely been reported. Thus, the aim of this study was to compare HCL, γATP, and Pi in T2DM and T1DM in the 1st year after diagnosis and at 5 years by employing 1H- and 31P-MRS.
Methods
After consenting to the protocols, approved by the local institutional review board, a total of 50 patients (24 T1DM (age in the 1st year after diagnosis: 36.2±12.2 years; body mass index (BMI) in the 1st year after diagnosis: 24.9±4.1 kg/m²; BMI at 5-year follow-up: 27.5±5.2 kg/m²) and 26 T2DM (age in the 1st year after diagnosis: 53.7±9.2 years; BMI in the 1st year after diagnosis: 29.9±5.24 kg/m²; BMI at 5-year follow-up: 31.8±5.7 kg/m²) underwent 1H-MRS. Thirty-four patients (22 T1DM and 12 T2DM) were additionally studied with 31P-MRS. All MRS measurements were conducted on a 3 T MR scanner (Achieva X-series, Philips Healthcare) within the first year and 5 years after diagnosis. Single voxel STEAM 1H-MRS was performed for quantitative assessment of HCL (TR/TE=4000/10 ms). Both water suppressed and non-suppressed 1H-MRS were taken in the identical voxel within the homogeneous part of liver tissue, avoiding major vessels and gallbladder, with a volume of interest (VOI) of 25x25x25 mm3. Hepatic γATP and Pi concentrations were determined by 31P-MRS using 3D ISIS with proton decoupling (TR=6000 ms, number of signal averages=128) within a VOI of 60x60x60 mm3. All liver spectra were processed using jMRUI software. HCL content (%) was calculated by the methylene peak at 1.3 ppm in water-suppressed MRS, relative to the sum of the methylene and water peaks at 4.7 ppm in water non-suppressed MRS, as previously described4. The absolute concentrations of γATP and Pi in mmol/L unit were quantified as previously reported4. Statistical analysis for changes in HCL, γATP, and Pi was performed with a paired t-test.
Results
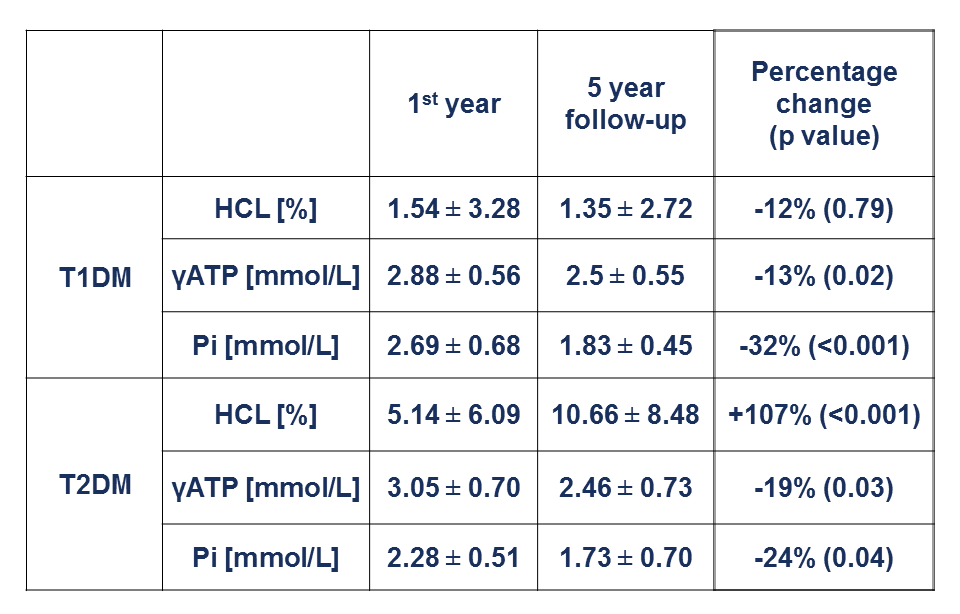
Table 1 summarizes the data on HCL, γATP and Pi content and the respective changes during 5 years. At the clinical onset of diabetes, the mean BMI and age of patients with T1DM were significantly lower than those of T2DM (p<0.001 for both). HCL of T2DM was 3.6 fold higher than that of T1DM in the 1st year after diagnosis (p=0.01). Notably, HCL was more than doubled at 5 years compared to the year of diagnosis in T2DM (p<0.001), while T1DM patients showed no changes in HCL over this time period. In contrast, hepatic concentrations of γATP decreased by 13% in T1DM and by 19% in T2DM (p=0.02 and p=0.03 respectively). Likewise, liver inorganic phosphate was 32% lower in T1DM (p<0.001) and 24% lower in T2DM (p=0.04) after 5 years.
Discussion and Conclusion
Using multinuclei MRS allowed detecting relevant changes of HCL, γATP, and Pi in diabetes patients during the early course of disease. In the face of good metabolic control, the rise in HCL of T2DM patients likely reflects the progression of insulin resistance and may be due to lipotoxicity. The lowering of hepatic ATP could either result from increased use or impaired ATP synthesis. Indeed, lower hepatic ATP levels have been shown to associate with lower rates of ATP synthesis. This suggests the observed reduction of hepatic γATP concentrations reflects a gradual impairment in liver mitochondrial function, which may - over time - accelerate the decline in insulin secretion and action. The current study thereby further underlines the relevance of non-invasive MRS methods for the understanding of the development and progression of metabolic diseases.Acknowledgements
No acknowledgement found.References
[1] Gancheva S, Jelenik T, Álvarez-Hernández E, et al. Interorgan Metabolic Crosstalk in Human Insulin Resistance. Physiol Rev. 2018; 98(3):1371-1415.
[2] Szendroedi J, Chmelik M, Schmid AI, et al. Abnormal hepatic energy homeostasis in type 2 diabetes. Hepatology. 2009;50(4):1079–1086.
[3] Gancheva S, Bierwagen A, Kaul K, et al. Variants in Genes Controlling Oxidative Metabolism Contribute to Lower Hepatic ATP Independent of Liver Fat Content in Type 1 Diabetes. Diabetes. 2016;65(7):1849-1857.
[4] Laufs A, Livingstone R, Nowotny B, et al. Quantitative liver 31P magnetic resonance spectroscopy at 3T on a clinical scanner. Magn Reson Med. 2014;71(5):1670-1675.
Figures