1942
MRS-based water T2 relaxation time in the supraclavicular fossa relates to anthropometric and imaging obesity markers1Department of Diagnostic and Interventional Radiology, Technische Universität München, Munich, Germany, 2Institute for Nutritional Medicine, Technische Universität München, Munich, Germany
Synopsis
The development of non-invasive imaging biomarkers for the detection and quantification of brown adipose tissue (BAT) remains an active research field thanks to the potential implications of BAT activation in treatment of metabolic dysfunction. BAT is known to be characterized by the presence of iron-rich mitochondria, increased oxygenation and denser vasculature compared to white adipose tissue. All above BAT characteristics would be expected to affect the T2 relaxation time of water within BAT. The present work aims to show the feasibility of measuring water-only T2 relaxation times using single-voxel MRS in the human supraclavicular fossa and to characterize the relationship of water T2 values to other metabolic and imaging parameters.
Purpose:
Brown adipose tissue (BAT) has become a research focus thanks to its potential implications in treatment of metabolic dysfunction [1]. There is therefore an emerging need for developing non-invasive imaging biomarkers for detection and quantification of BAT [2,3]. In humans, BAT can be mostly found in the supraclavicular fossa, where the proton density fat fraction (PDFF) has been shown to relate to the presence of BAT. In addition to PDFF, T2* relaxation times have been shown to be shortened in the presence of BAT and be related to anthropometric obesity markers. The shortened T2* of supraclavicular fat has been explained by the presence of iron-rich mitochondria, increased oxygenation and denser vasculature within BAT [4]. Adipose tissue T2* can be acquired simultaneously with PDFF based on a multi-echo gradient echo acquisition and water-fat separation. However, measuring T2* in tissues containing a mixture of water and fat can be confounded by the need to model separately T2* for water and fat components [5] and the effect of the magnetic susceptibility difference between water and fat on a single tissue T2* [6]. Water-only T2 relaxation time (waterT2) could be an alternative parameter related to the presence of iron, oxygenation and vasculature. Single-voxel MRS would enable the quantification of waterT2 without being affected by the presence of fat. Therefore, the present work aims to show the feasibility of measuring supraclavicular waterT2 using single-voxel MRS and to characterize its relationship to other metabolic and imaging parameters.Methods:
Subjects & measurements: Twenty-five subjects (15 female; mean age 37.4 years, range 22-60 years) recruited from a larger study [7] underwent an MRI of the neck on a 3T scanner (Ingenia, Philips Healthcare). Exclusion criteria were standard contraindications to MRI. For supraclavicular PDFF-measurement, a six-echo multi-echo gradient echo sequence with bipolar gradients was used: TR=12ms, TE1=1.24ms, ΔTE=1.0, flip angle=5°, bandwidth=1413 Hz/pixel, 268x200x93 acquisition matrix size, FOV=400x300x140mm³, 1.5mm isotropic voxel size, SENSE with R=2.5. Single-voxel STEAM MRS was performed using: TR/TM:5000/17ms and TE:12/15/20/25ms, spectral bandwidth=5000 Hz, 4096 samples and 8 averages (scan time=3min). A voxel (10x10x8mm3) was placed in the right supraclavicular fat depot, excluding muscles, larger vessels and lymph nodes. Weight and body fat percentage as proportion of fat to total body weight were assessed by bioimpedance analysis using Tanita BC 418 MA (Tanita, Japan). Body mass index (BMI) was calculated as weight in kg divided by height squared in m².
Data analysis: PDFF-maps were generated using the online complex-based fat quantification algorithm, accounting for confounding factors including the presence of multiple fat peaks, a single T2* correction and phase errors. A custom-built MATLAB-algorithm was used for segmentation, delineating the supraclavicular fat pockets bilaterally. MR-spectra were processed using frequency domain-based fitting routines and a joint fitting of the water and fat peak areas at different echo times to extract T2 relaxation times and PDFF. Associations between waterT2 and other metabolic and imaging parameters were investigated using Pearson correlation analysis.
Results:
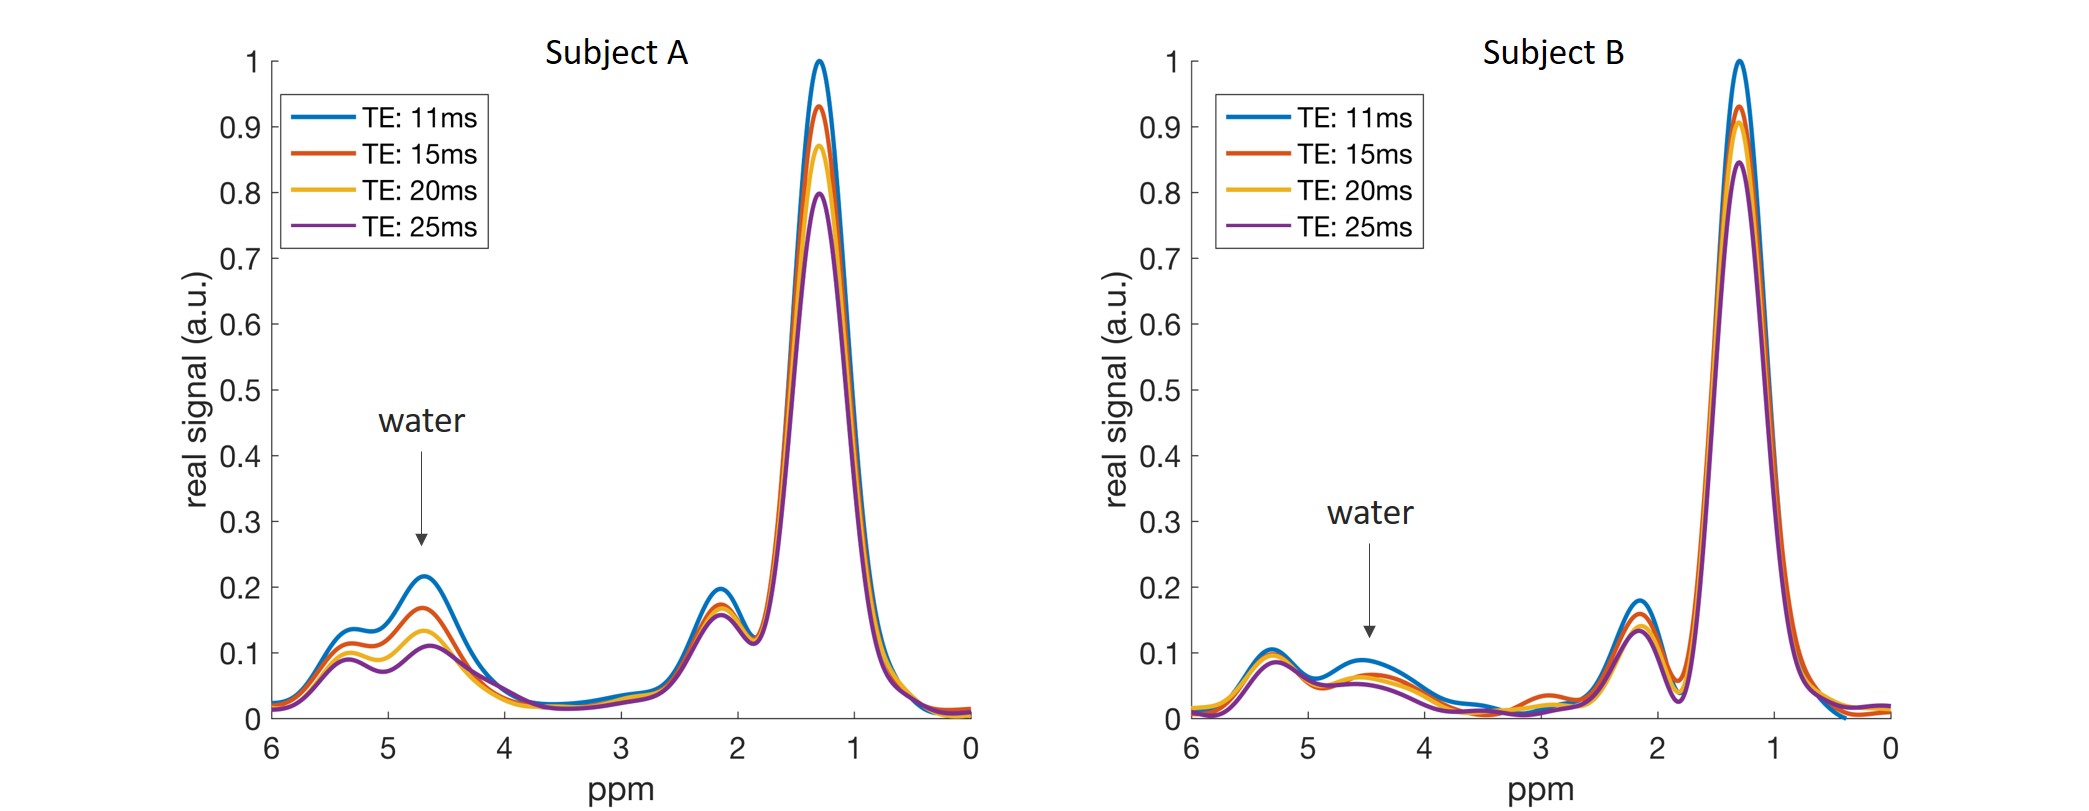
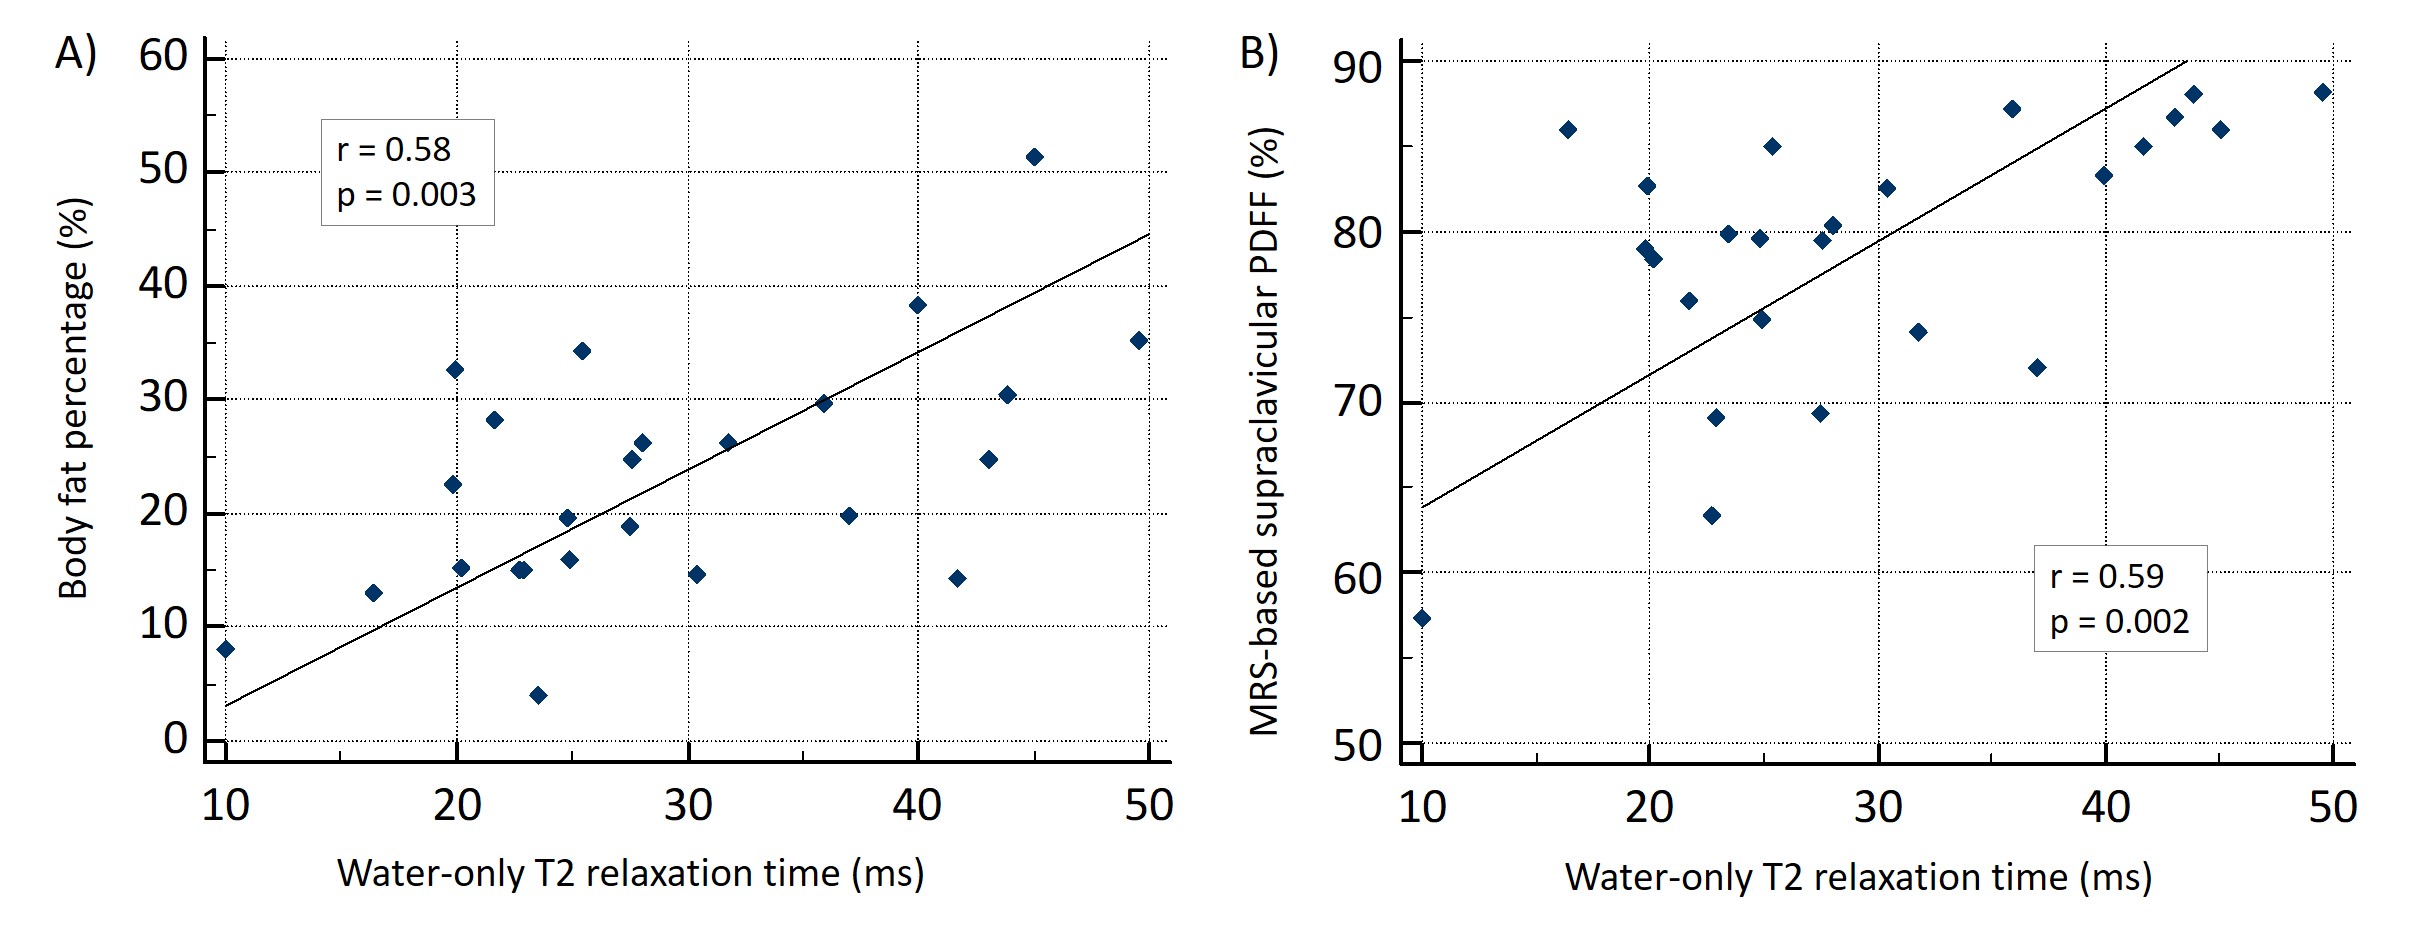
PDFF measured by the six-echo multi-echo gradient echo sequence resulted in a mean of 76.61±4.27% (range, 69.29-86.01%) in supraclavicular adipose tissue. MRS resulted in a mean waterT2 of 29.34±10.15ms (range, 10.0-49.51ms) and a broader linewidth for the water peak than the fat peaks (p<0.001) (Fig.1). PDFF extracted from MRS resulted in a mean of 78.9±7.93% (range, 57.4-88.2%). Mean BMI was 24.32±6.45 kg/m² (range, 17.2-43.1 kg/m²) and mean body fat percentage was 23.16±10.55% (range, 4.1-51.4%). Correlation analyses revealed positive correlations of waterT2 with with BMI (r=0.55, p=0.004) and with body fat percentage (r=0.58, p=0.003) (Fig.2). Regarding correlations with other imaging parameters, waterT2 positively correlated with PDFF as measured by the six-echo multi-echo gradient echo sequence (r=0.43 p=0.03) as well as with MRS-PDFF (r=0.59 p=0.002) (Fig.2).Discussion & Conclusion:
The broader linewidth of the water peak compared to the fat peaks in the measured MR spectra suggests a difference in the T2* of the water and fat components. Multiple water peaks with different T2 values and linewidths might also exist and overlap (Fig.1). However, a single water peak with a single T2 decay was modeled in the present MRS analysis. WaterT2 correlated with both anthropometric and imaging parameters of obesity. The correlation with anthropometric obesity markers was shown before for supraclavicular and gluteal PDFF [8]. In this context, the correlation of supraclavicular waterT2 with obesity markers is in line with the previously described relationship between BAT and obesity [9]. However, MRS-based waterT2 represents a relaxometry parameter of only the water component within BAT, is therefore not methodologically confounded by the typical water-fat imaging assumption that water and fat have the same T2* and could be potentially helpful as an additional parameter in the characterization of the link between BAT presence and the obese phenotype.Acknowledgements
The present work was supported by the European Research Council (grant agreement No 677661, ProFatMRI), Philips Healthcare, the Else-Kroener-Fresenius-Foundation, Bad Homburg, Germany, and the Helmholtz cross-program topic "Metabolic Dysfunction". This work reflects only the authors´ view and the EU is not responsible for any use that may be made of the information it contains.References
1. Cypess, A.M., et al., Identification and importance of brown adipose tissue in adult humans. N Engl J Med, 2009.360(15): p.1509-17.
2. Hu, H.H., Magnetic Resonance of Brown Adipose Tissue: A Review of Current Techniques. Crit Rev Biomed Eng, 2015. 43(2-3): p.161-81.
3. Karampinos, D.C., et al., Techniques and Applications of Magnetic Resonance Imaging for Studying Brown Adipose Tissue Morphometry and Function. Handb Exp Pharmacol, 2018.
4. Hu, H.H., et al., Comparison of brown and white adipose tissues in infants and children with chemical-shift-encoded water-fat MRI. J Magn Reson Imaging, 2013. 38(4): p. 885-96.
5. Horng, D.E., et al., Comparison of R2* correction methods for accurate fat quantification in fatty liver. J Magn Reson Imaging, 2013. 37(2): p. 414-22.
6. Bashir, M.R., et al., Hepatic R2* is more strongly associated with proton density fat fraction than histologic liver iron scores in patients with nonalcoholic fatty liver disease. J Magn Reson Imaging, 2018.
7. Drabsch, T., et al., Associations Between C-Reactive Protein, Insulin Sensitivity, and Resting Metabolic Rate in Adults: A Mediator Analysis. Front Endocrinol (Lausanne), 2018. 9 (556): p. 1-9.
8. Franz, D., et al., Association of proton density fat fraction in adipose tissue with imaging-based and anthropometric obesity markers in adults. Int J Obes (Lond), 2018. 42(2): p. 175-182.
9. Wang, Q., et al., Brown adipose tissue activation is inversely related to central obesity and metabolic parameters in adult human. PLoS One, 2015. 10(4): p. e0123795.
Figures