1941
Proton density fat fraction mapping for tracking tissue changes under weight loss in cancer cachexia1Department of Diagnostic and Interventional Radiology, Technische Universität München, München, Germany, 2Department of Surgery, Technische Universität München, München, Germany
Synopsis
Cancer cachexia, a multifactorial wasting syndrome, affects up to 50% of cancer patients and is a major cause of morbidity and mortality. Proton density fat fraction (PDFF) mapping based on a multi-echo gradient echo acquisition enables spatially-resolved fat quantification and can help characterize tissue changes during the course of cancer cachexia. This study investigates changes in volume and PDFF metrics of adipose tissue induced by weight loss in cancer cachexia.
Purpose
Cancer cachexia is a multifactorial wasting syndrome, characterized by weight loss due to progressive depletion of skeletal muscle with or without loss of adipose tissue (1). It affects up to 50% of cancer patients, negatively influencing quality of life and efficacy of tumor treatment, thus it is associated with poor prognosis (2). Despite its clinical significance, effective approaches in stratifying the risk for developing cachexia are still lacking. Proton density fat fraction (PDFF) mapping based on a multi-echo gradient echo acquisition enables spatially-resolved fat quantification in multiple organs and tissues, and liver PDFF has been emerging as a major metabolic phenotyping parameter (3). However, it remains unknown how the PDFF of adipose tissue develops during the course of cancer cachexia. Therefore, the purpose of this study was to characterize changes in volume and PDFF metrics of adipose tissue induced by weight loss in cancer cachexia.Methods
Subjects & measurements: For this prospective study, 12 patients (9 male, 3 female) with pancreatic (n=1), esophageal (n=10) and laryngeal cancer (n=1) (mean age 63.7 years, range 52-74 years) were recruited. Exclusion criteria were contraindications to MRI. Of the 12 patients, 5 underwent follow-up scans, resulting in 2 patients with 2 and 3 patients with 3 examinations. Time interval between baseline and follow-up scans ranged between 49 and 233 days. Subjects underwent an MRI of the abdomen and pelvis on a 3T scanner (Elition, Philips Healthcare). In order to measure PDFF and volumes of adipose tissue, a six-echo multi-echo gradient echo sequence with bipolar gradients was used at 4 stacks covering a FOV of 580 mm in the feet/head direction starting at the upper the liver dome: TR = 12 ms, TE1 = 1.24 ms, ΔTE = 1.0, flip angle = 5°, bandwidth = 1413 Hz/pixel, 268x200x93 acquisition matrix size, FOV = 400x300x140 mm³, 1.5 mm isotropic voxel size, SENSE with R = 2.5.
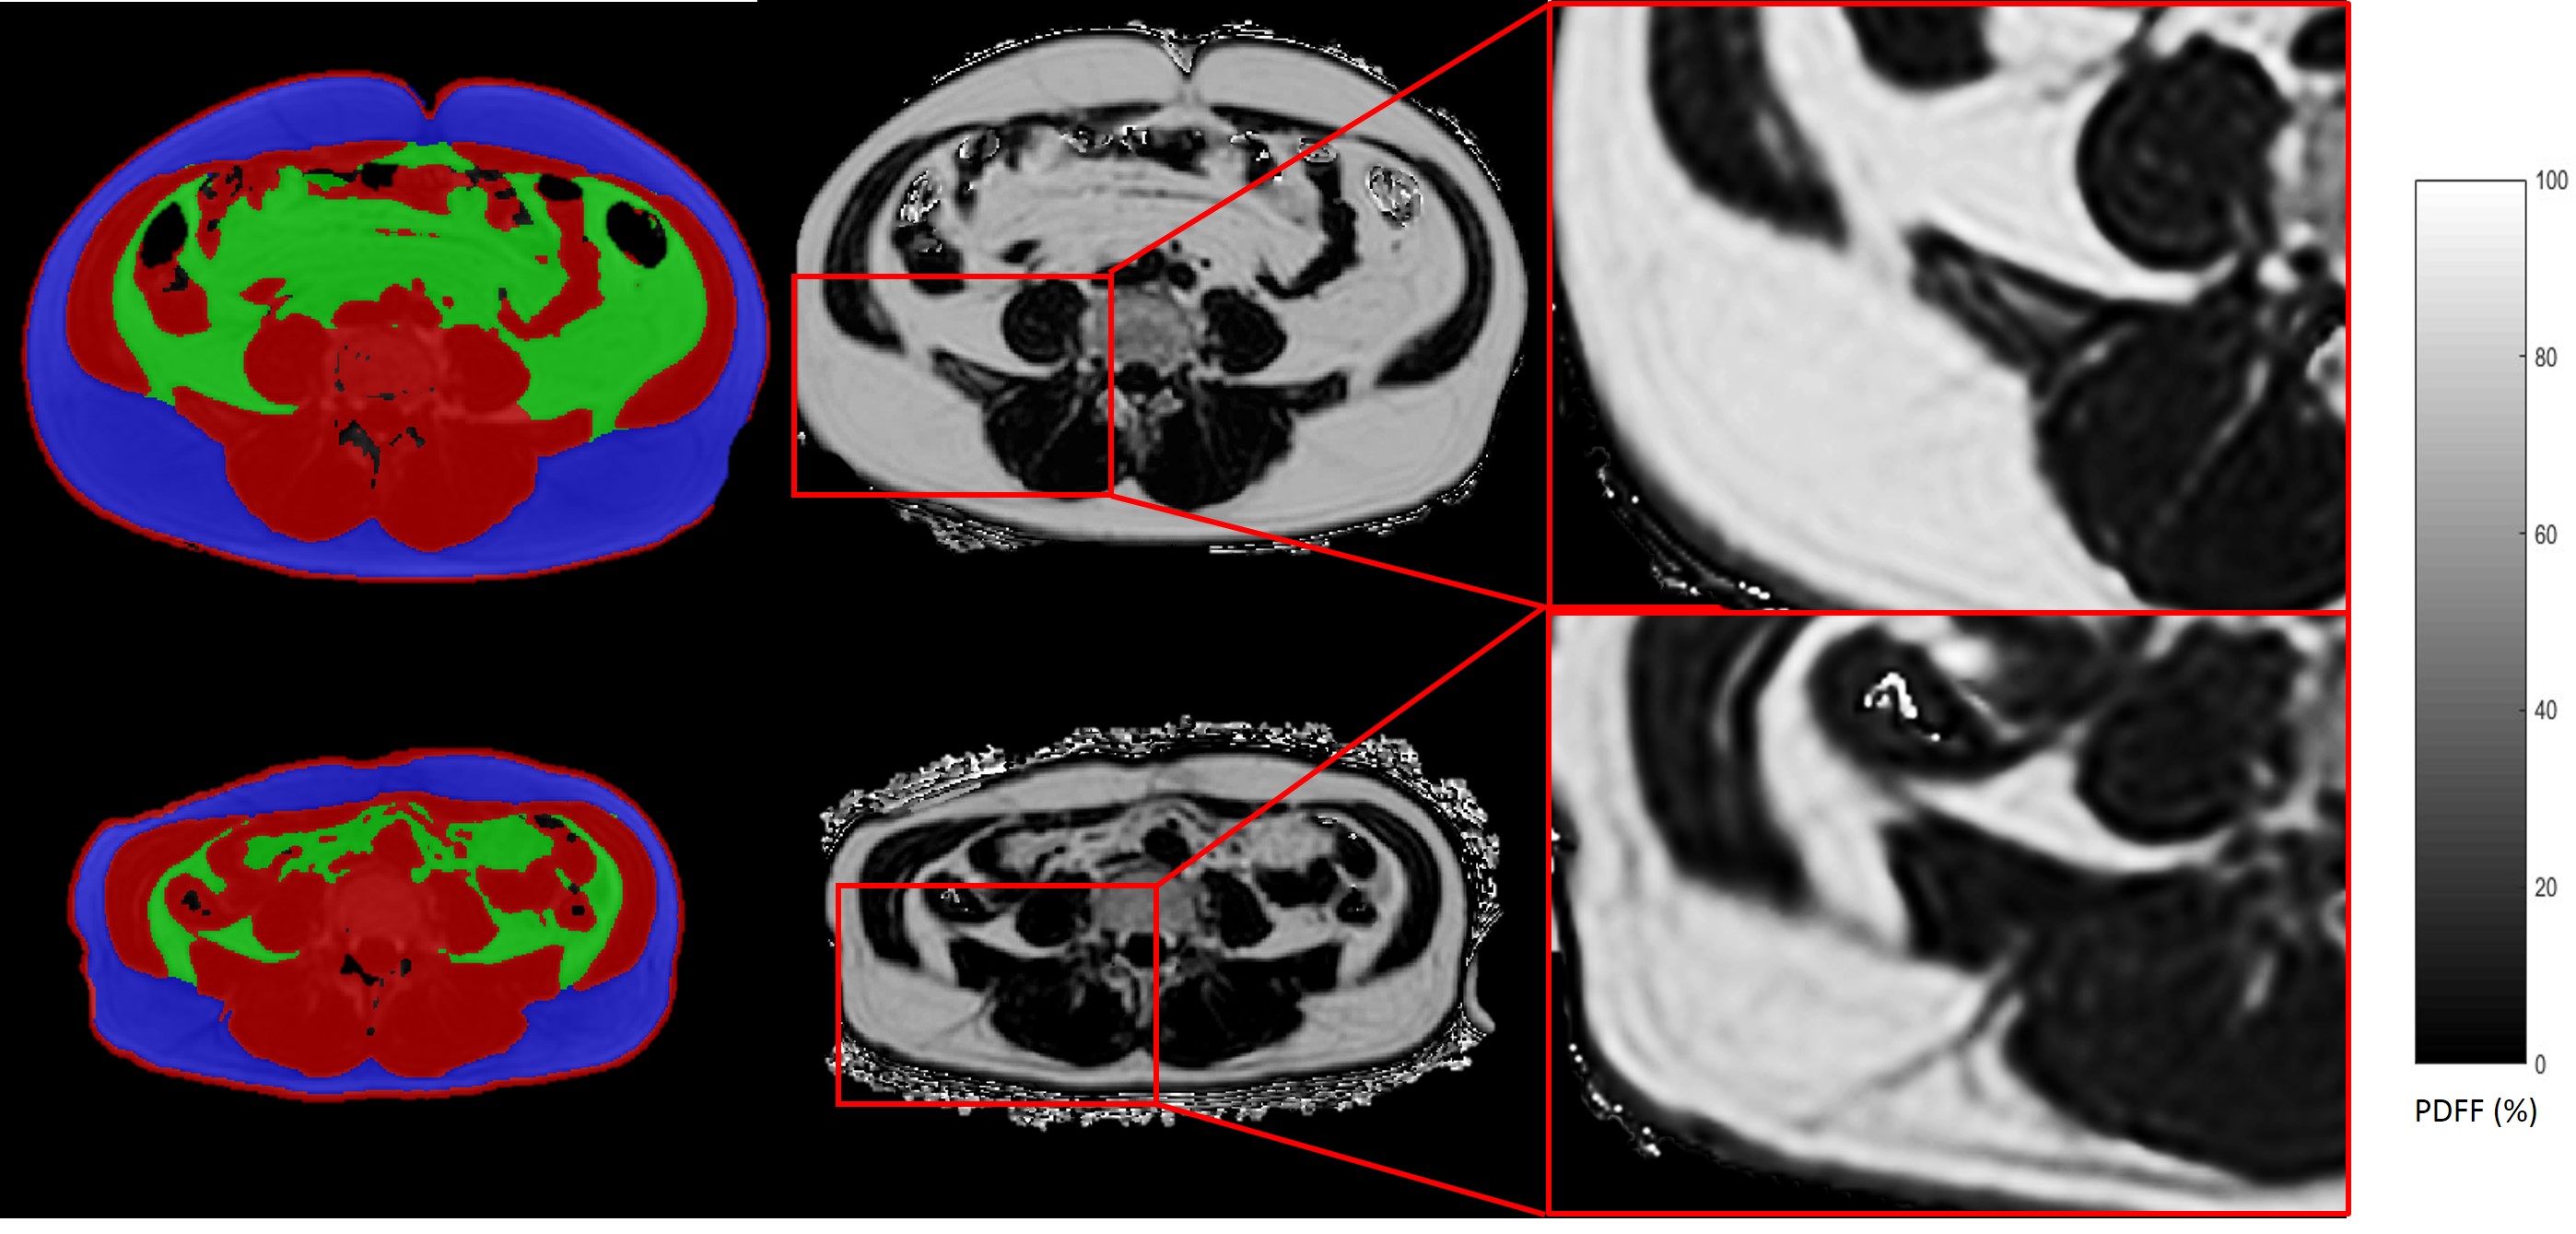
Data analysis: PDFF maps were generated using the online complex-based fat quantification algorithm, accounting for known confounding factors including the presence of multiple fat peaks, a single T2* correction and phase errors. For segmentation of subcutaneous and visceral adipose tissue, a custom-built algorithm was used in ITKSnap (4, 5). Spearman rank correlation was used as statistical test.
Results
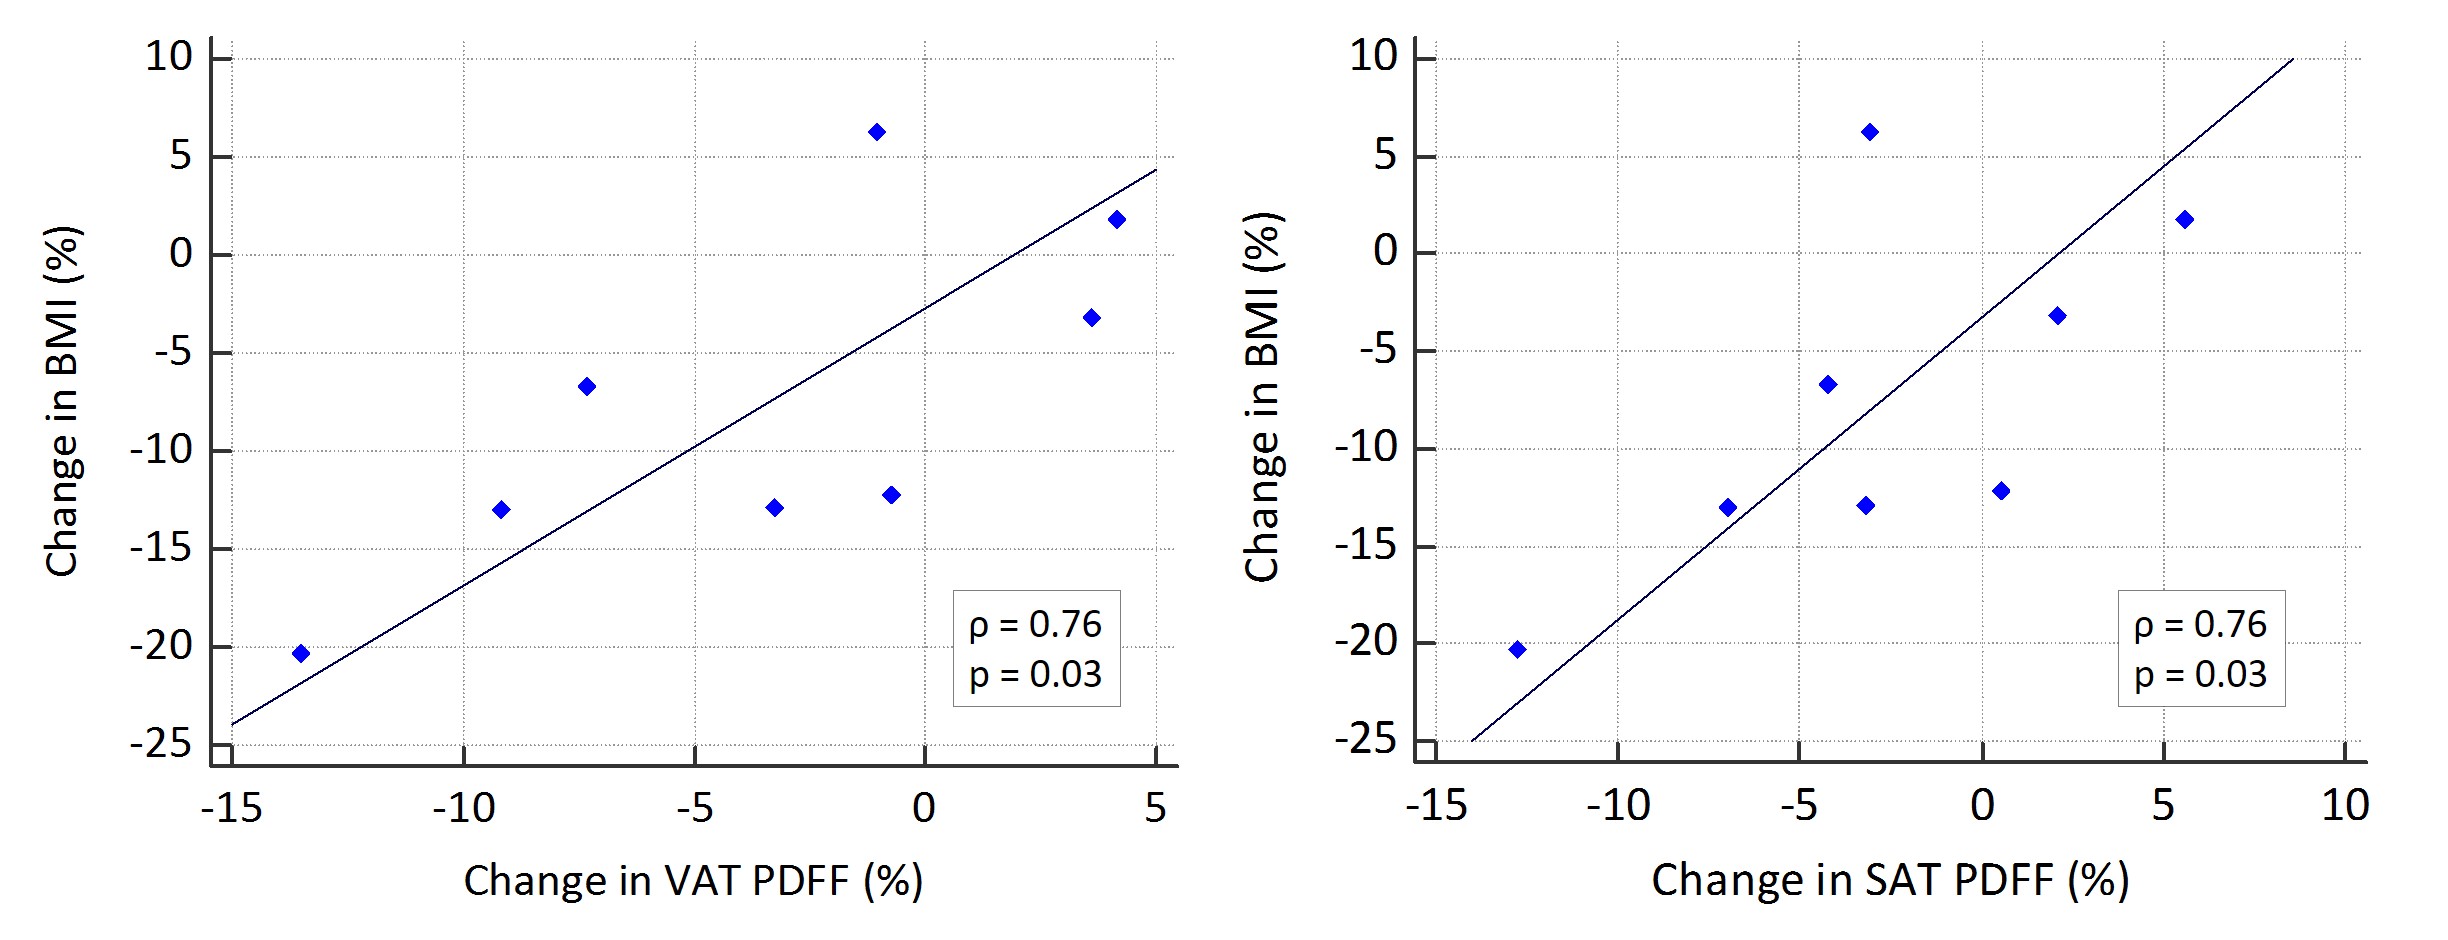
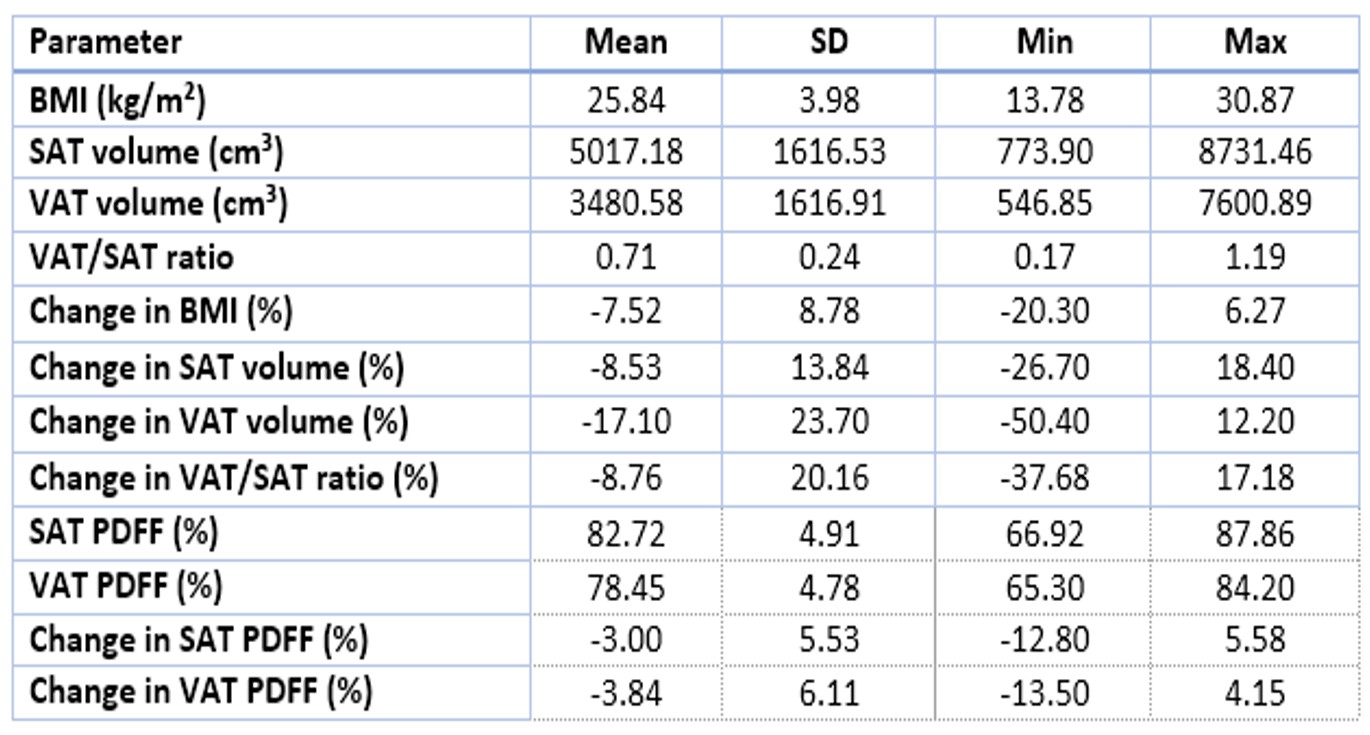
Results of BMI, SAT and VAT volume and PDFF as well as follow-up changes in relation to baseline are shown in Table 1. Cross-sectionally at baseline, VAT PDFF correlated with BMI (rho=0.83, p=0.001) and SAT PDFF tended to correlate with BMI (rho=0.55 p=0.06). Baseline volumes of both SAT and VAT were associated with BMI (SAT: rho=0.6 p=0.04, VAT: rho=0.73 p=0.01). Regarding the longitudinal data, correlation analyses revealed a positive correlation between change in BMI and change in PDFF of both SAT and VAT (rho=0.76, p=0.03 for both SAT and VAT) (Figures 1 and 2). Change in BMI correlated with change in VAT volume (rho=0.74, p=0.04), but not with change in SAT volume. Patients with higher baseline VAT and SAT PDFF tended to have a higher loss in BMI throughout the follow-ups (rho= -0.83, p= 0.01 each). Distribution of adipose tissue (VAT/SAT ratio) and its changes did not show any associations with BMI or tissue characteristics.Discussion & Conclusion
The present study demonstrates that, besides BMI being associated with volumes of VAT and SAT, BMI correlates with PDFF of both SAT and VAT in patients with cancer, which is in accordance with findings in healthy subjects (6). It was shown for the first time that baseline SAT PDFF and baseline VAT PDFF have a strong negative correlation with cancer-induced loss of BMI in cancer patients. Correlations between changes in BMI and PDFF changes in both SAT and VAT were also reported. The present findings thus suggest that adipose tissue PDFF might serve as biomarker for the effects of cachexia on adipose tissue composition, which might be of help diagnosing cancer cachexia in early stages if BMI is misleading, e.g. due to fluid retention. In conclusion, PDFF mapping enables the longitudinal evaluation of tissue changes in cancer cachexia and might be helpful in improving the stratification of cancer patients with increased risk for developing cachexia.Acknowledgements
The present work was supported by the European Research Council (grant agreement No 677661 ‑ ProFatMRI), the German Research Foundation (DFG-SFB824/A9) and Philips Healthcare. This work reflects only the authors´ view and the EU is not responsible for any use that may be made of the information it contains.
References
1. Fearon K, Strasser F, Anker SD, Bosaeus I, Bruera E, Fainsinger RL, et al. Definition and classification of cancer cachexia: an international consensus. Lancet Oncol. 2011;12(5):489-95. DOI: 10.1016/S1470-2045(10)70218-7
2. Tisdale MJ. Mechanisms of cancer cachexia. Physiol Rev. 2009;89(2):381-410. DOI: 10.1152/physrev.00016.2008
3. Hu HH, Kan HE. Quantitative proton MR techniques for measuring fat. NMR Biomed. 2013;26(12):1609-29. DOI: 10.1002/nbm.3025
4. Cordes C, Dieckmeyer M, Ott B, Shen J, Ruschke S, Settles M, et al. MR-detected changes in liver fat, abdominal fat, and vertebral bone marrow fat after a four-week calorie restriction in obese women. J Magn Reson Imaging. 2015;42(5):1272-80. DOI: 10.1002/jmri.24908
5. Shen J, Baum T, Cordes C, Ott B, Skurk T, Kooijman H, et al. Automatic segmentation of abdominal organs and adipose tissue compartments in water-fat MRI: Application to weight-loss in obesity. Eur J Radiol. 2016;85(9):1613-21. DOI: 10.1016/j.ejrad.2016.06.006
6. Franz D, Weidlich D, Freitag F, Holzapfel C, Drabsch T, Baum T, et al. Association of proton density fat fraction in adipose tissue with imaging-based and anthropometric obesity markers in adults. Int J Obes (Lond). 2018;42(2):175-82. DOI: 10.1038/ijo.2017.194
Figures