1939
Non-invasive assessment of early stage diabetic nephropathy by BOLD and DTI MRI1Medical Imaging Center, First Affiliated Hospital, Jinan university, guangzhou, China, 2GE Healthcare, MR Research China, Beijing, China
Synopsis
Although the specific pathogenesis of diabetic nephropathy (DN) has not yet been clearly elucidated, it has been acknowledged that the development of kidney hypoxia is an early manifestation of the diabetic kidney. In past decades, blood oxygenation level dependent (BOLD) imaging was extensively applied to assess the tissue oxygenation levels, and diffusion imaging was demonstrated the capacity of detecting the tissue damage induced by acute or chronic hypoxia. Hence, to test whether the early DN patients can be detected using both BOLD and diffusion tensor imaging, in current study, patients with diabetes mellitus, diabetic nephropathy and Health volunteers were analyzed.
Introduction
Materials and methods
Result
Discussion and Conclusion
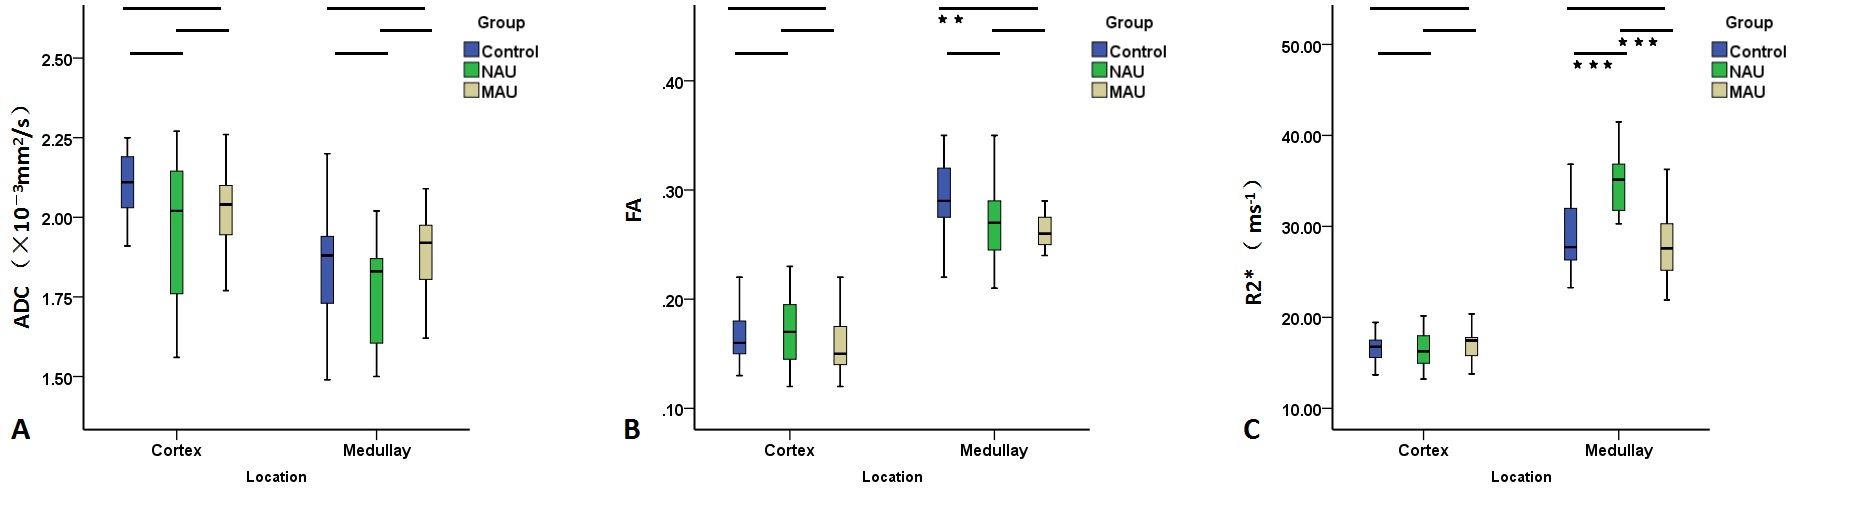
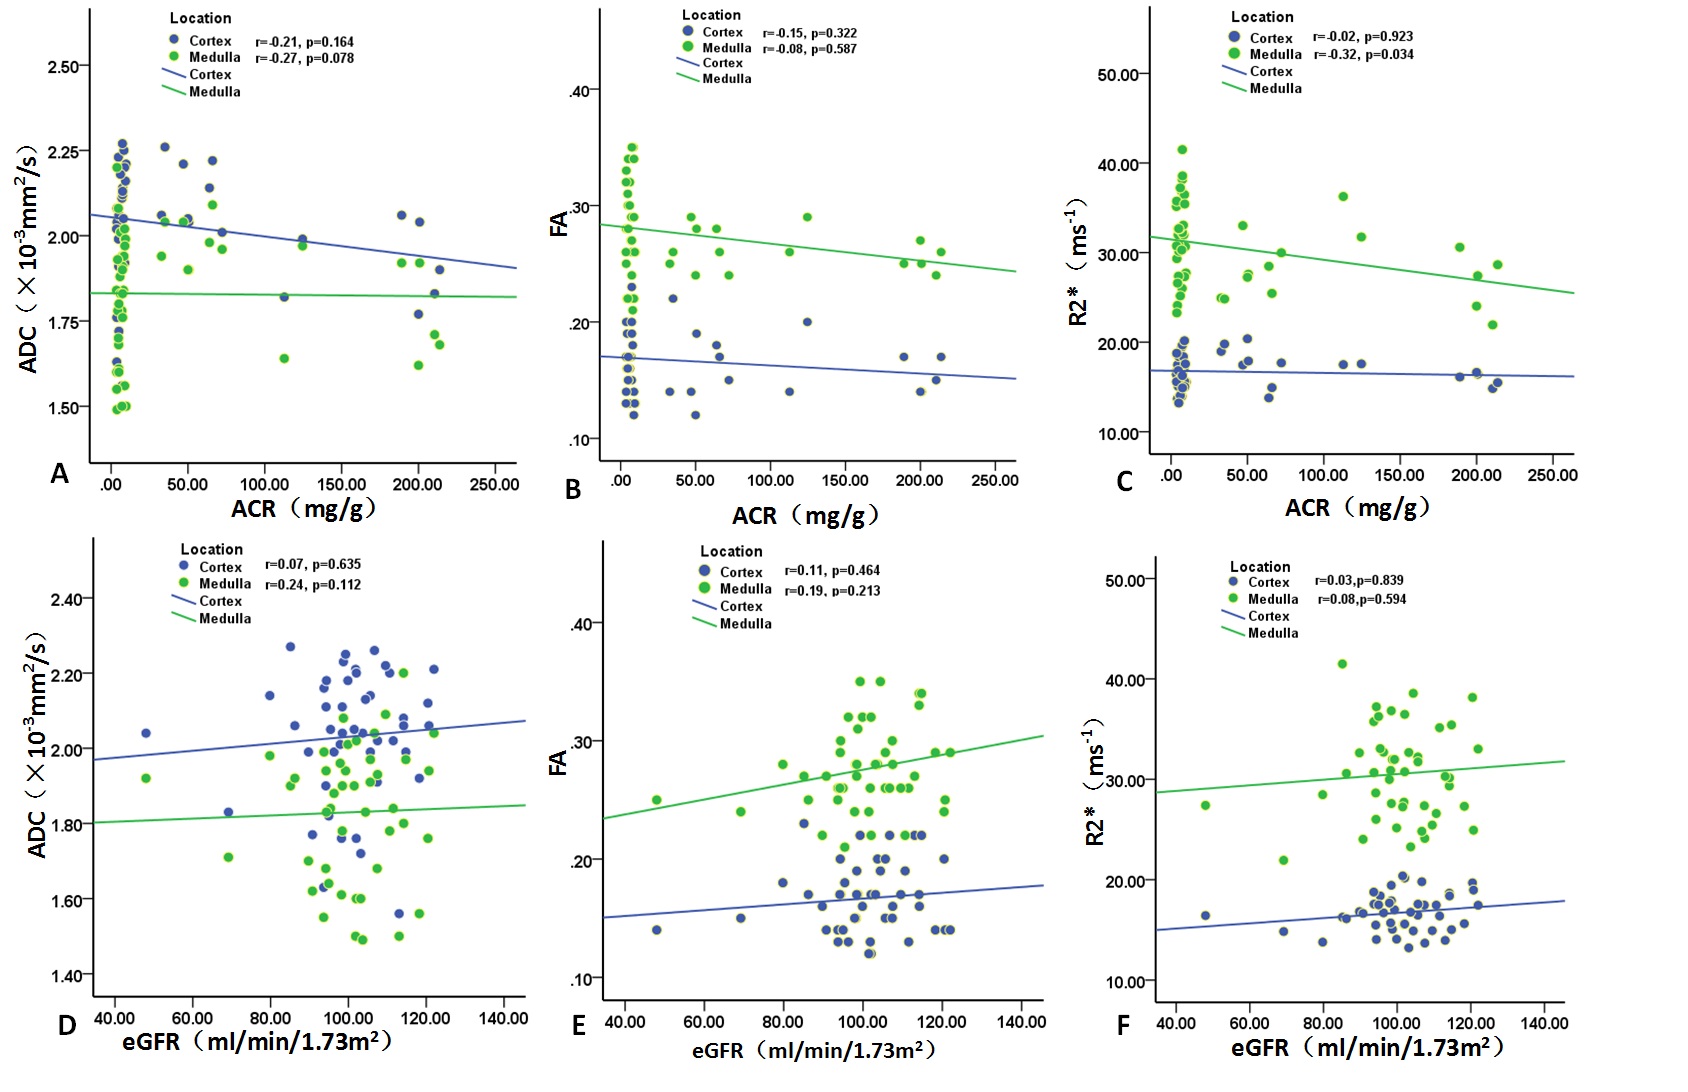
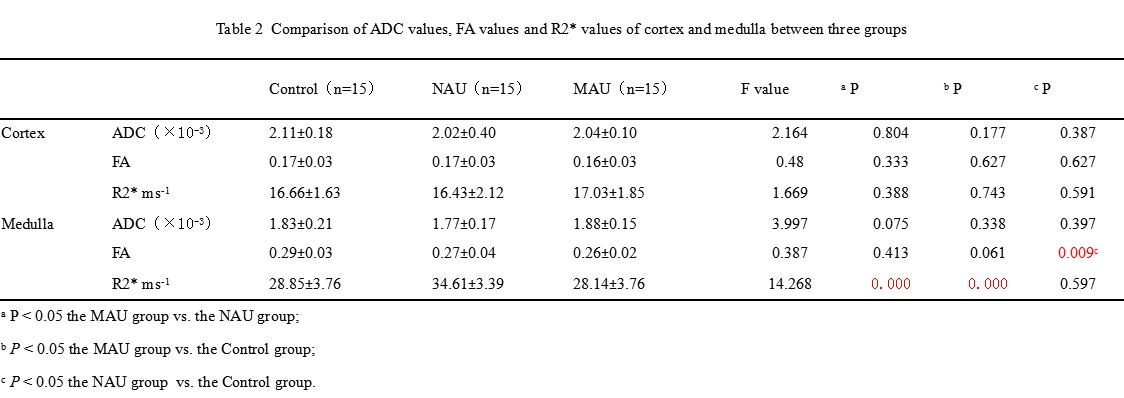
In the clinical practice, the appearance of microalbuminuria is usually considered as the earliest clinical indicator of DN. But this paradigm of early DN has been further questioned because a decrease in the renal function of a diabetic patients is not always accompanied by increased albuminuria4. There is a long silent period without overt clinical signs and symptoms of nephropathy prior to the onset of microalbuminuria. Our results indicated medullary hypoxia (reflected by R2* value) occurring in the earlier stage (normoalbuminuria stage) and then its oxygen consumption decreasing to the close normal level in the clinically early DN stage (microalbuminuria stage). The increased oxygen consumption in renal medulla was thought to be mainly related to an increase in metabolic activity, such as glomerular hyperfiltration, active reabsorption of excess sodium, increased Na+/K+–ATPase activity and so on 5-10. Accordingly, we assumed that the renal progressive pathological changes have developed over a long silent period but this subset of diabetic patients don’t exhibit the proteinuria11. Based on this assumption, Medullary R2* value might be a new more sensitive predictor of early DN. Meanwhile, BOLD imaging detected the medullary hypoxia at the simply diabetic stage, while DTI didn’t identify the medullary directional diffusion changes at this stage. Based on our assumption mentioned above, It’s presumable that BOLD imaging may be more sensitive for assessment of the early renal function changes than DTI.Acknowledgements
No acknowledgement found.References
1. Mogensen CE. Early glomerular hyperfiltration in insulin-dependent diabetics and late nephropathy. Scandinavian journal of clinical and laboratory investigation. 1986;46(3):201-206.
2. Feng YZ, Chen XQ, Yu J, et al. Intravoxel incoherent motion (IVIM) at 3.0 T: evaluation of early renal function changes in type 2 diabetic patients. Abdominal radiology (New York). 2018.
3. Chen X, Xiao W, Li X, He J, Huang X, Tan Y. In vivo evaluation of renal function using diffusion weighted imaging and diffusion tensor imaging in type 2 diabetics with normoalbuminuria versus microalbuminuria. Frontiers of medicine. 2014;8(4):471-476.
4. Caramori ML, Fioretto P, Mauer M. The need for early predictors of diabetic nephropathy risk: is albumin excretion rate sufficient? Diabetes. 2000;49(9):1399-1408.
5. Ries M, Basseau F, Tyndal B, et al. Renal diffusion and BOLD MRI in experimental diabetic nephropathy. Blood oxygen level-dependent. Journal of magnetic resonance imaging : JMRI. 2003;17(1):104-113.
6. Palm F, Cederberg J, Hansell P, Liss P, Carlsson PO. Reactive oxygen species cause diabetes-induced decrease in renal oxygen tension. Diabetologia. 2003;46(8):1153-1160.
7. Wald H, Scherzer P, Popovtzer MM. Enhanced renal tubular ouabain-sensitive ATPase in streptozotocin diabetes mellitus. The American journal of physiology. 1986;251(1 Pt 2):F164-170.
8. Farman N, Corthesy-Theulaz I, Bonvalet JP, Rossier BC. Localization of alpha-isoforms of Na(+)-K(+)-ATPase in rat kidney by in situ hybridization. The American journal of physiology. 1991;260(3 Pt 1):C468-474.
9. Barthelmebs M, Stephan D, Fontaine C, Grima M, Imbs JL. Vascular effects of loop diuretics: an in vivo and in vitro study in the rat. Naunyn-Schmiedeberg's archives of pharmacology. 1994;349(2):209-216.
10. Barth M, Moser E. Proton NMR relaxation times of human blood samples at 1.5 T and implications for functional MRI. Cellular and molecular biology (Noisy-le-Grand, France). 1997;43(5):783-791.
11. Schrijvers BF, De Vriese AS, Flyvbjerg A. From hyperglycemia to diabetic kidney disease: the role of metabolic, hemodynamic, intracellular factors and growth factors/cytokines. Endocrine reviews. 2004;25(6):971-1010.
Figures