1938
Can MRI Determined ectopic pancreatic fat and volume be used as a discriminant marker to screen for diabetics.Sonal Krishan1
1Medanta Hospital, South City 2, India
Synopsis
By identifying
Purpose
Fat infiltration in pancreas results in beta cell dysfunction and hyperglycemia and may be linked to metabolic syndrome.Obesity and metabolic syndrome result in ectopic fat deposition in organ systems like liver, (as was proven by numerous studies), other organ systems include skeletal muscles, the heart and the pancreas. Fat accumulation in the pancreas may lead to inflammation, or “non-alcoholic steato-pancreatitis”. There have been studies linking fatty pancreas to hepatic steatosis, obesity, insulin resistance and metabolic syndrome.In this study we wanted to assess and correlate the difference if any, in the ectopic pancreatic lipid deposition and volume in clinically proven diabetic patients vs healthy controls. We aimed to determine whether pancreatic fat deposition is greater in patients with diabetes than healthy controls.Methods
In this retrospective pilot case-control study, ectopic fat deposition in pancreas and pancreatic volume were calculated and compared in patients with diabetes versus healthy population (40 each). The analysis was done by two experienced radiologists, who were blinded to the clinical data, using previously validated 3D GRE complex based proton density fat fraction (MRI-PDFF) maps. In order to assess the PDFF across the pancreas, 4 regions of interest (ROIs) of minimum 1 cm2 each were placed in the head, neck, body and tail of pancreas and the mean of all ROIs was calculated.T1 volumetric interpolated breath-hold examination (VIBE) images were used to calculate pancreatic volume by interpolation on dedicated 3-D reconstruction software- hand-contouring of pancreatic outline on each slice was done and total volume calculated. Two tailed T-test was used for evaluation of the difference in the mean pancreatic fat and volume between the two groups. A multivariate linear regression model was used also to compare pancreatic MRI-PDFF between groups after adjusting for differences in age, sex, BMI and liver fat.Results
The mean pancreatic fat in diabetics was 22.4 + 2.5 % (mean+1SD) vs 5.77 + 2.2 % in control group. Mean pancreatic volume was 39.8+4.4 cc in diabetics vs 67.7 + 7.7 cc in healthy controls. Compared to healthy controls, patients with diabetes had significantly higher pancreatic MRI-PDFF (95% confidence interval difference 14.3-16.9, p value < 0.0001) and lower pancreatic volume (95% confidence interval difference - 30 to -24, p value < 0.0001) and these results remained consistent in multivariable-adjusted models including age, sex, BMI and liver fat.Discussion
Pancreatic volume and fat can be measured reliably using MRI. There is a correlation between ectopic fat distribution and pancreatic volume in diabetic patients as compared to healthy population. MRI should prove useful in determining the natural history of pancreatic atrophy and ectopic fat deposition in diabetes. This is the first such data from Asian population.Conclusion
MRI has potential as a novel non-invasive biomarker to quantify pancreatic fat and pancreatic atrophy in patients with impaired glucose tolerance.Acknowledgements
No acknowledgement found.References
- Garcia TS, Rech TH2, Leitão CB Pancreatic size and fat content in diabetes: A systematic review and meta-analysis of imaging studies. PLoS One. 2017 Jul 24;12(7):e0180911. doi: 10.1371/journal.pone.0180911. eCollection 2017.
- Heber SD, Hetterich H, Lorbeer R2, Bayerl C et al Pancreatic fat content by magnetic resonance imaging in subjects with prediabetes, diabetes, and controls from a general population without cardiovascular disease.PLoS One. 2017 May 17;12(5):e0177154. doi: 10.1371/journal.pone.0177154. eCollection 2017.
- Al-Mrabeh A, Hollingsworth KG, Steven S et al Quantification of intrapancreatic fat in type 2 diabetes by MRI.PLoS One. 2017 Apr 3;12(4):e0174660. doi: 10.1371/journal.pone.0174660. eCollection 2017.
Figures
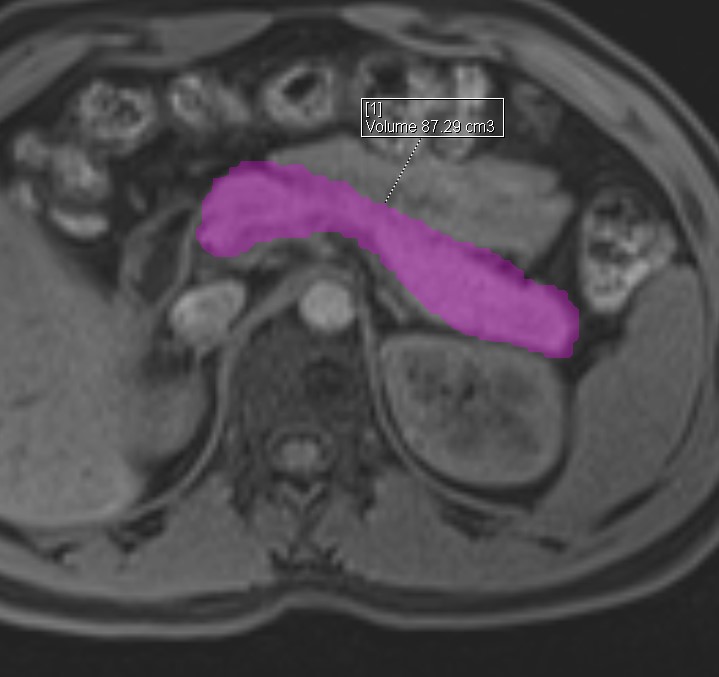
Fig 1: VIBE image showing hand-contouring of pancreatic outline for calculation
of pancreatic volume by interpolation.
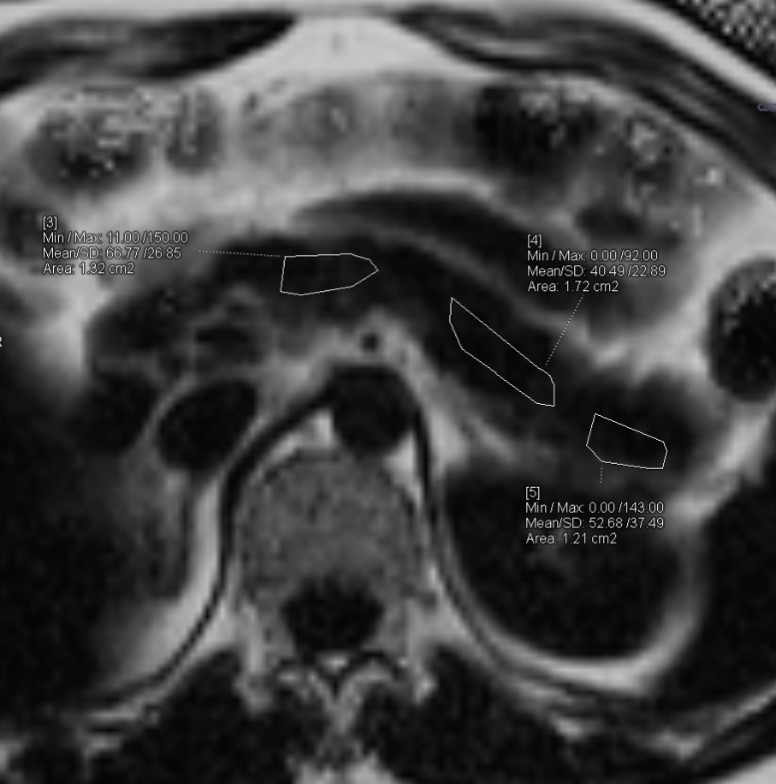
Fig 2: (MRI-PDFF) map showing assessment of PDFF across the pancreas; depicting 3 regions of interest (ROIs) (of minimum 1 cm2) placed in the neck, body and tail of pancreas.