1937
Pre-clinical fatty acid composition estimate of adipose tissue using echo planar spectroscopic imaging (EPSI) at 4.7T1Univ Lyon, INSA‐Lyon, Université Claude Bernard Lyon 1, UJM-Saint Etienne, CNRS, Inserm, CREATIS UMR 5220, U1206, F69621, Lyon, France, Lyon, France
Synopsis
This pilot study performed on a preclinical system at 4.7T shows the feasibility of using the echo planar spectroscopic imaging sequence (EPSI with a spin echo) to quantify the fatty acid composition. This sequence permitted to image separately each resonating component of fat spectrum. The signal of the EPSI sequence was compared with more standard spectroscopic sequence used for the fatty acid quantification (PRESS). The quantification results from the EPSI sequence on calibrated phantom were consistent with gas chromatography theoretical values. The in vivo acquisition showed a significant difference of the fatty acid composition between the subcutaneous and the visceral adipose tissue, consistent with published monovoxel results.
Introduction
In the past decade, some MRS1–3 and MRI4,5 methods have emerged to quantify fatty acid composition i.e. proportion of polyunsaturated (PUFA), monounsaturated (MUFA) and saturated (SFA) fatty acid. In a clinical context at 3T, some studies5–7 demonstrated the feasibility of using a 3D spoiled-gradient multiple echo sequence (MGE) to estimate the fatty acid composition. This technique is based on an echo spacing (ΔTE) chosen in order to have alternatively the water (at 4.7 ppm) and the principal peak of fat (at 1.3 ppm) in phase or out-of-phase. In the preclinical context at 4.7T, the use of MGE requires relatively short ΔTE which are not always directly achievable with oscillating gradients but involves several interleaved echo trains. Moreover, with regular MGE, it is usually not possible to reconstruct a spectrum sufficiently resolved in the frequency domain. Monovoxel spectroscopic sequences such as PRESS and STEAM are mainly used for lipid quantification (content and composition) in small animal. However, for adipose tissue examination, the positioning of a spectroscopic voxel can be difficult to acquire without significant partial volume effects. In this preclinical context, we suggest to use a spectroscopic imaging sequence as EPSI (echo planar spectroscopic imaging) to detect and quantify the fatty acid composition. This sequence represents a good compromise between spatial and spectral resolutions. Here we presented the pilot study on three oils and on one mouse.Method
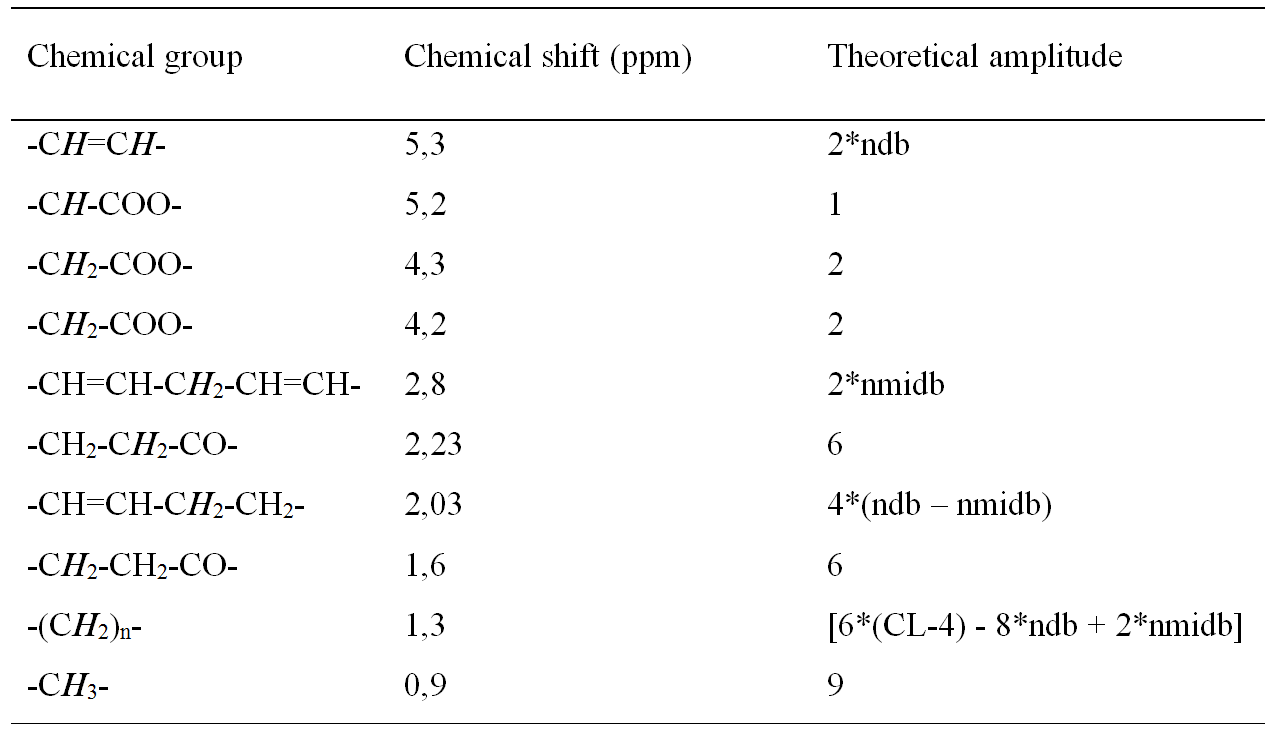
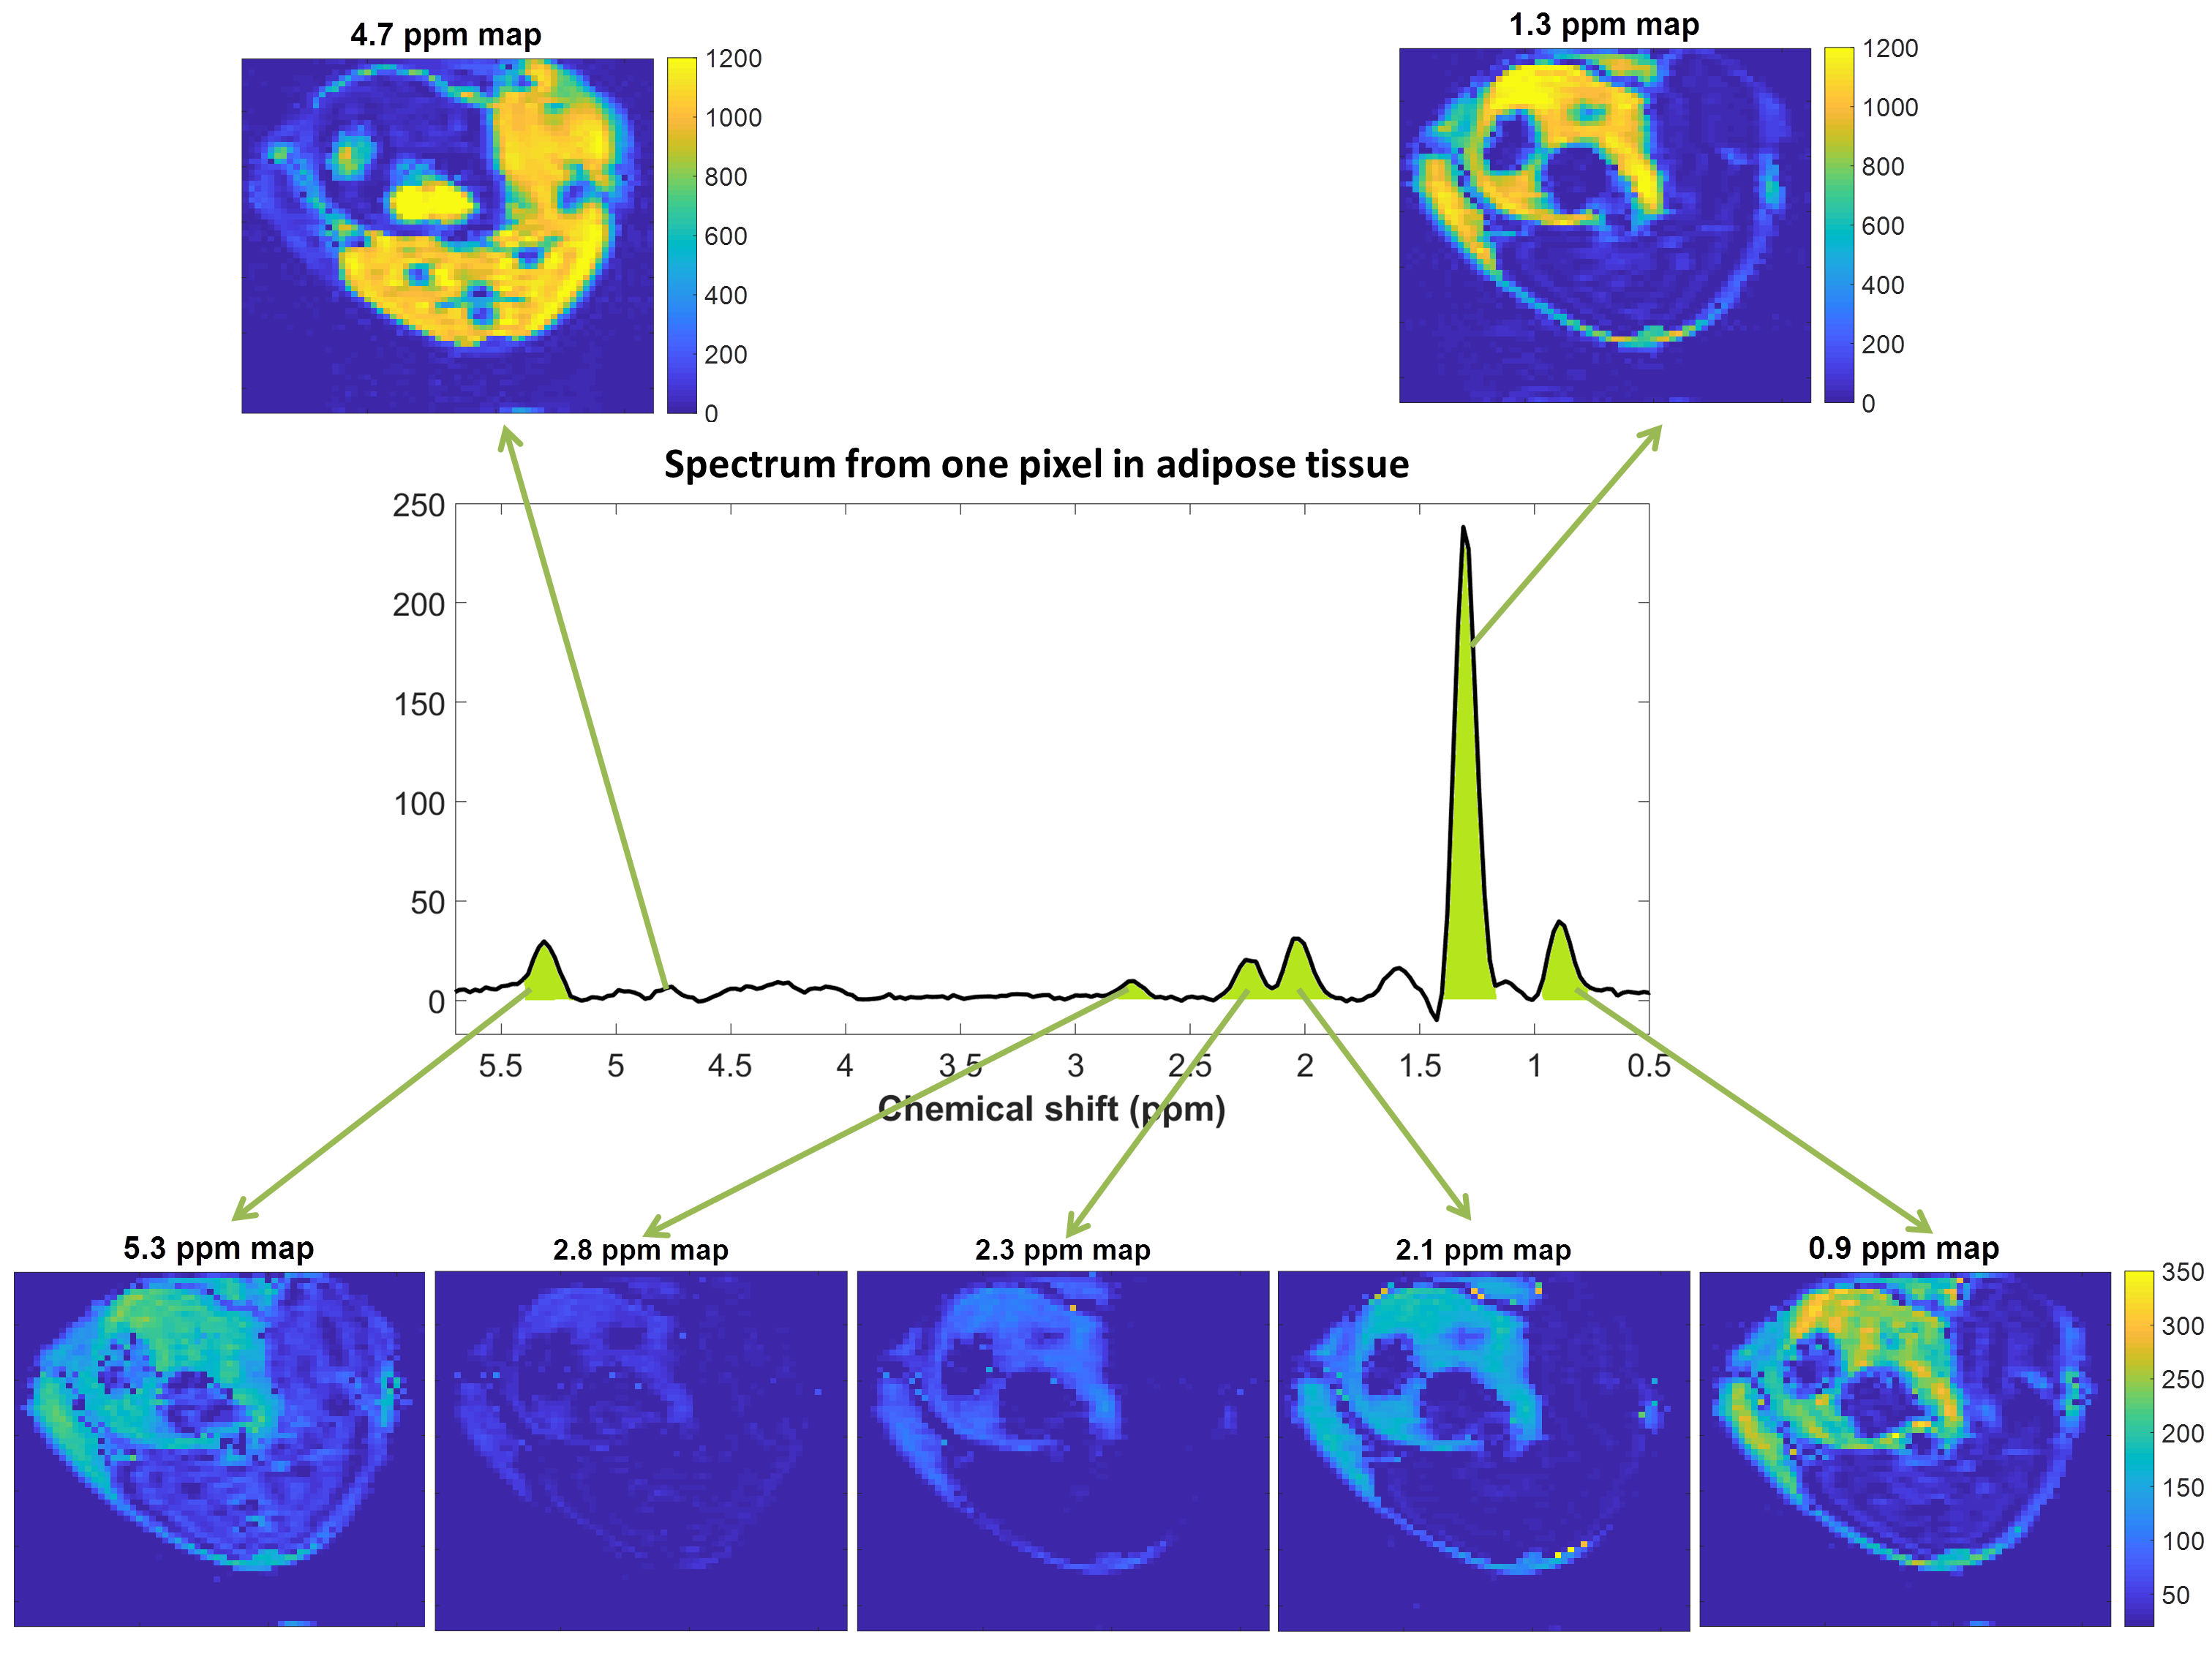
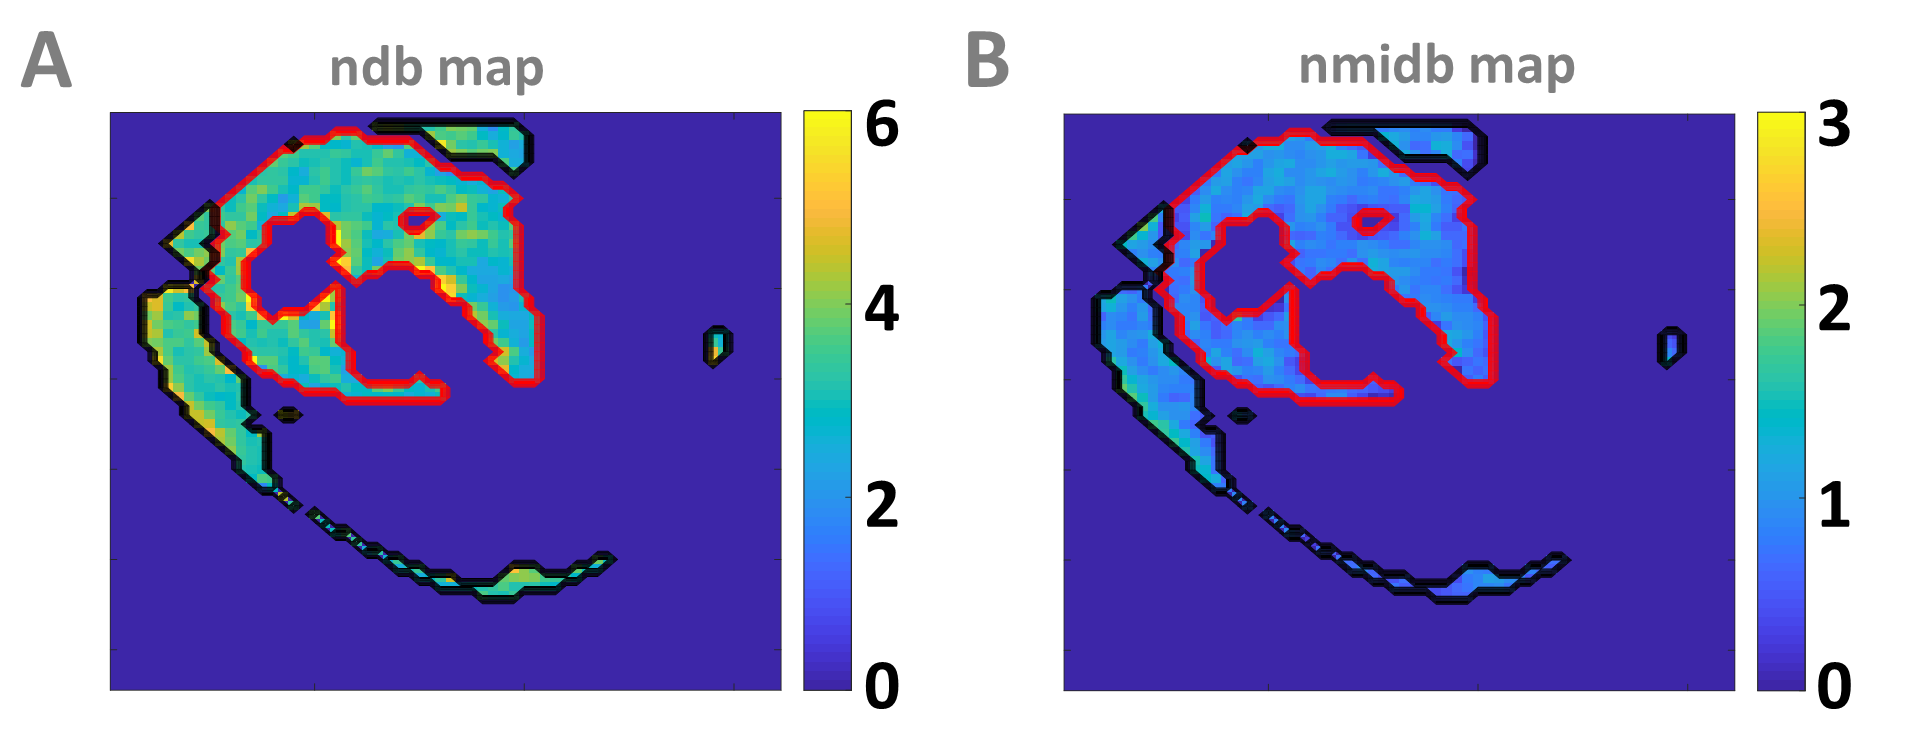
Signals acquired on oil with the EPSI-SE sequence and those acquired with a PRESS (double spin echo) sequence were compared. The EPSI-SE acquisition parameters were: 1.5 s TR , 1 accumulation, ΔTE = 0.422 msec, 512 points, 64 x 64 matrix , 30 x 30 mm2 field of view of, 5 mm slice thickness,TE = 10 msec and a total acquisition time of 48s. The PRESS parameters were: 3s TR , 16 accumulations, temporal resolution of 0.249 ms, size of the voxel of 5 x 5 x 5 mm3, (TE1 = 7.5 TE2 = 7.5) TE= 15 msec, and 48s acquisition time. This protocol was applied to a phantom made of three tubes (linseed oil, nuts and rapeseed) on which the fatty acid compositions were characterized by gas chromatography. The same protocol was applied in vivo on a mouse with 2 accumulations for the EPSI-SE on slice located in the lower abdomen, with a thickness of 2.5 mm. A home-made post-processing was implemented to correct for bipolar gradient effect and B0 inhomogeneity on EPSI-SE images. Then, for each voxel, the corresponding spectrum was frequency aligned to have the principal peak of fat at 1.3 ppm and the water at 4.7 ppm. Each resonating component of fat (described in table 1) could be imaged separately as shown in the figure 1. The ndb and nmidb maps (figure 2) were computed as:
$$$nmidb=\frac{A_{2.8}}{A_{0.9}}\times\frac{9}{2}$$$
$$$ndb=\left(\frac{A_{2.8}}{A_{0.9}}\times9-1\right)\times\frac{1}{2}$$$
where Ax represents the air under the curve for the resonating component at x ppm. Indices of PUFA, MUFA and SFA were computed as:
$$$PUFA_{idx}=\frac{nmidb}{3}\times100$$$
$$$MUFA_{idx}=\frac{ndb-2\times{nmidb}}{3}\times100$$$
$$$SFA_{idx}=100-PUFA_{idx}-MUFA_{idx}$$$
Results
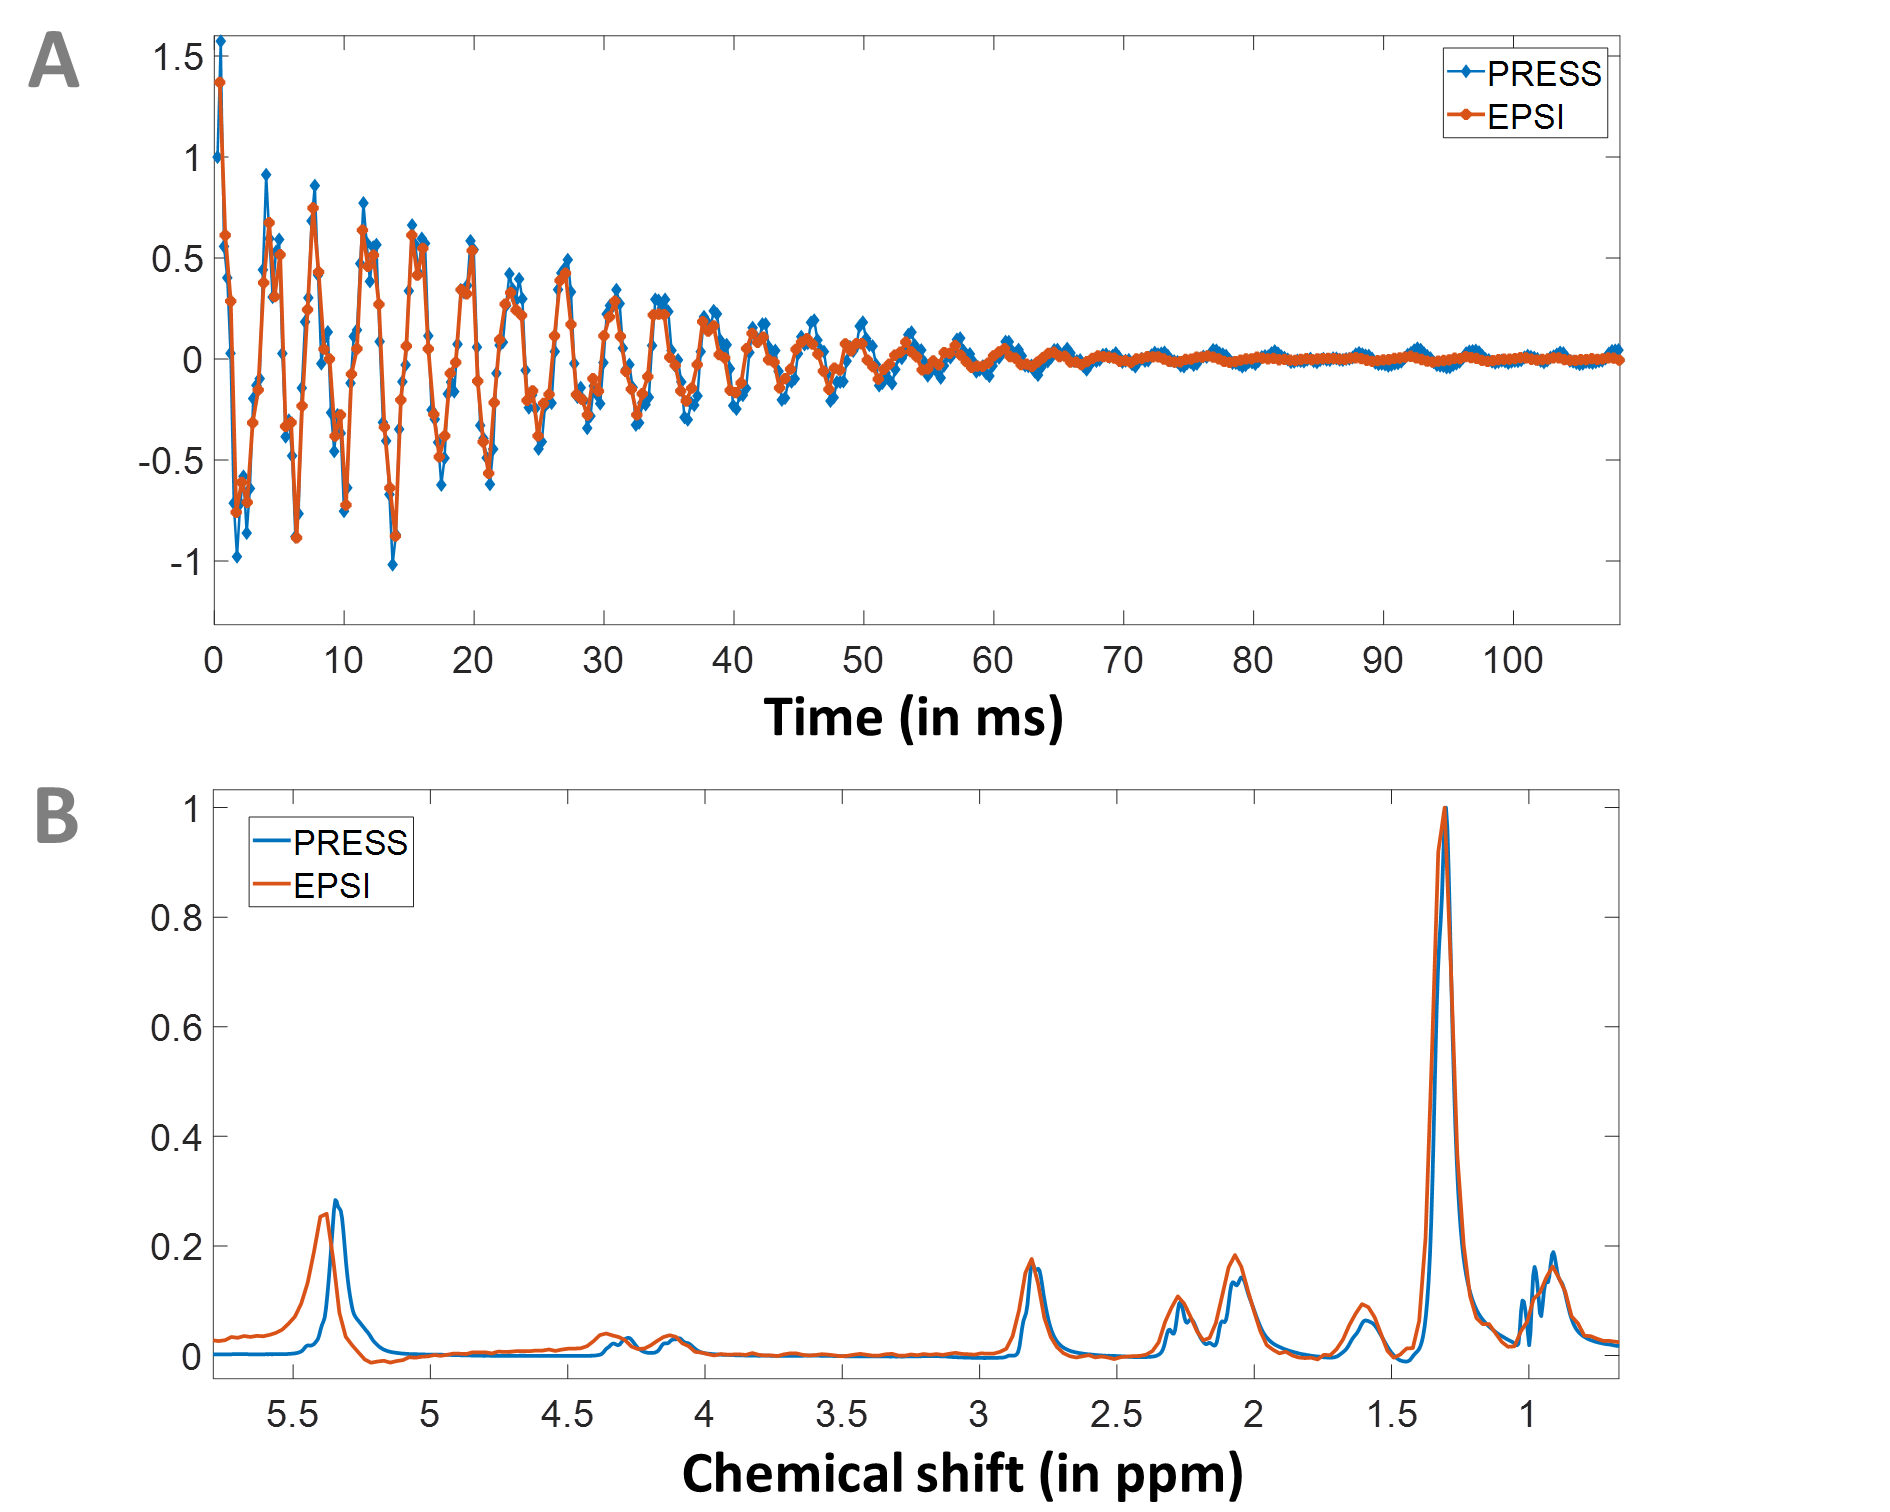
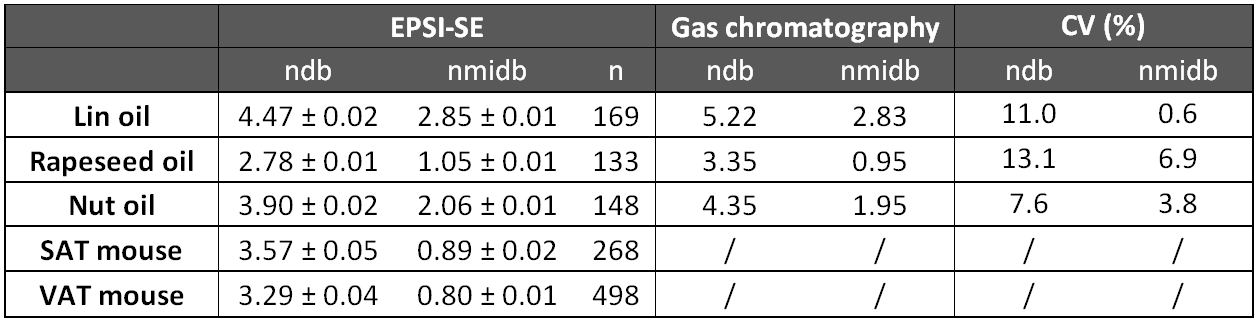
Figure 3 shows very similar signals between the PRESS (double spin echo) and EPSI-SE (single spin echo) sequences. On the spectrum of EPSI, the peak at 5.3 ppm was slightly shifted compared to the PRESS. Table 2 summarizes the results of ndb and nmidb for in vitro and in vivo measurements using EPSI-SE sequence and gas chromatography. The subcutaneous adipose tissue (SAT) was composed, in average, of: PUFAidx = 29.7%, MUFAidx = 59.7%, SFAidx = 10.6%. The visceral adipose tissue (VAT) was composed, in average,of: PUFAidx = 26.7%, MUFAidx = 56.3%, SFAidx = 17%. For the in vivo measurement on the mouse, the ndb and the nmidb of SAT were significantly higher than the ndb and nmidb of VAT (ndb: + 0.28, t-test p < 0.001; nmidb: + 0.09, t-test p < 0.001).Discussion/Conclusion
In conclusion, we demonstrated that the use of the EPSI-SE sequence enabled to obtain a similar spectrum as with the PRESS sequence. The EPSI-SE sequence has two advantages: 1) being spatially resolved; 2) having a unique refocusing pulse which enables to reach smaller TE and reduces the bias due to additional T2 signal decay. The quantification of ndb and nmidb was obtained by integrating the area under the curve which can lead to quantification errors in case of distorted baseline and could be made more robust with fitting procedure. The in vitro results provided consistent values of nmidb and underestimated value of ndb compared to gas chromatography. The in vivo results were consistent with published monovoxel results1 where PUFAidx = 23.4%, MUFAidx = 62.8%, SFAidx = 11.8%.Acknowledgements
This study was conducted as part of the LABEX PRIMES (ANR‐11‐LABX‐0063) of the “Université de Lyon”, within the “Investissements d'Avenir”program (ANR‐11‐IDEX‐0007) operated by the French National Research Agency (ANR). In vitro and in vivo acquisitions were performed on the PILoTplatform, member of the France Life Imaging network (grant ANR‐11‐INBS‐0006).References
1. Strobel K, Hoff J van den, Pietzsch J. Localized proton magnetic resonance spectroscopy of lipids in adipose tissue at high spatial resolution in mice in vivo. J Lipid Res. 2008;49(2):473-480.
2. Lundbom J, Hakkarainen A, Fielding B, et al. Characterizing human adipose tissue lipids by long echo time 1H-MRS in vivo at 1.5 Tesla: validation by gas chromatography. NMR Biomed. 2010;23(5):466-472.
3. Hamilton G, Yokoo T, Bydder M, et al. In vivo characterization of the liver fat 1H MR spectrum. NMR Biomed. 2011;24(7):784-790.
4. Peterson P, Månsson S. Simultaneous quantification of fat content and fatty acid composition using MR imaging. Magn Reson Med. 2013;69(3):688-697.
5. Leporq B, Lambert SA, Ronot M, et al. Quantification of the triglyceride fatty acid composition with 3.0 T MRI. NMR Biomed. 2014;27(10):1211-1221.
6. Leporq B, Lambert SA, Ronot M, et al. Hepatic fat fraction and visceral adipose tissue fatty acid composition in mice: Quantification with 7.0T MRI. Magn Reson Med. 2016;76(2):510-518.
7. Nemeth A, Segrestin B, Leporq B, et al. 3D Chemical Shift-Encoded MRI for Volume and Composition Quantification of Abdominal Adipose Tissue During an Overfeeding Protocol in Healthy Volunteers. J Magn Reson Imaging. 2018.
Figures