1936
Towards MR-based interrogation of adipose tissue pO2.Darya Morozov1, James D. Quirk1, and Scott C. Beeman1
1Radiology, Washington University in St. Louis, School of Medicine, St. Louis, MO, United States
Synopsis
There is a significant body of evidence suggesting that adipose hypoxia triggers systematic insulin resistance and type 2 diabetes. Non-invasive and longitudinal characterization of adipose tissue oxygenation during adipose tissue expansion would provide critical insight into the pathogenesis of type 2 diabetes. The major purpose of this study is to develop a non-invasive and quantitative measures of adipose oxygenation by MR. Our approach is based on exploiting the paramagnetic nature of O2 which can directly affect the lipid 1H longitudinal relaxation. We show that simple inversion recovery MR method can be potentially used for non-invasive quantification of adipose tissue hypoxia.
Introduction
Obesity is thought to be a causal pathway to insulin resistance and thus type 2 diabetes; however, not all people with obesity become insulin resistant1. Indeed, the causal mechanisms behind the pathogenesis of insulin resistance and type 2 diabetes are unknown. Interrogation of the dichotomy of those with obesity who develop insulin resistance and those who do not might inform on the unknown pathogenesis of insulin resistance and type 2 diabetes. Recent studies suggest that adipose hypoxia is a primary pathway to systematic insulin resistance and type 2 diabetes2-3– a mechanism which might account for the divergence between “healthy” and insulin-resistant people with obesity. The adipose-hypoxia-driven insulin resistance hypothesis has typically been interrogated postmortem by histologic observation and assay of hypoxia biomarkers (e.g., HIF-1α and pimonidazole). Additionally, invasive platinum Clark-type electrodes and fiber optic probes can be surgically implanted into tissue to provide a direct measure of tissue oxygenation, though these measurements are contaminated by the non-homeostatic response to the local trauma induced by the implantation of the device. A non-invasive/non-destructive method for measuring adipose tissue pO2 would be a significant advance in the exploration of the hypoxia-driven insulin resistance hypothesis. To this end, the paramagnetic nature of molecular oxygen (O2) can, in principle, be exploited to directly quantify the O2 content of adipose tissue via simply measuring the longitudinal relaxation rate constant, R1, of lipid-associated resonances in adipose tissue. The motivation of the current work is to employ a porcine lard phantom platform as an adipose tissue surrogate for the development of a direct, non-invasive and quantitative measure of adipose tissue oxygenation and its primary confound, temperature, using MR. Such a technique which would provide critical insight into the pathogenesis of type 2 diabetes.Methods
Porcine lard phantom preparation: Phantoms were prepared in 8-mm NMR tubes by melting pure porcine lard at 45°C that was bubbled with N2/O2 gas mixtures to achieve different oxygen tension (pO2) levels. The samples were cooled to desired temperatures (34, 37 or 40°C) prior to MR scans and pO2 was monitored via LICOX® device. Proof-of-principle in-vivo MR: IR-PRESS (see below) data were collected in the white adipose of an anesthetized healthy C57Bl/6 mouse under temperature control (37-40°C) at discrete adipose pO2 levels (as determined by OxyLite probe). Adipose was modulated by varying breathing gas O2 content (balance N2) from 12.5% O2 to 100% O2. MR experiments: To obtain data for each pO2 and T, an in-house-developed Inversion Recovery Point RESolved Spectroscopy (IR-PRESS) sequence was employed at 4.7T: TR/TE=4500/13 ms, 64 exponential-spaced inversion times from 10 to 2000 ms, NS=1, DS=1. Inversion recovery data were analyzed and modeled as a three parameter mono-exponential recovery to a constant, using in-house-developed Bayesian probability theory-based software4. Model: In this work we will experimentally change pO2 and temperature (T) of porcine lard phantoms in order to quantify the relationship between pO2 and R1 (r1,pO2) and T and (r1,T), respectively. Once resolved, these coefficients can be used to convert the R1 of two lipid-associated resonances into non-invasive measures of pO2 and T according to Eq. 1: $$ R_{1,obs}=R_{1,ref,n}+r_{1,pO_{2},n}\cdot pO_{2}-r_{1,T,n}\cdot T $$ where R1,obs is the measured longitudinal relaxation rate constant of a given resonance, R1,ref is a constant at pO2=0 mmHg and T=37°C.Results
Porcine lard is an ideal in-vitro surrogate of adipose tissue; both porcine lard and white adipose of mice have similar chemical composition of triglycerides resulting in nearly identical NMR spectra (Figure 1). The expected linear relationships between R1,obs and pO2 and T are quantified (see Table 1). Further, the linear relationship between pO2 and R1 is characterized in-vivo (Figure 3) and the r1,pO2 and R1,ref are calculated to be 1.9x10⁻³ mmHg-1sec-1 and 2.11 sec-1, respectively, and are very close to those values obtained from the methylene peak of lard samples (peak 2, Table 1), indicating that lard is an ideal in-vitro candidate of adipose tissue.Discussion and Conclusion
A non-invasive and quantitative measure of adipose pO2 and its principle confound, temperature, is described. As anticipated (Eq. 1), we observed a positive linear relationship between the R1,obs and pO2 (R2>0.85, Figure 2A) and a negative linear relationship between R1,obs and temperature (R2>0.99, Figure 2B). A proof-of-principle in-vivo experiment on subcutaneous white adipose of a mouse shows very similar spectral features between white adipose and lard and a very similar r1,pO2 for the methylene peak, suggest that the principles learned from the lard phantom experiments will translate in-vivo. The phantom studies described herein will inform ongoing pre-clinical studies of metabolic disease pathways.Acknowledgements
We would like to thank our colleagues Drs. Joseph Ackerman and Joel Garbow for their invaluable scientific and professional guidanceReferences
1. Pajunen P, et al. Metabolically healthy and unhealthy obesity phenotypes in the general population: the FIN-D2D Survey. BMC Public Health. 2011;11:754. 2. Trayhurn P. Hypoxia and adipose tissue function and dysfunction in obesity. Physiol Rev. 2013;93(1):1-21. 3. Ye J. Emerging role of adipose tissue hypoxia in obesity and insulin resistance. Int J Obes. 2009;33(1): 54–66. 4. Marutyan KR and Bretthorst GL. The Bayesian Analysis Software developed at Washington University. Bayesian inference and maximum entropy methods in science and engineering. American Institute of Physics, Melville, NY, 2009, pp. 368-381.Figures
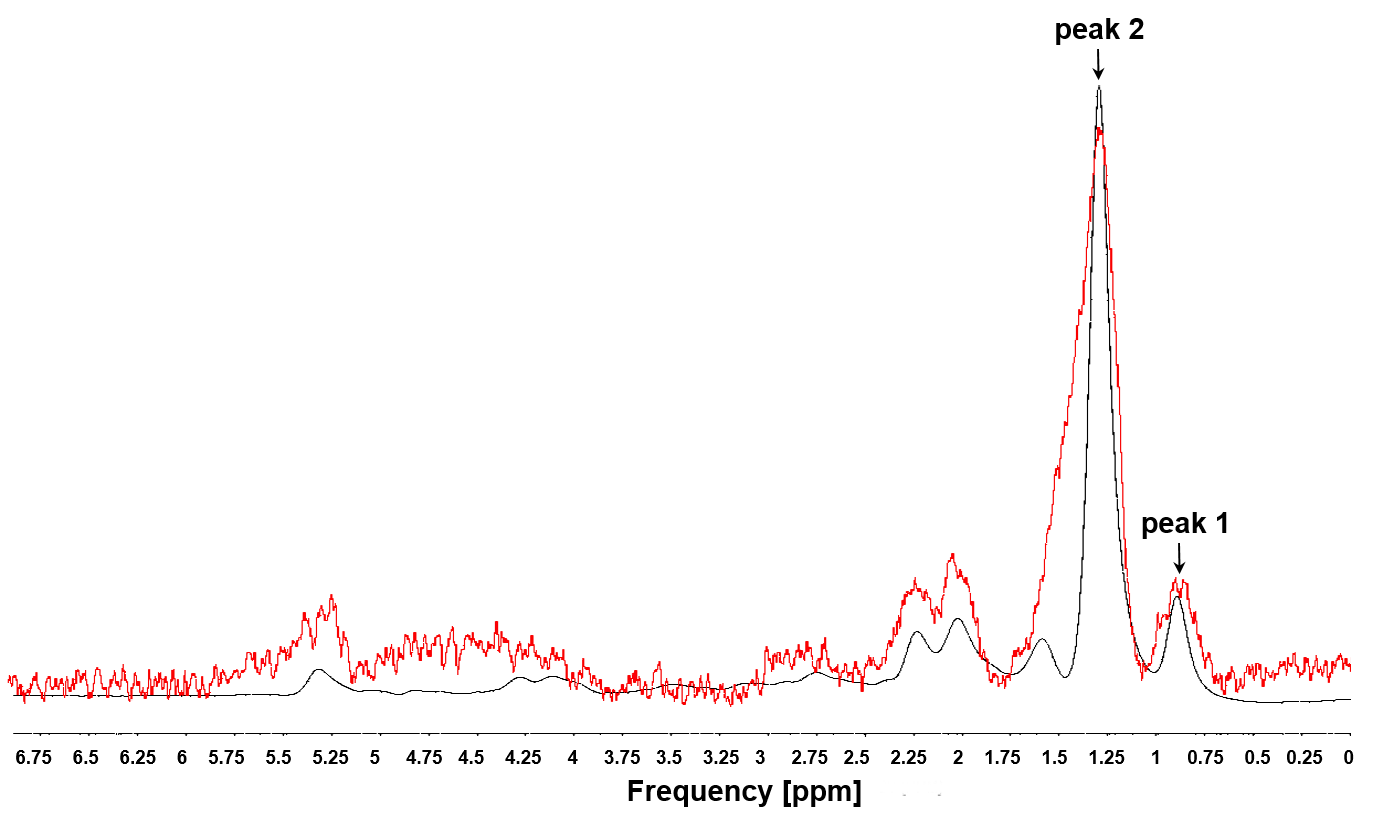
Figure 1: MR spectra of lard phantom (black) and in-vivo
adipose tissue from mice (red) obtained at 4.7T: peaks 1 and 2 represent
methyl and methylene peaks, respectively.
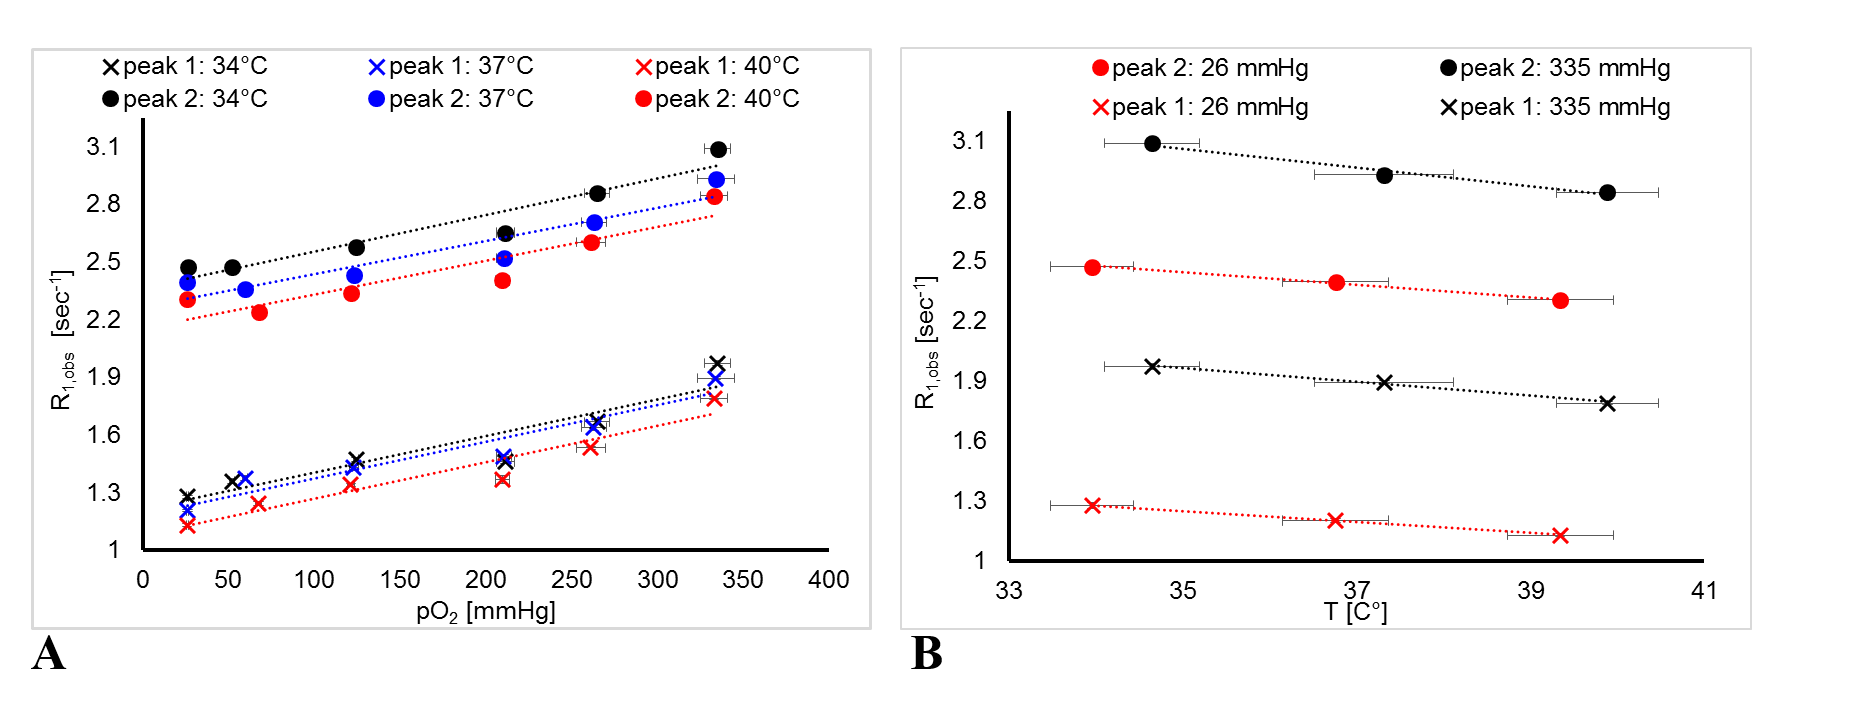
Figure 2: The R1,obs of multiple
lipid-associated resonances is sensitive to pO2 (A) and temperature (B). (A) Black, blue and red
colors represent data obtained under 34, 37 and 40°C,
respectively. (B) Black circles and red crosses represent data
obtained with pO2 of 26
and 335 mmHg, respectively. Crosses and circles represent data obtained for
peak 1 and 2, respectively.
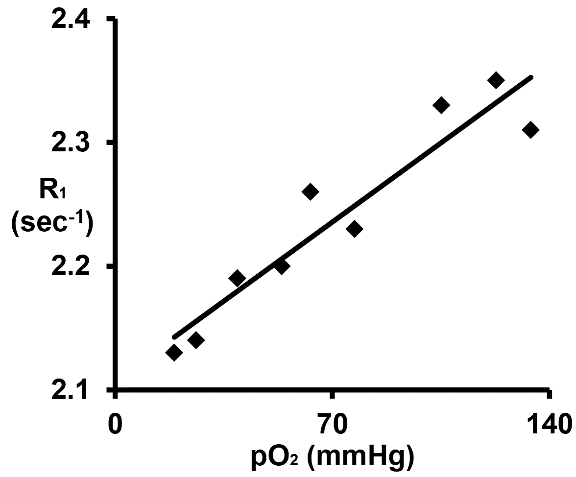
Figure 3: A linear relationship between in-vivo lipid R1,obs and adipose pO2.
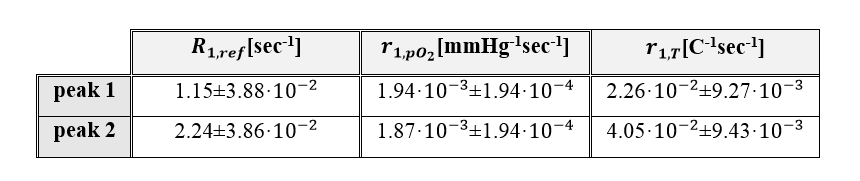
Table 1: A relationship between R1,obs and pO2 and T values obtained for two peaks at
4.7T.