1935
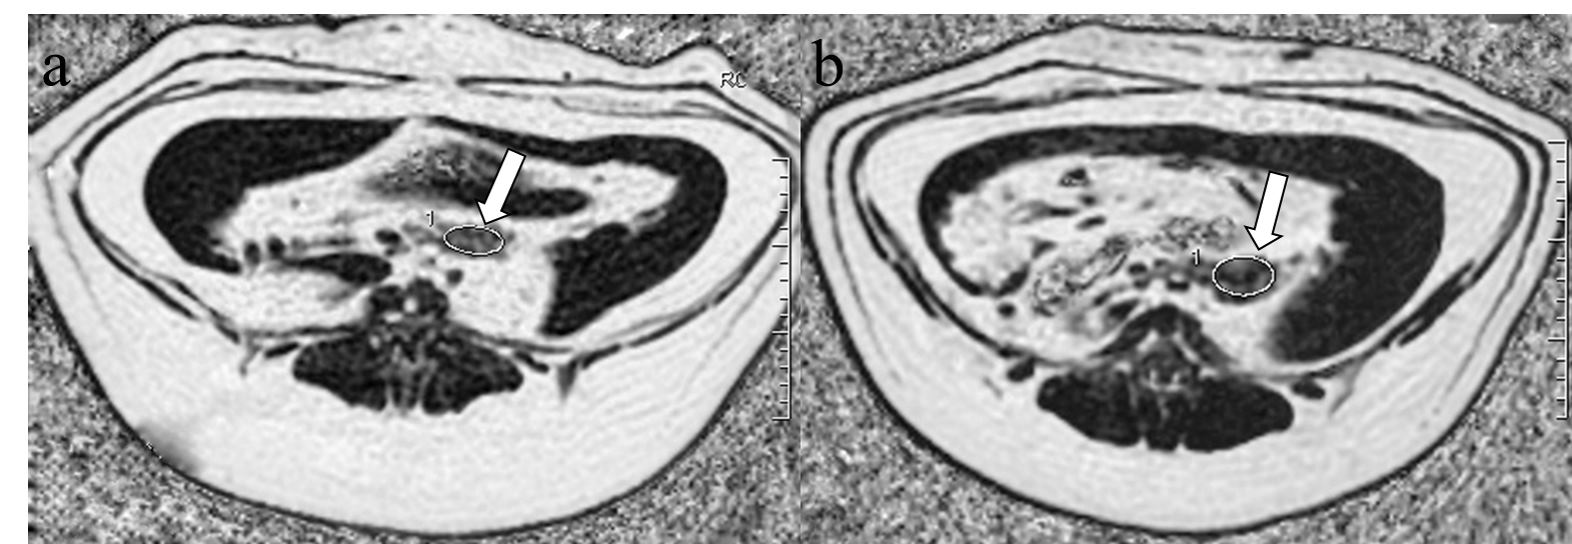
3.0T MRI with IDEAL-IQ sequence for Assessment of pancreatic fatty infiltration During Progression of T2DM Animal Model1Radiology Department, The First Affiliated Hospital of Guangxi Medical University, Nanning, China
Synopsis
This study was undertaken to determine the accuracy of pancreatic MR imaging by proton density fat fraction measurements with the iterative decomposition of water and fat with the echo asymmetry and least-squares estimation quantitation (IDEAL-IQ) sequences, and to explore changes of pancreatic fat content in a diabetic animal model. We found that estimation of pancreatic fat content by pulse sequence imaging is accurate and reproducible across readers. Further, greater pancreatic fat infiltration was observed in diabetic animals and it is related to the level of fasting blood glucose, which supports its use as a biomarker for diabetes risk.
Purpose
Recent studies have highlighted the correlation between diabetes and pancreatic fat infiltration [1,2], pancreatic fat content (PFC) is a potential biomarker in diabetic patients [3]. However, because of the difficulty of getting a pancreas biopsy [4,5], there were barely confirmed by pathological results[6,7], and the change of PFC during progression of type 2 diabetes mellitus (T2DM) as measured by non-invasive imaging is currently unknown. Here, we designed a prospective study where subjects at different stages of T2DM development. The first purpose of this study was to determine the feasibility and accuracy of pancreatic MRI by proton density fat fraction (PFF) measurements with IDEAL-IQ sequence, and the second objective was to explore the effect of pancreatic fatt content during the progression of type T2DM pigs.Methods
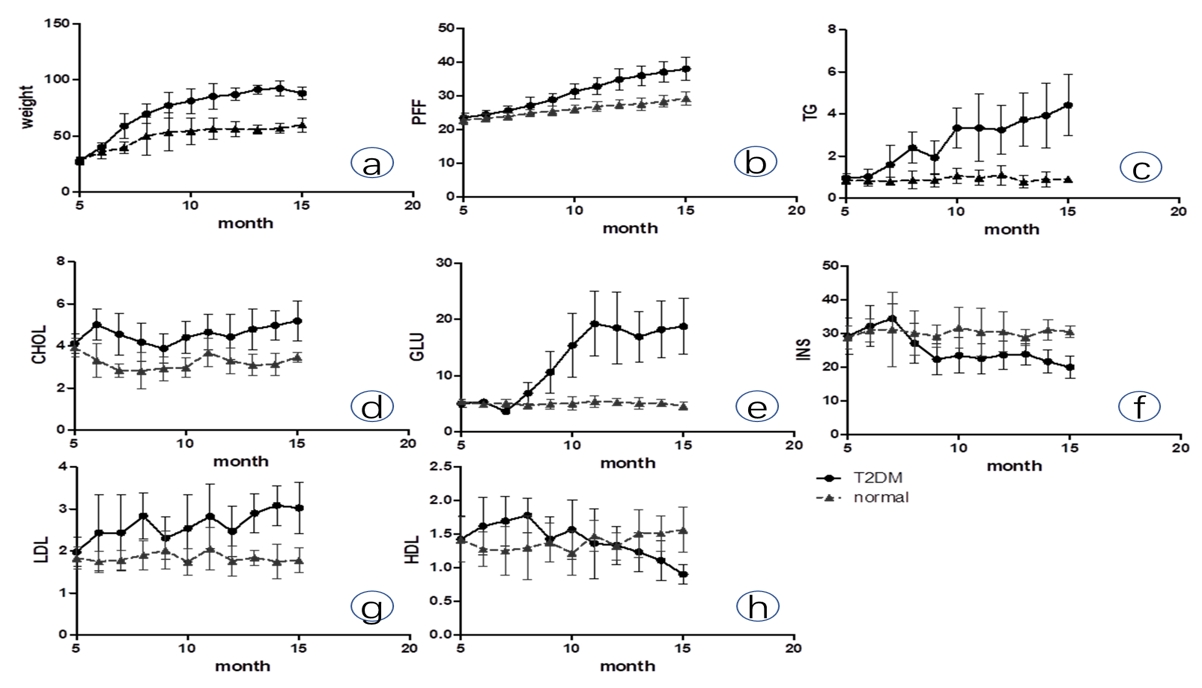
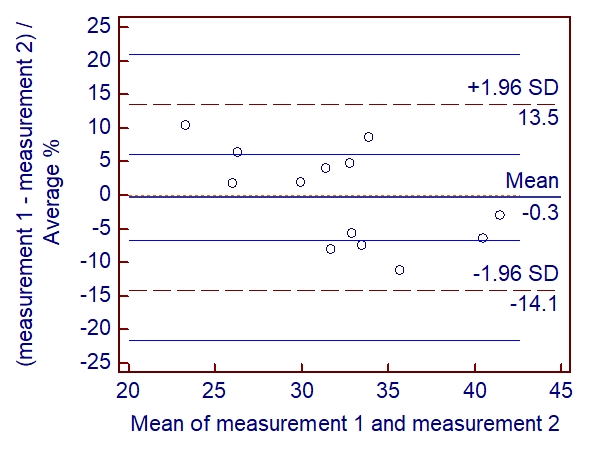
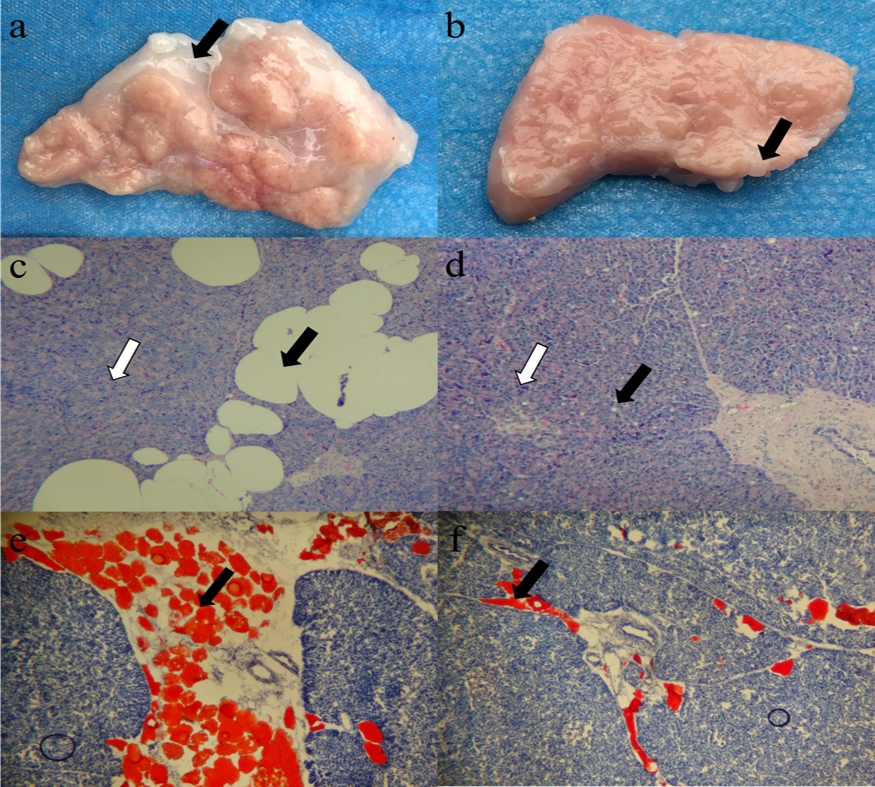
In this prospective study, 13 Bama Mini-pigs ( closed colony animals, 7 females, 6 males; median age, 2 weeks) were randomly assigned to diabetes (n=7) or control (n=6) groups. Starting in the fifth month, Pigs in the diabetic group received high fat/high sugar feed, combined with multiple low dose streptozotocin injections. At the end of fiteenth month, biochemical changes were evaluated by our clinical lab, all pigs underwent axial MR imaging with the IDEAL-IQ sequence to measurePFF, PFC of fresh pancreatic parenchyma was measured by the Soxhlet extraction method, pancreatic fat distribution was observed by histopathology, then compared them with Mann-Whitney U-test between the diabetes and control group. Correlations of PFF and PFC, fasting blood glucose (GLU) and serum insulin (INS) were calculated by Spearman correlation coefficient. Single-measure intraclass correlation coefficient (ICC) was used to assess interreader agreement.Results
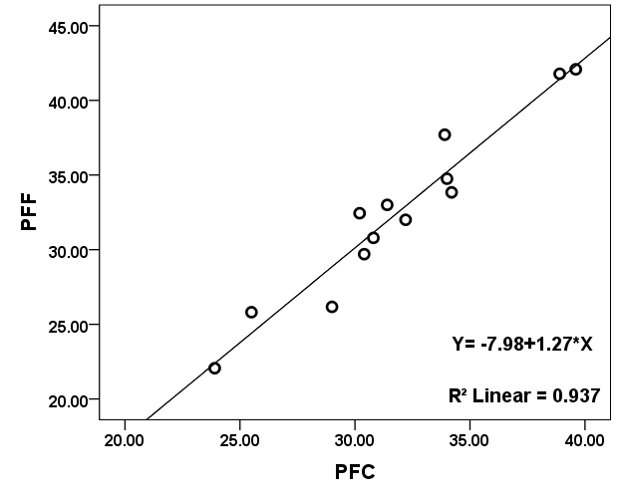
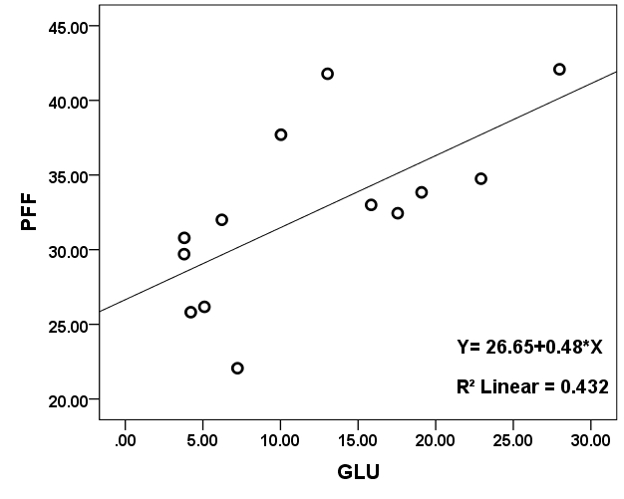
At the fifth month, the weight, PFF, GUL, INS, Triglyceride (TG), Total Cholesterol (TCHO), Low Density Lipoprotein (LDL) and High Density Lipoprotein (HDL), there were no significant difference between diabetes group and control group. As the feeding time was prolonged, compared with the control group, our data showed increased values of the Weight, PFF, PFC, GUL, TG, TCHO, LDL and Insulin resistance index (HOMA-IR);The islet beta cell function index (HOMA-β), Insulin action index (IAI), INS and HDL showed a trend of decrease in diabetes group. At the fifteenth month, there were significant differences between diabetes and control groups,Weight (kg) was 88.99±11.85 and 58.67±9.22 (P<0.001), GLU (mmol/L) was 18.06±6.03 and 5.06±1.41 (P = 0.003), INS (mU/L) was 21.59±2.93 and 29.32±3.27 (P = 0.003), PFC (%) was 34.60±3.52 and 28.63±3.25 (P = 0.027), PFF (%) was 36.51±4.07 and 27.75±3.73 (P = 0.003). There were highly positive correlations between PFF and PFC, Weight, TG, TCHO and LDL, the correlation coefficients were 0.928, 0.919, 0.824, 0.828, 0.824 (P < 0.001), respectively. The moderate positive correlations were founded between PFF and GLU, HOMA-IR, correlation coefficients were 0.659 (P=0.014), 0.611 (P=0.027), respectively. The moderate negative correlations were founded between PFF and HDL, INS, HOMA-β and IAI, the correlation coefficients were -0.594 (P=0.032), -6.17 (P=0.025), -0.607 (P=0.028), -0.603 (P=0.029), respectively.Conclusions
Pancreatic fat infiltration is ever-increasing during the progression of type T2DM pigs. And MRI with the IDEAL-IQ sequence can be used to monitor pancreatic fat fractions in diabetic pigs as a non-invasive method.Acknowledgements
We would like to thank Yu Xiaoping technologist in our laboratory, Miu Yongjian pathologist in our institution for their work performing measurements for this study. The work described in this paper was partially supported by grants from the National Natural Science Foundation of China (Project No.: 81860303) and Natural Science Foundation of Guangxi Province (Project No.: 2017GXNSFAA198324).References
1. Hollingsworth KG, Al-Mrabeh A, Steven S. Pancreatic triacylglycerol distribution in type 2 diabetes. Diabetologia 58 (11) (2015) 2676-2678.
2. Zhou J, Li ML, Zhang DD, et al. The correlation between pancreatic steatosis and metabolic syndrome in a Chinese population. Pancreatology 16 (4) (2016) 578-583.
3. Gerst F, Wagner R, Kaiser G, et al. Metabolic crosstalk between fatty pancreas and fatty liver: effects on local inflammation and insulin secretion. Diabetologia 60 (11) (2017) 2240-2251.
4. Kusmartseva I, Beery M, Philips T, et al. Hospital time prior to death and pancreas histopathology: implications for future studies. Diabetologia 68 (8) (2017) 308-312.
5.Solimena M, Schulte AM, Marselli L, et al. Systems biology of the IMIDIA biobank from organ donors and pancreatectomised patients defines a novel transcriptomic signature of islets from individuals with type 2 diabetes. Diabetologia (Suppl 4) (2017) 1-17.
6. Kühn JP, Berthold F, Mayerle J, et al. Pancreatic Steatosis Demonstrated at MR Imaging in the General Population: Clinical Relevance. Radiology 276 (1) (2015) 129-136.
7. Heber SD, Hetterich H, Lorbeer R, et al. Pancreatic fat content by magnetic resonance imaging in subjects with prediabetes, diabetes, and controls from a general population without cardiovascular disease. PLoS One 12 (5) (2017) e0177154.
Figures