1932
Quantitative assessment of body composition parameters with CS accelerated Dixon method1Global MR Engineering, GE Healthcare, Waukesha, WI, United States, 2AMRA Medical AB, Linköping, Sweden, 3Global MR Applications & Workflow, GE Healthcare, Madison, WI, United States, 4Global MR Applications & Workflow, GE Healthcare, Houston, TX, United States, 5Department of Biomedical Engineering, Linköping University, Linköping, Sweden
Synopsis
MRI provides accurate and high-precision body composition measurements. Routinely, data acquisition is performed using system’s integrated body coil, which creates a challenge in terms of scan time and breath-hold duration. This work utilized Compressed Sensing with 2pt Dixon to reduce the acquisition time by 40% without impacting the quantitation of body composition measurements. Variations were found to be small compared to test-retest precision. This provides an opportunity to add MRI based body composition analysis to most MRI examinations with minimal scan time impact without a change in coil or patient setup
Introduction
MR-based automated body composition profiling has been demonstrated to provide excellent reproducibility and excellent correlation to manual segmentation1. While using the system’s integrated body coil help with the patient setup and comfort by eliminating the setup and use of multiple surface coils, this creates a challenge in terms of scan time and breath-hold duration in particular for chest and abdomen stations. This work investigates the feasibility of a compressed sensing (CS)2-enabled bipolar readout Dixon technique using the scanner’s internal quadrature body coil with maintained quantitative properties.Methods
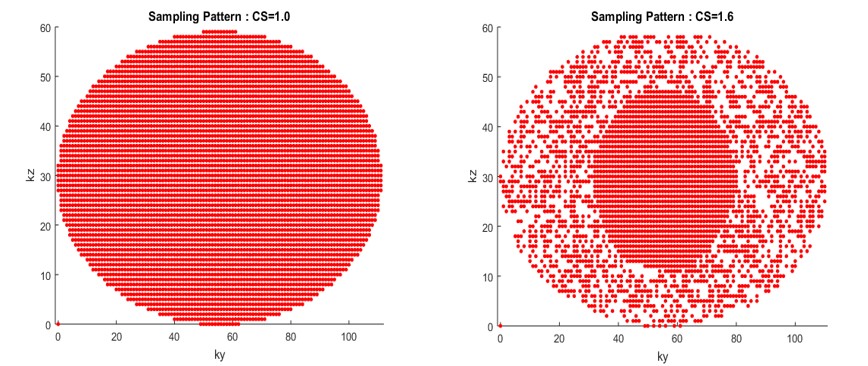
Pulse Sequence: As shown in Figure 1, a bipolar two-point Dixon fat-water separation (LAVA Flex)3 technique was combined with compressed sensing to reduce the scan time or increase resolution.
Data Acquisition: All experiments were performed on a GE 3.0T MR750w imaging system (Waukesha, WI). Compressed sensing-enabled LAVA Flex scans were performed on a heathy volunteer. Neck to knees was covered with 3 abdominal breath-hold (BH) station and 3 pelvis-thigh stations. 3D data were acquired in the axial orientation with imaging parameters: TR = 3.6 ms (BH) or 3.9 ms (non-BH), TE1/TE2 = 1.1/2.2ms (BH) or 1.1/2.3ms (non-BH), FOV = 50 x 40 cm, matrix = 196×140 (BH) or 256x226(high-resolution BH) or 256×226 (non-BH), slice thickness = 5.0 mm(BH) or 4.0 mm (non-BH), 60(BH) slices or 80 slices (non-BH), receiver bandwidth = ±142.9 kHz. Compressed sensing with acceleration factors = 1.0, 1.4 and 1.6 was also applied for scan time reduction. Approximate breath-hold times were 14 s (CS = 1.0), 11 s (CS = 1.4), 9 s (CS = 1.6) and 16 s (CS = 1.6, Hi Res).
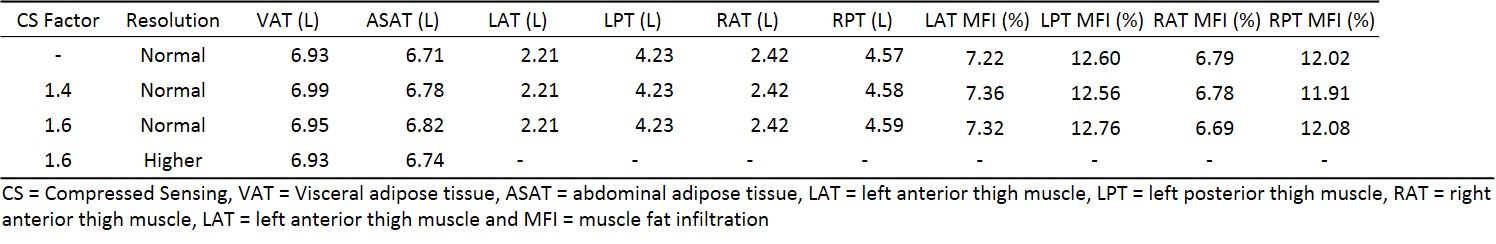
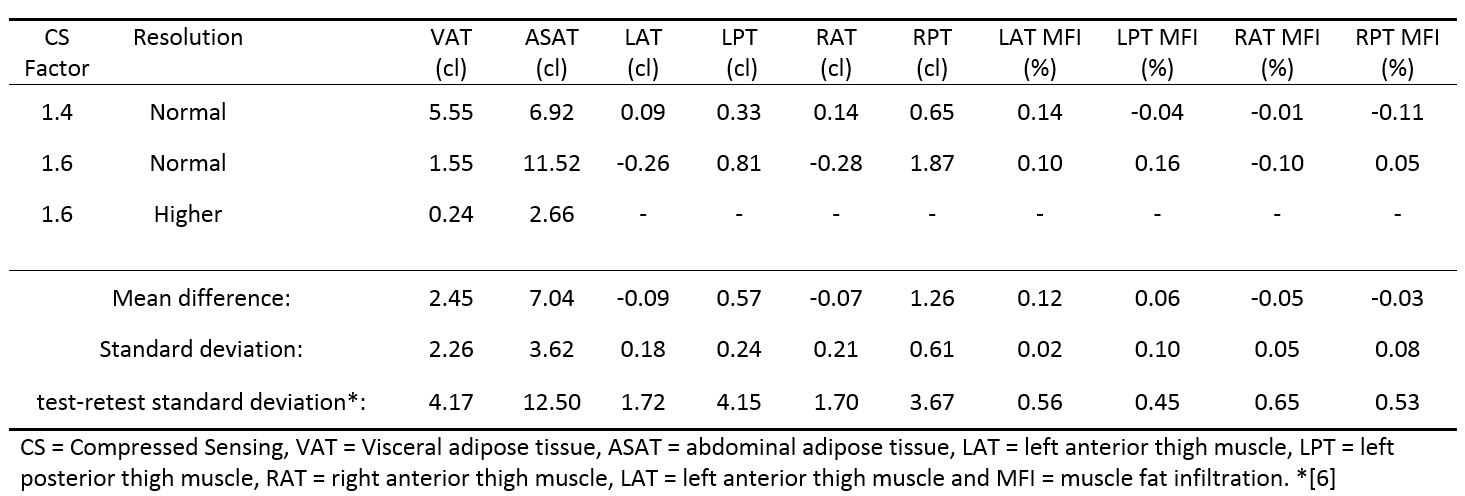
Data Analysis: The body composition was measured using AMRAÒ Researcher (AMRA Medical AB, Linköping, Sweden), which uses multi-atlas registration4 and quantitative adipose tissue (AT) concentration maps5 to measure AT volumes, muscle volumes and muscle fat infiltration (MFI). AT volumes and MFI are directly derived from the maps, and muscle tissue is defined as segmented voxels with less than 50 % AT. Visceral AT volume (VAT) and subcutaneous AT volume (ASAT) were measured for all datasets. When relevant, the right/left anterior thigh (RAT/LAT), right/left posterior thigh (RPT/LPT) volumes and MFI were measured. Acceleration based measurements were compared to non-accelerated measurements, and the standard deviation of the differences were compared to published test-retest precision6.
Results
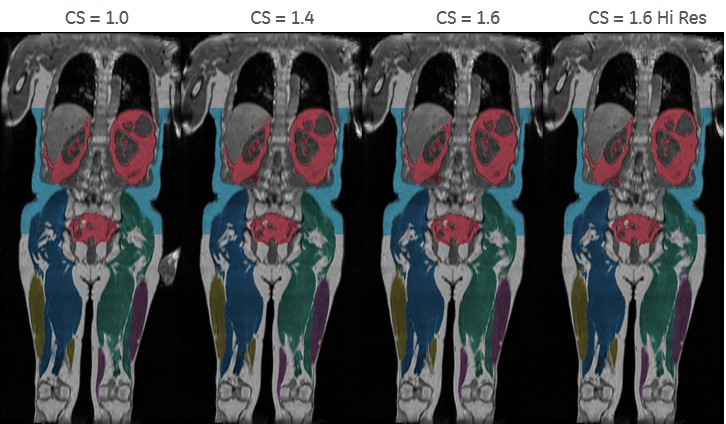
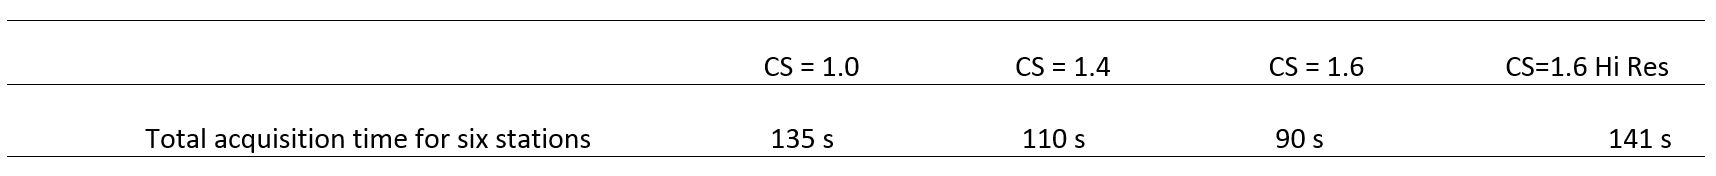
Table 1 lists scan time for different CS acceleration factors. Figure 2 shows segmented and color overlay images of coronal reformations capturing muscle, visceral and subcutaneous fat amount. Refer to tables 2 and 3 for body composition measurements, differences relative to non-accelerated scans and the comparative precision.Discussion
The body composition analysis examined several compartments which are sensitive to the quality of the water-fat images, as the AT concentration maps are generated from the fat image. In no compartment examined was there any detectable effect that can be attributed to CS as there was no pattern in which an increased CS acceleration factor lead to a consistent and proportional over/under estimation across AT volumes and MFI measurements. Furthermore, the variation introduced by altering the CS was small compared to the test-retest precision of the method.Conclusion
Compressed sensing preserved the quantitative properties of the fat-water images that were used for body composition measurement. This allows significant scan time reduction without noticeable effect on measurements of VAT, ASAT, thigh muscle volumes or MFI which opens up for MRI-based body composition analysis being added onto most MRI examinations at a close to negligible added cost and patient discomfort. Alternatively, this accelerated scan time allows for increased resolution which enables assessment of muscle volume and fat infiltration in small individual muscles without prolonged scan time.Acknowledgements
No acknowledgement found.References
1. Thomas, M.S., Newman, D., Leinhard, O.D. et al. Eur Radiol (2014) 24: 2279.
2. Lustig et al, IEEE Signal Processing Magazine 2008
3. Ma J. Breath-hold water and fat imaging using a dual-echo two-point Dixon technique with an efficient and robust phase-correction algorithm. Magn Reson Med. 2004; 52:415–419.
4. Karlsson, A., et al., Automatic and quantitative assessment of regional muscle volume by multi-atlas segmentation using whole-body water-fat MRI. J Magn Reson Imaging, 2015. 41(6): p. 1558-69.
5. Leinhard, O.D., et al., Quantitative abdominal fat estimation using MRI.
6. West, J., et al., Precision of MRI-based body composition measurements of postmenopausal women. PLoS One, 2018. 13(2): p. e0192495.
Figures