1928
Metabolic Imaging of Brown Adipose Tissue in Aging Rodent Model1Laboratory of Molecular Imaging, Singapore Bioimaging Consortium, Singapore, Singapore, 2Singapore Institute for Clinical Sciences, Singapore, Singapore, 3Department of Physiology, National University of Singaore, Singapore, Singapore
Synopsis
Loss of BAT function and activity is associated with aging. Understanding the metabolic and phenotypic changes in aging brown adipose tissue is important for healthy aging. In this study, we have characterized various brown adipose tissue depots including interscapular BAT(iBAT), cervical BAT(cBAT), and axillary BAT(aBAT) ) in aging rodent model. Fat content in all BAT depots increased with aging and reduced with β3 agonist treatment. The iBAT was more responsive to β3 intervention compared to other BAT depots. Functional genes PRDM16, PPARg, PGC1α were upregulated in BAT tissues of 3 months old animals with β3 agonist due to high metabolic activity and improved quality of BAT compared to older animals.
Introduction
Aging process is associated with metabolic changes and remodeling of adipose tissues. Brown adipose tissue (BAT) plays an important role in energy expenditure and is a potential therapeutic target for obesity, diabetes, and other metabolic diseases. Loss of BAT function and activity is associated with aging adipose tissues1. Understanding the metabolic and phenotypic changes in aging brown adipose tissue is important for healthy aging. In this study we have characterized various brown adipose tissue depots including iBAT, cBAT and aBAT in aging rodent model.Methods
Male Wister rats (n=12) were maintained on chow diet and randomized into two cohorts. Cohort 1 (3 months) and cohort 2 (18 months) were subjected to imaging. These groups were further divided into additional sub-groups, Group A –treated with saline and Group B-treated with β3 agonist (1mg/Kg, B.W) for 14 days. MR imaging was performed using a 3T Siemens Skyra Scanner with a transmit/ receive 1H/31P dual tuned coil (Siemens Healthcare, Germany). Anatomical imaging was performed by high resolution gradient-echo 3D T1 weighted imaging with TR of 6.2 ms; TE of 2.46 ms; FOV with 126 ×192 mm2; matrix size 252 × 384; 128 slices with 0.5 mm thickness. 3D multi-echo (6 echoes) volume-interpolated breath-hold examination (VIBE) Dixon sequence was utilized for water and fat images with repetition time ~TR 11 ms, TE’s (1.10, 2.63, 4.1, 5.57, 7.04 and 8.51ms); flip angle 40, field of view, 126 × 192 mm2; matrix size 126 × 192; 128 slices with 1 mm thickness. The multi-echo complex data were fit using Levenberg-Marquardt non-linear fitting using the seven-peak fat model2,3. Based on anatomical structures of various fat depots manual segmentation was performed in multiple slices of co-registered high resolution T1 weighted and FF maps using ITK-SNAP4. After terminal in vivo experiments, total RNA isolated from the brown fat tissues using RNeasy Lipid Tissue Mini Kit. Real-time qPCR, cDNA samples were analyzed in duplicate using the SYBR Green PCR Master Mix reagent kit. Relative mRNA expression of UCP1, CPT1, PRDM16, PPARG, PGC1α levels were calculated and normalized to 36B4 which is used as an endogenous control gene. Haematoxylin (H) and eosin (E) staining was performed on 5µm tissue section for all the BAT depots.
Results and Discussion
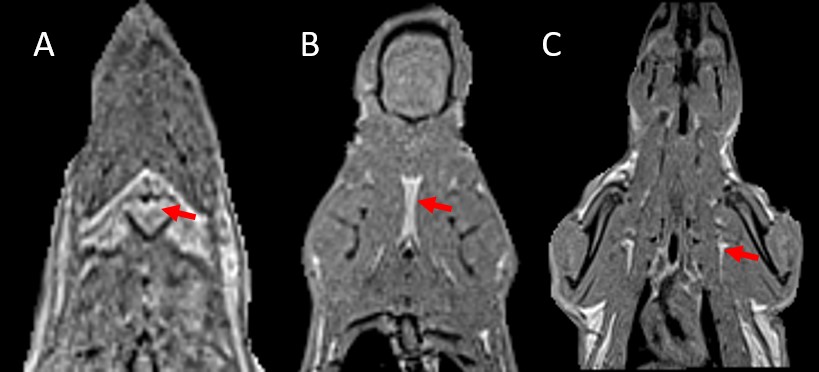
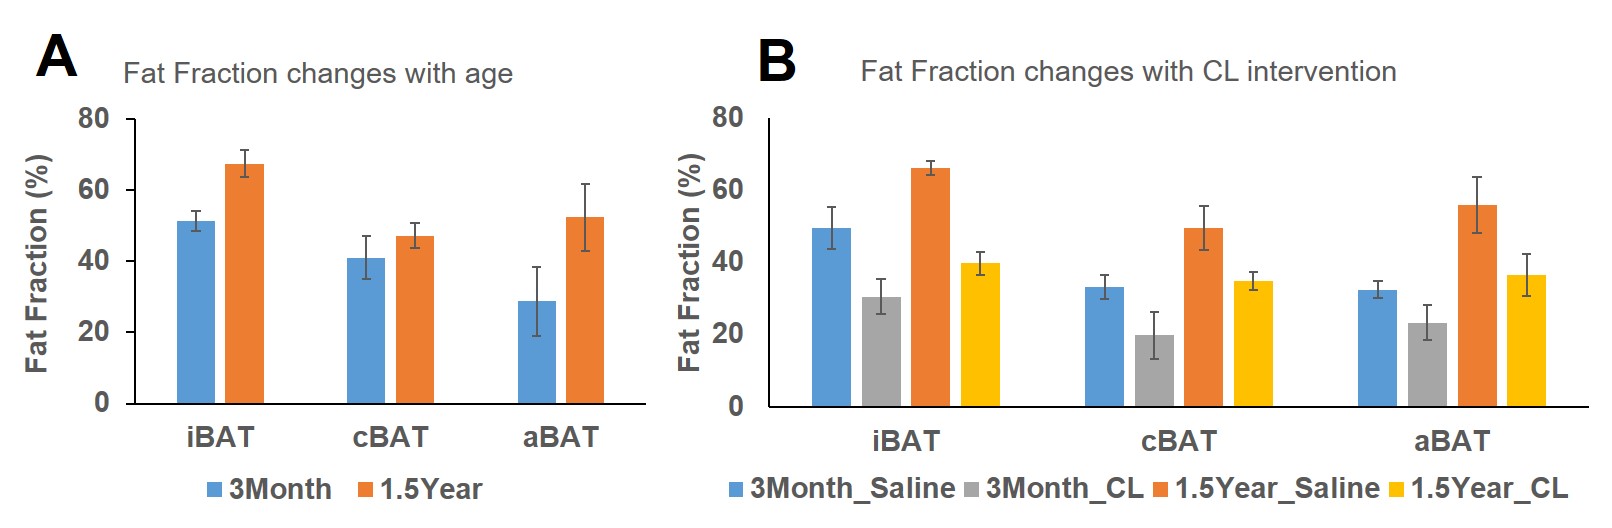
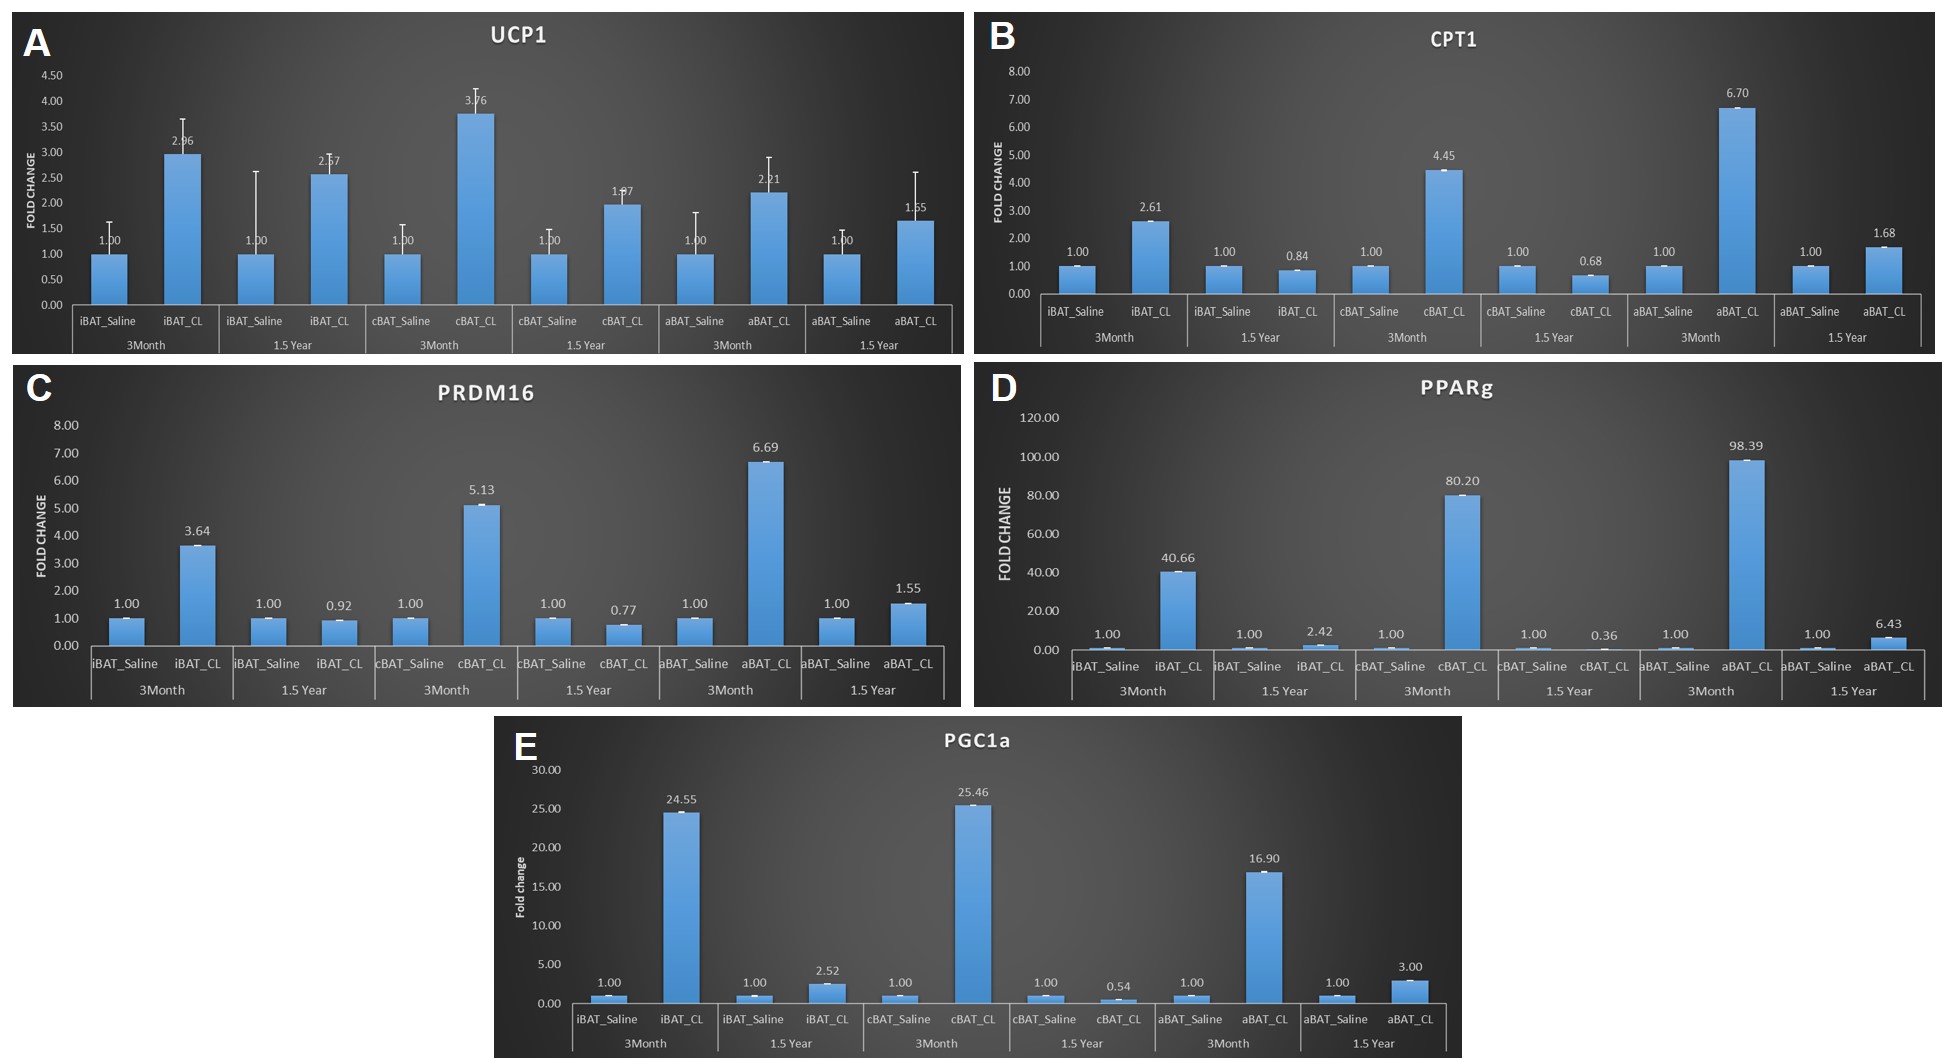
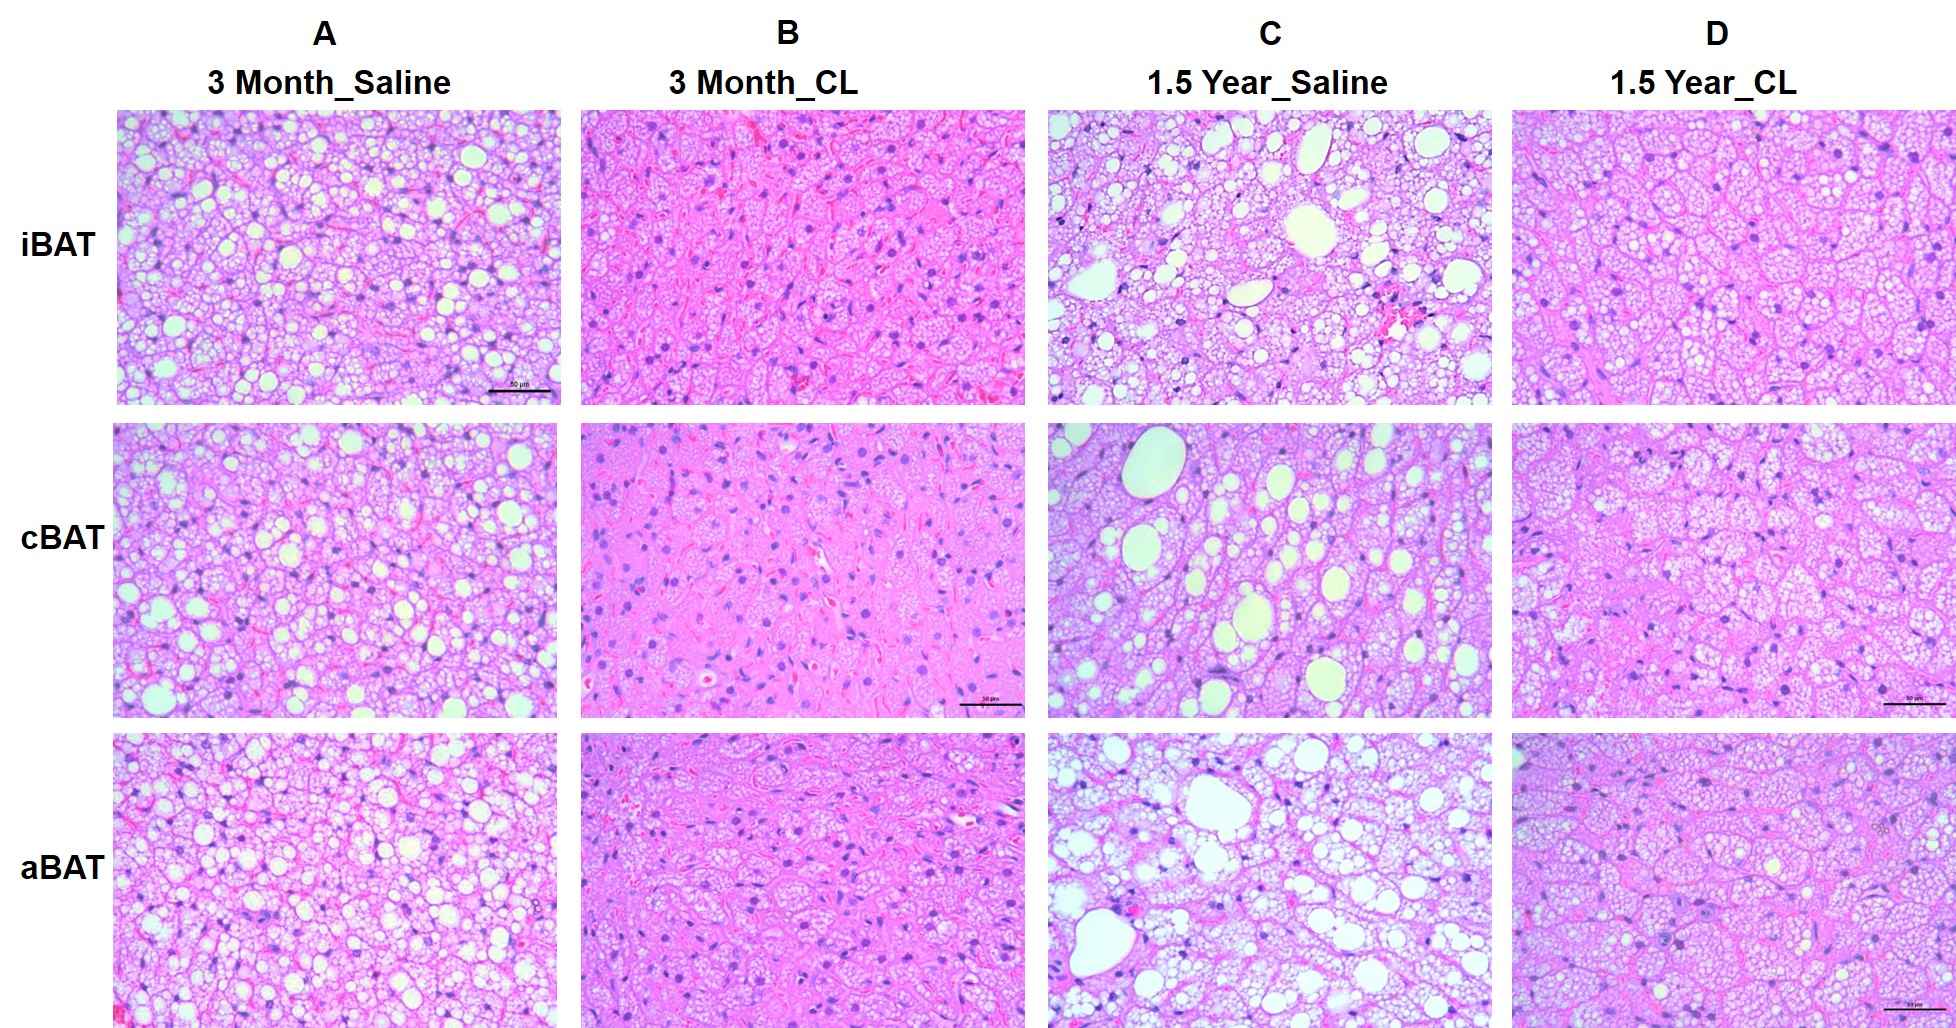
We have characterized the iBAT, cBAT, and aBAT) using 3D imaging. BAT depots including iBAT, cBAT and aBAT are shown in Figures 1A-C. Figure 2A shows the increased FF in the BAT depots of 18-month old group compared to 3 months old group. Increase of FF in iBAT and aBAT was more prominent with aging compared to cBAT. Figure 2B shows the FF from BAT depots of saline and β3 agonist treated animals at 3 and 18 months of age. In both age groups, the FF reduced with β3 agonist treatment. The iBAT was more responsive to β3 agonist treatment in both age groups. mRNA analysis of targeted genes and histology was performed in all BAT tissues. Figures 3A-E show the mRNA analysis of UCP1, CPT1, PRDM16, PPARg and PGC1α genes from all BAT depots obtained from saline and β3 agonist treated groups. Higher UCP1 and CPT1 expression in β3 agonist groups show increased thermogenesis and lipid oxidation. Increased expression of functional genes PRDM16, PPARg and PGC1α in β3 agonist treated animals at 3 months show improved BAT function. On other hand, 18 months old animals did not show response to β3 agonist indicating that BAT quality and function has been compromised with age. Figures 4A-D show the H & E stained BAT sections from saline and β3 agonist treated animals. Increase in large lipid droplets in all BAT depots is seen in 18 month old group. These large lipid droplets reduced with β3 agonist treatment in both age groups.Conclusions
We have characterized the iBAT, cBAT, aBAT in young and old rats using 3D imaging techniques. Fat content in all BAT depots increased in 18 months old rats compared to 3 months group. The fat fraction reduced in all three BAT depots with β3 agonist treatment for both groups. The iBAT was more responsive to β3 intervention compared to other BAT depots. UCP1 and CPT1 genes were upregulated in β3 agonist treated animals due to increased thermogenesis and lipid oxidation. Functional genes including PRDM16, PPARg, PGC1α were up-regulated in β3 agonist treated animals at 3 months of age, whereas the 18 month old animals did not show response of functional genes to the intervention indicating that quality and function of all the BAT depots has been compromised with age.Acknowledgements
No acknowledgement found.References
1. Graja A, Schulz TJ et al Mechanisms of aging-related impairment of brown adipocyte development and function. Gerontology. 2015;61(3):211-7.
2. Hu HH. et al. Characterization of human brown adipose tissue by chemical-shift water-fat MRI. AJR Am J of Roentgenol 2013;200:177.
3. Ren J, et al. Composition of adipose tissue and marrow fat in humans by 1H NMR at 7 Tesla. J Lipid Res 2008;49:2055-2062.
4. Paul A. Yushkevich, Joseph Piven, Heather Cody Hazlett, Rachel Gimpel Smith, Sean Ho, James C. Gee, and Guido Gerig. User-guided 3D active contour segmentation of anatomical structures: Significantly improved efficiency and reliability. Neuroimage 2006 Jul 1;31(3):1116-28.
Figures