1926
Accumulation of saturated IMCL is associated with insulin resistance1Metabolic Research Laboratories, Wellcome Trust-MRC Institute of Metabolic Science, Cambridge, United Kingdom, 2National Institute for Health Research/Wellcome Trust Clinical Research Facility, Cambridge University Hospitals NHS Foundation Trust, Cambridge, United Kingdom, 3MRC Epidemiology Unit, University of Cambridge, Cambridge, United Kingdom, 4Oxford Centre for Diabetes, Endocrinology and Metabolism (OCDEM), University of Oxford, Oxford, United Kingdom, 5Department of Clinical Research and Radiology, AMSM, University Bern, Bern, Switzerland, 6Department of Musculoskeletal Biology, University of Liverpool, and MRC–Arthritis Research UK Centre for Integrated research into Musculoskeletal Ageing (CIMA), Liverpool, United Kingdom, 7Wolfson Brain Imaging Centre, University of Cambridge, Cambridge, United Kingdom
Synopsis
Use of a recently validated 1H MRS approach to determine both the intramyocellular lipid composition, and concentration independent of composition, within the soleus and tibialis anterior muscles of female individuals covering a wide range of insulin sensitivities, has revealed that accumulation of saturated intramyocellular lipid is more strongly associated with whole-body insulin resistance than concentration alone.
Introduction
Paradoxically, intramyocellular lipid (IMCL) accumulation has been linked to both insulin-resistant and to insulin-sensitive (athletes) states. As recent studies have implicated saturated fat in the pathogenesis of insulin resistance 1,2 we sought to investigate the compositional saturation index of IMCL using a newly validated 1H MRS marker 3 in controls, insulin resistant lipodystrophic patients and insulin sensitive athletes.
Methods
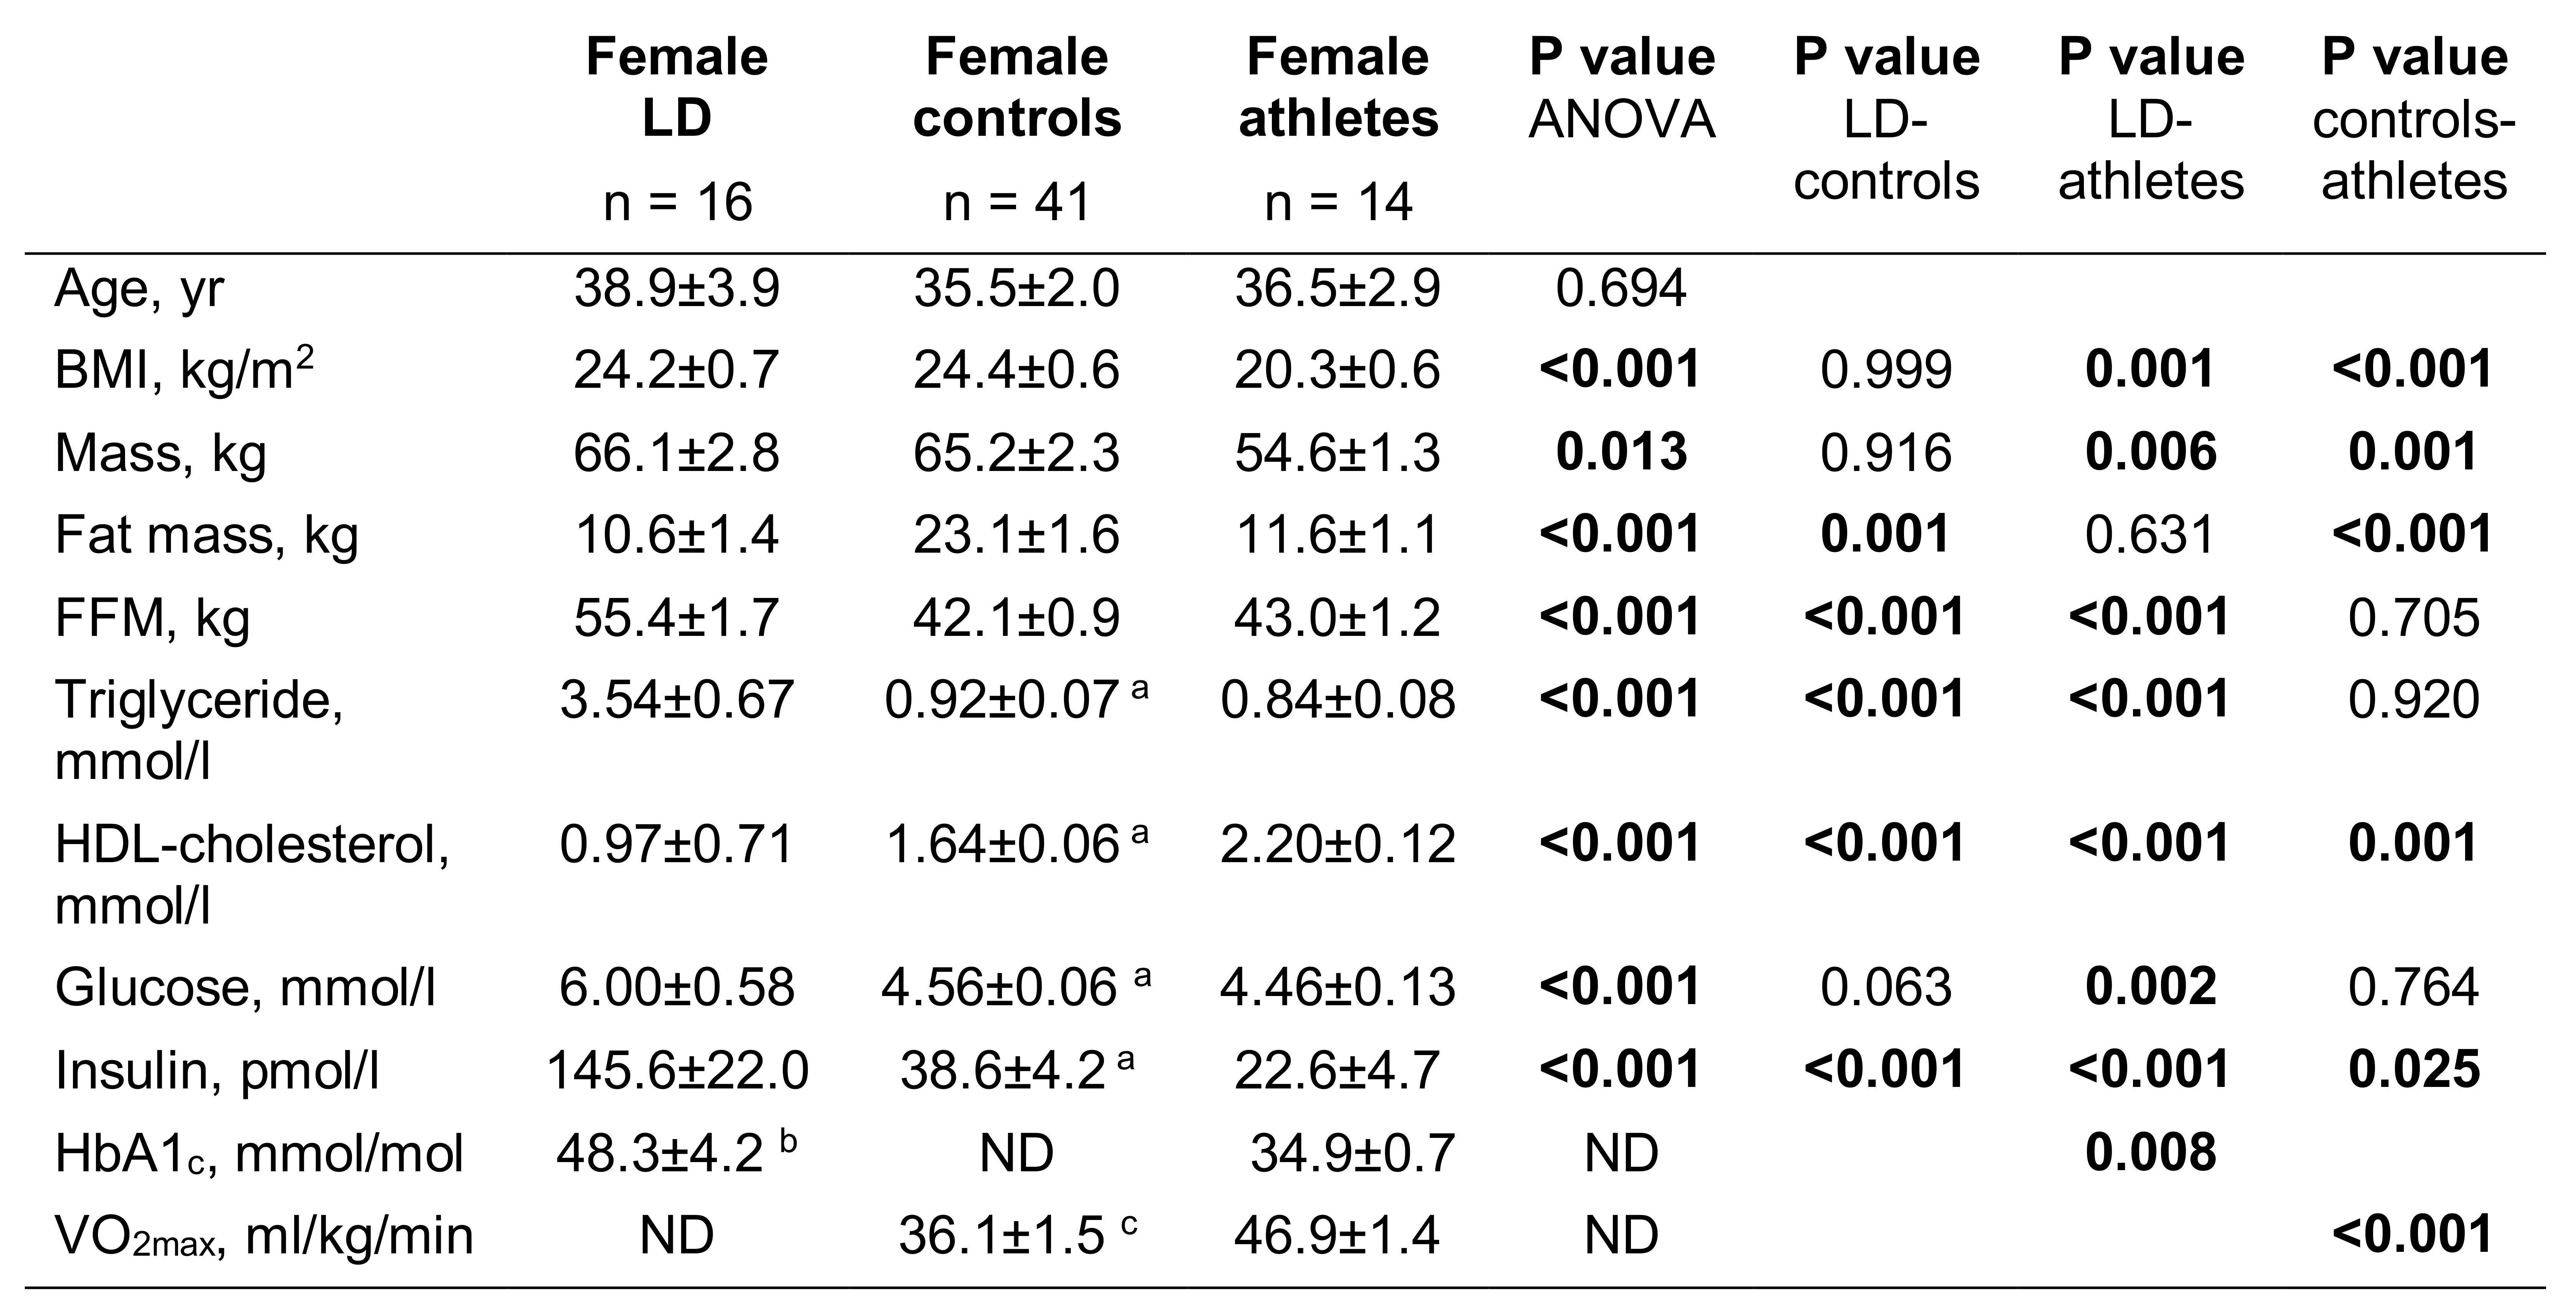
In 16 female patients with lipodystrophy, and age- and gender-matched controls (n=41) and athletes (n=14), we measured the compositional saturation index (CH2:CH3 ratio) and concentration independent of composition (CH3) of IMCL in the soleus (SOL) and tibialis anterior (TA) muscles. Control and athlete exclusion criteria included smoking, drug or alcohol addiction, any current or past medical disorder or medications that could affect measurements including supplements, and standard MR contraindications. Volunteers abstained from vigorous exercise for 19hrs (controls) and 24hrs (athletes) prior to measures.
1H MRS.
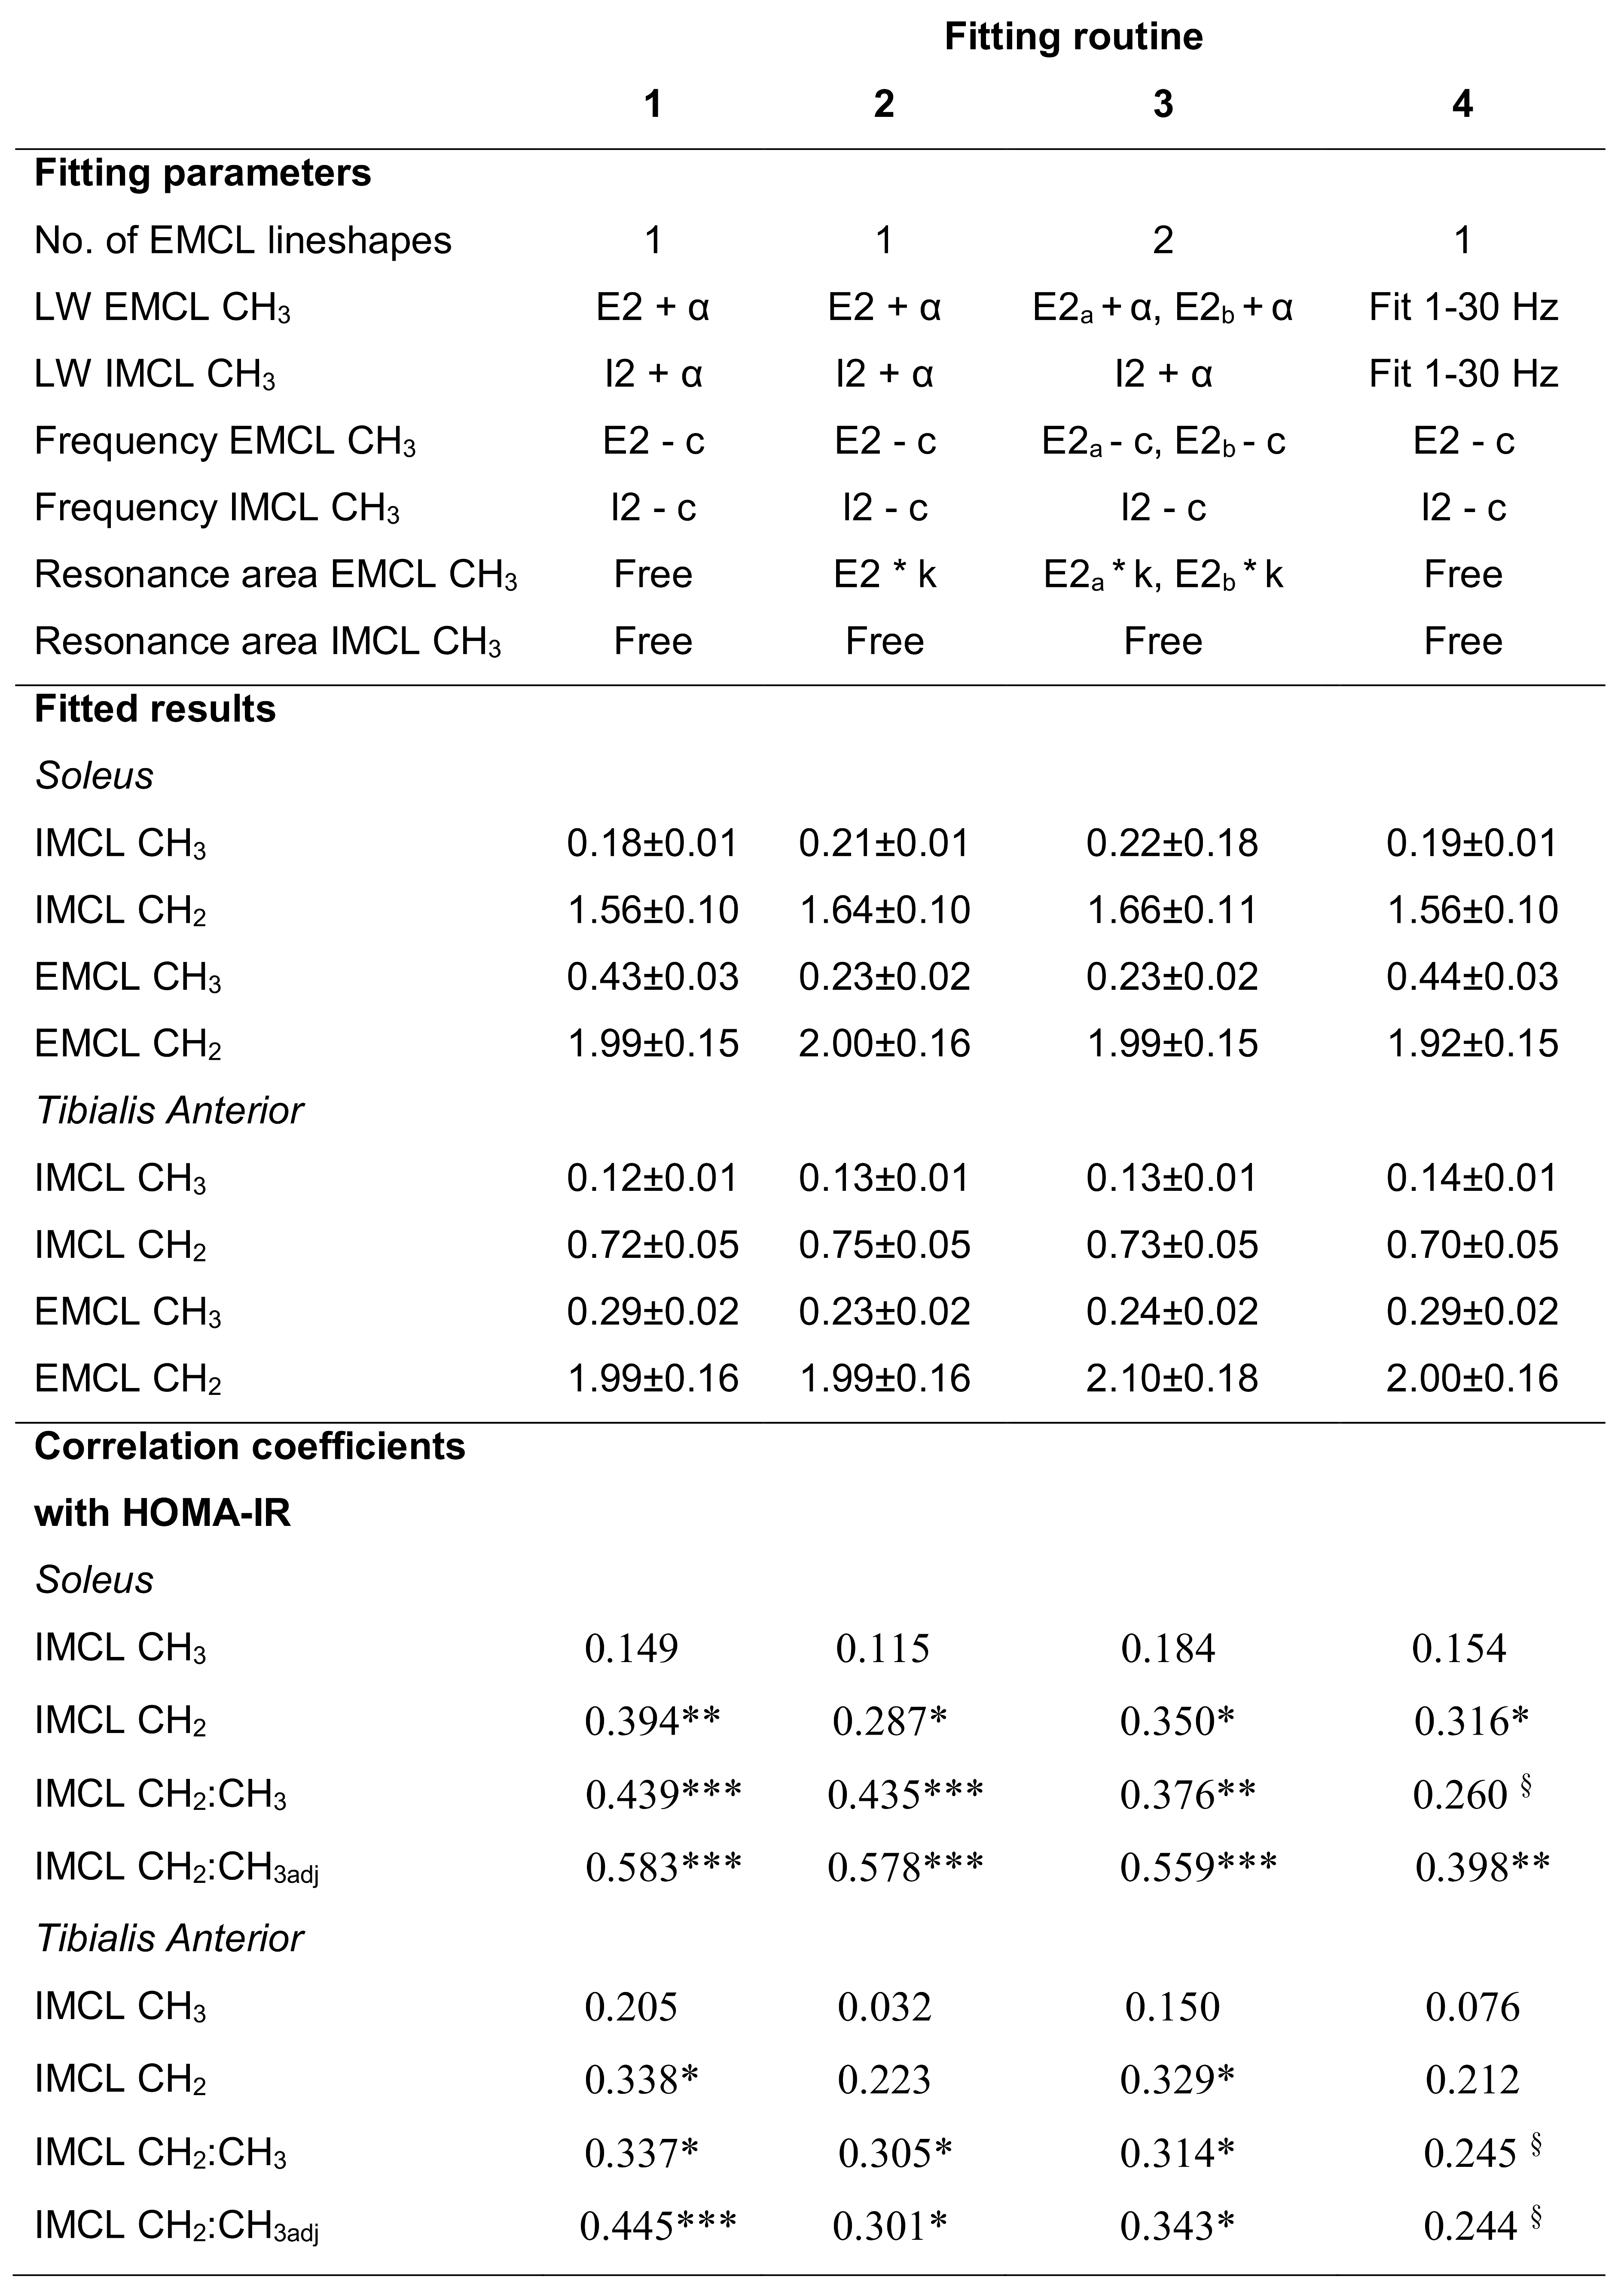
Studies were performed on a Siemens 3T scanner using PRESS with short echo time of 35 ms. Acquisition was as previously described 3. Data were analysed in jMRUI 4,5 and fitted with the AMARES 6 algorithm using identical prior knowledge parameters 3. As the CH3 resonance is small and may be subject to spectral overlap, the results were later checked for robustness by reanalysing the data using different fitting parameters (Fig.5 upper). IMCL CH2 and CH3 were quantified relative to creatine and then the calculated water signal (water-calc). Absolute composition-independent IMCL concentrations in mmol/kg muscle wet weight were calculated from the compositionally invariant CH3 IMCL resonance, with standard assumptions regarding muscle water content, and correction for T2 relaxation effects, J coupling and proton density. The IMCL saturation index (CH2:CH3) was calculated as IMCL CH2/CH3, and the IMCL saturation index adjusted for quantity (CH2:CH3adj) = CH2 – (mCH3 + c), where m and c are the gradient and intercept of the regression line through the control data points of CH2 vs CH3.
VO2max
24 controls underwent continuous incremental exercise testing to 85% age-predicted maximum heart rate, and all athletes to volitional exhaustion, on a treadmill. In controls VO2max was calculated by extrapolating the submaximal heart rate–VO2 relationship to age-predicted maximum heart rate 7.
Statistics were performed in IBM SPSS Statistics 24.
Results
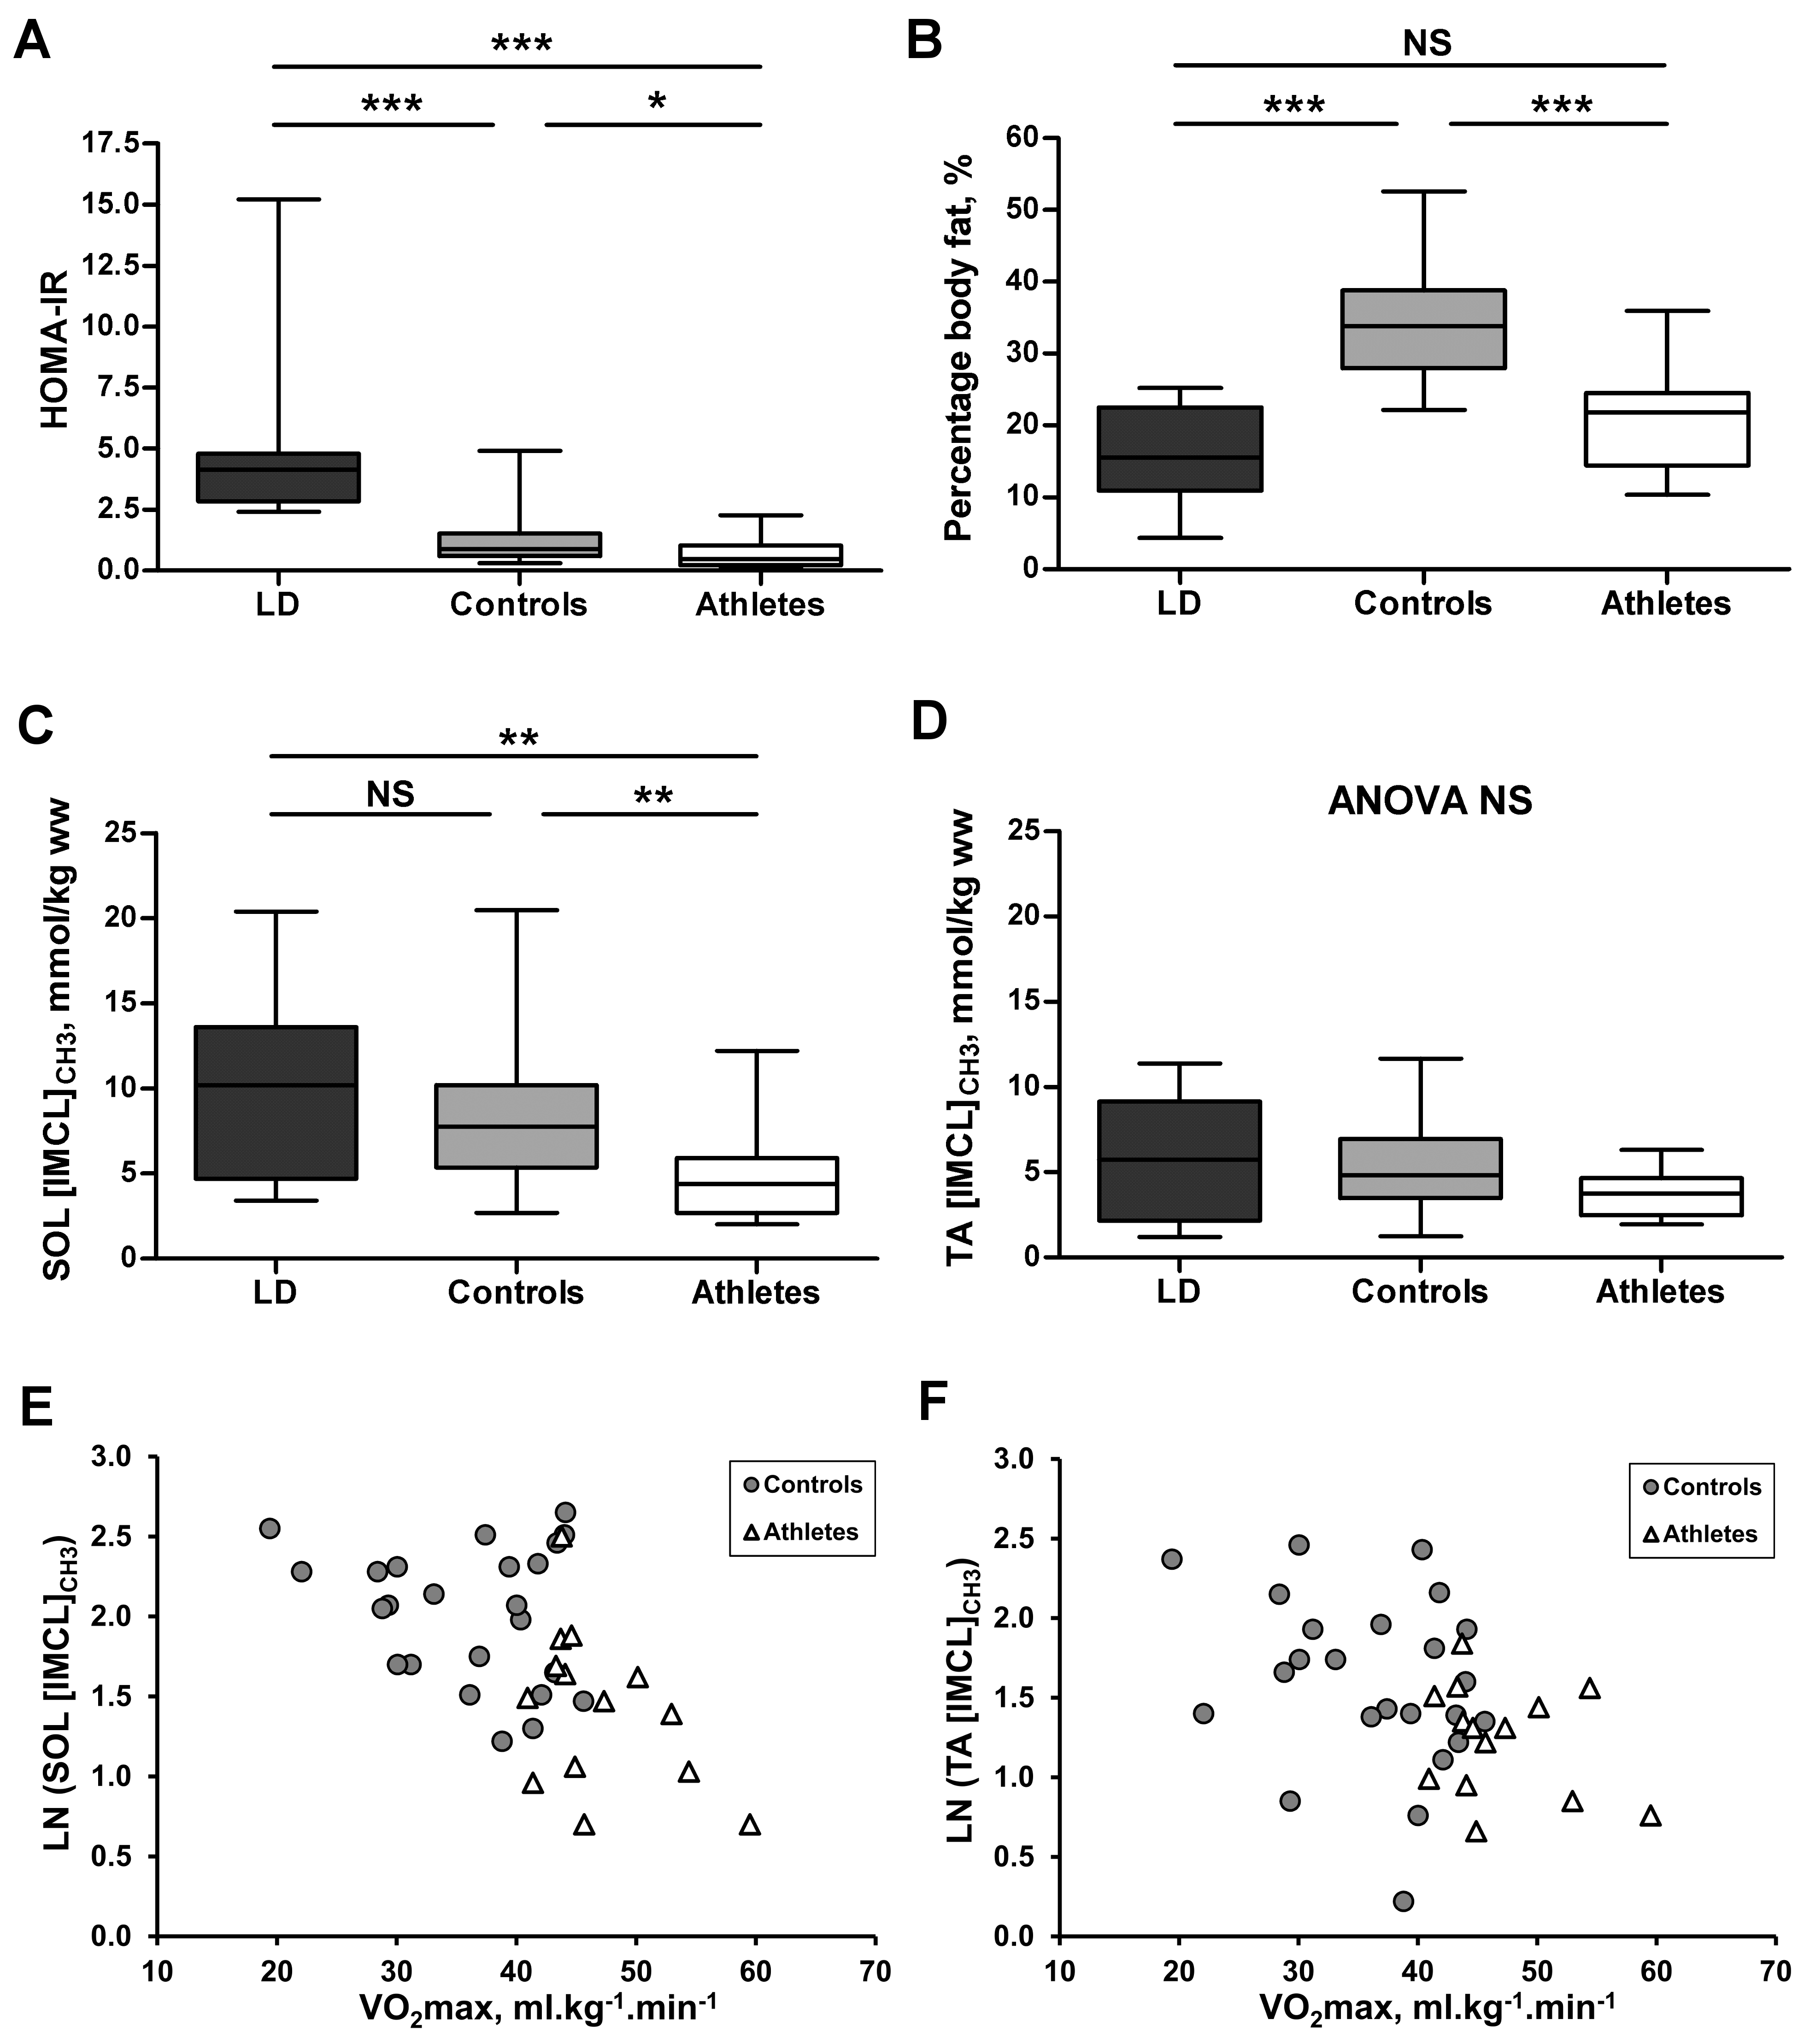
Insulin and HOMA-IR were significantly higher in the lipodystrophic patients and lower in the athletes (Figs.1&2A) compared with controls. Fat mass and percentage body fat were similar between lipodystrophic patients and athletes, which were both lower compared to controls (Fig.2B).
SOL composition-independent IMCL concentrations were not significantly increased (p=0.477) in the lipodystrophic patients compared to controls, but were higher compared to the lean athletes (Fig.2C). In the TA, concentrations were similar in all three groups (Fig.2D). Inverse correlations of VO2max and IMCL concentration were found in controls and athletes together (Figs.2E&F).
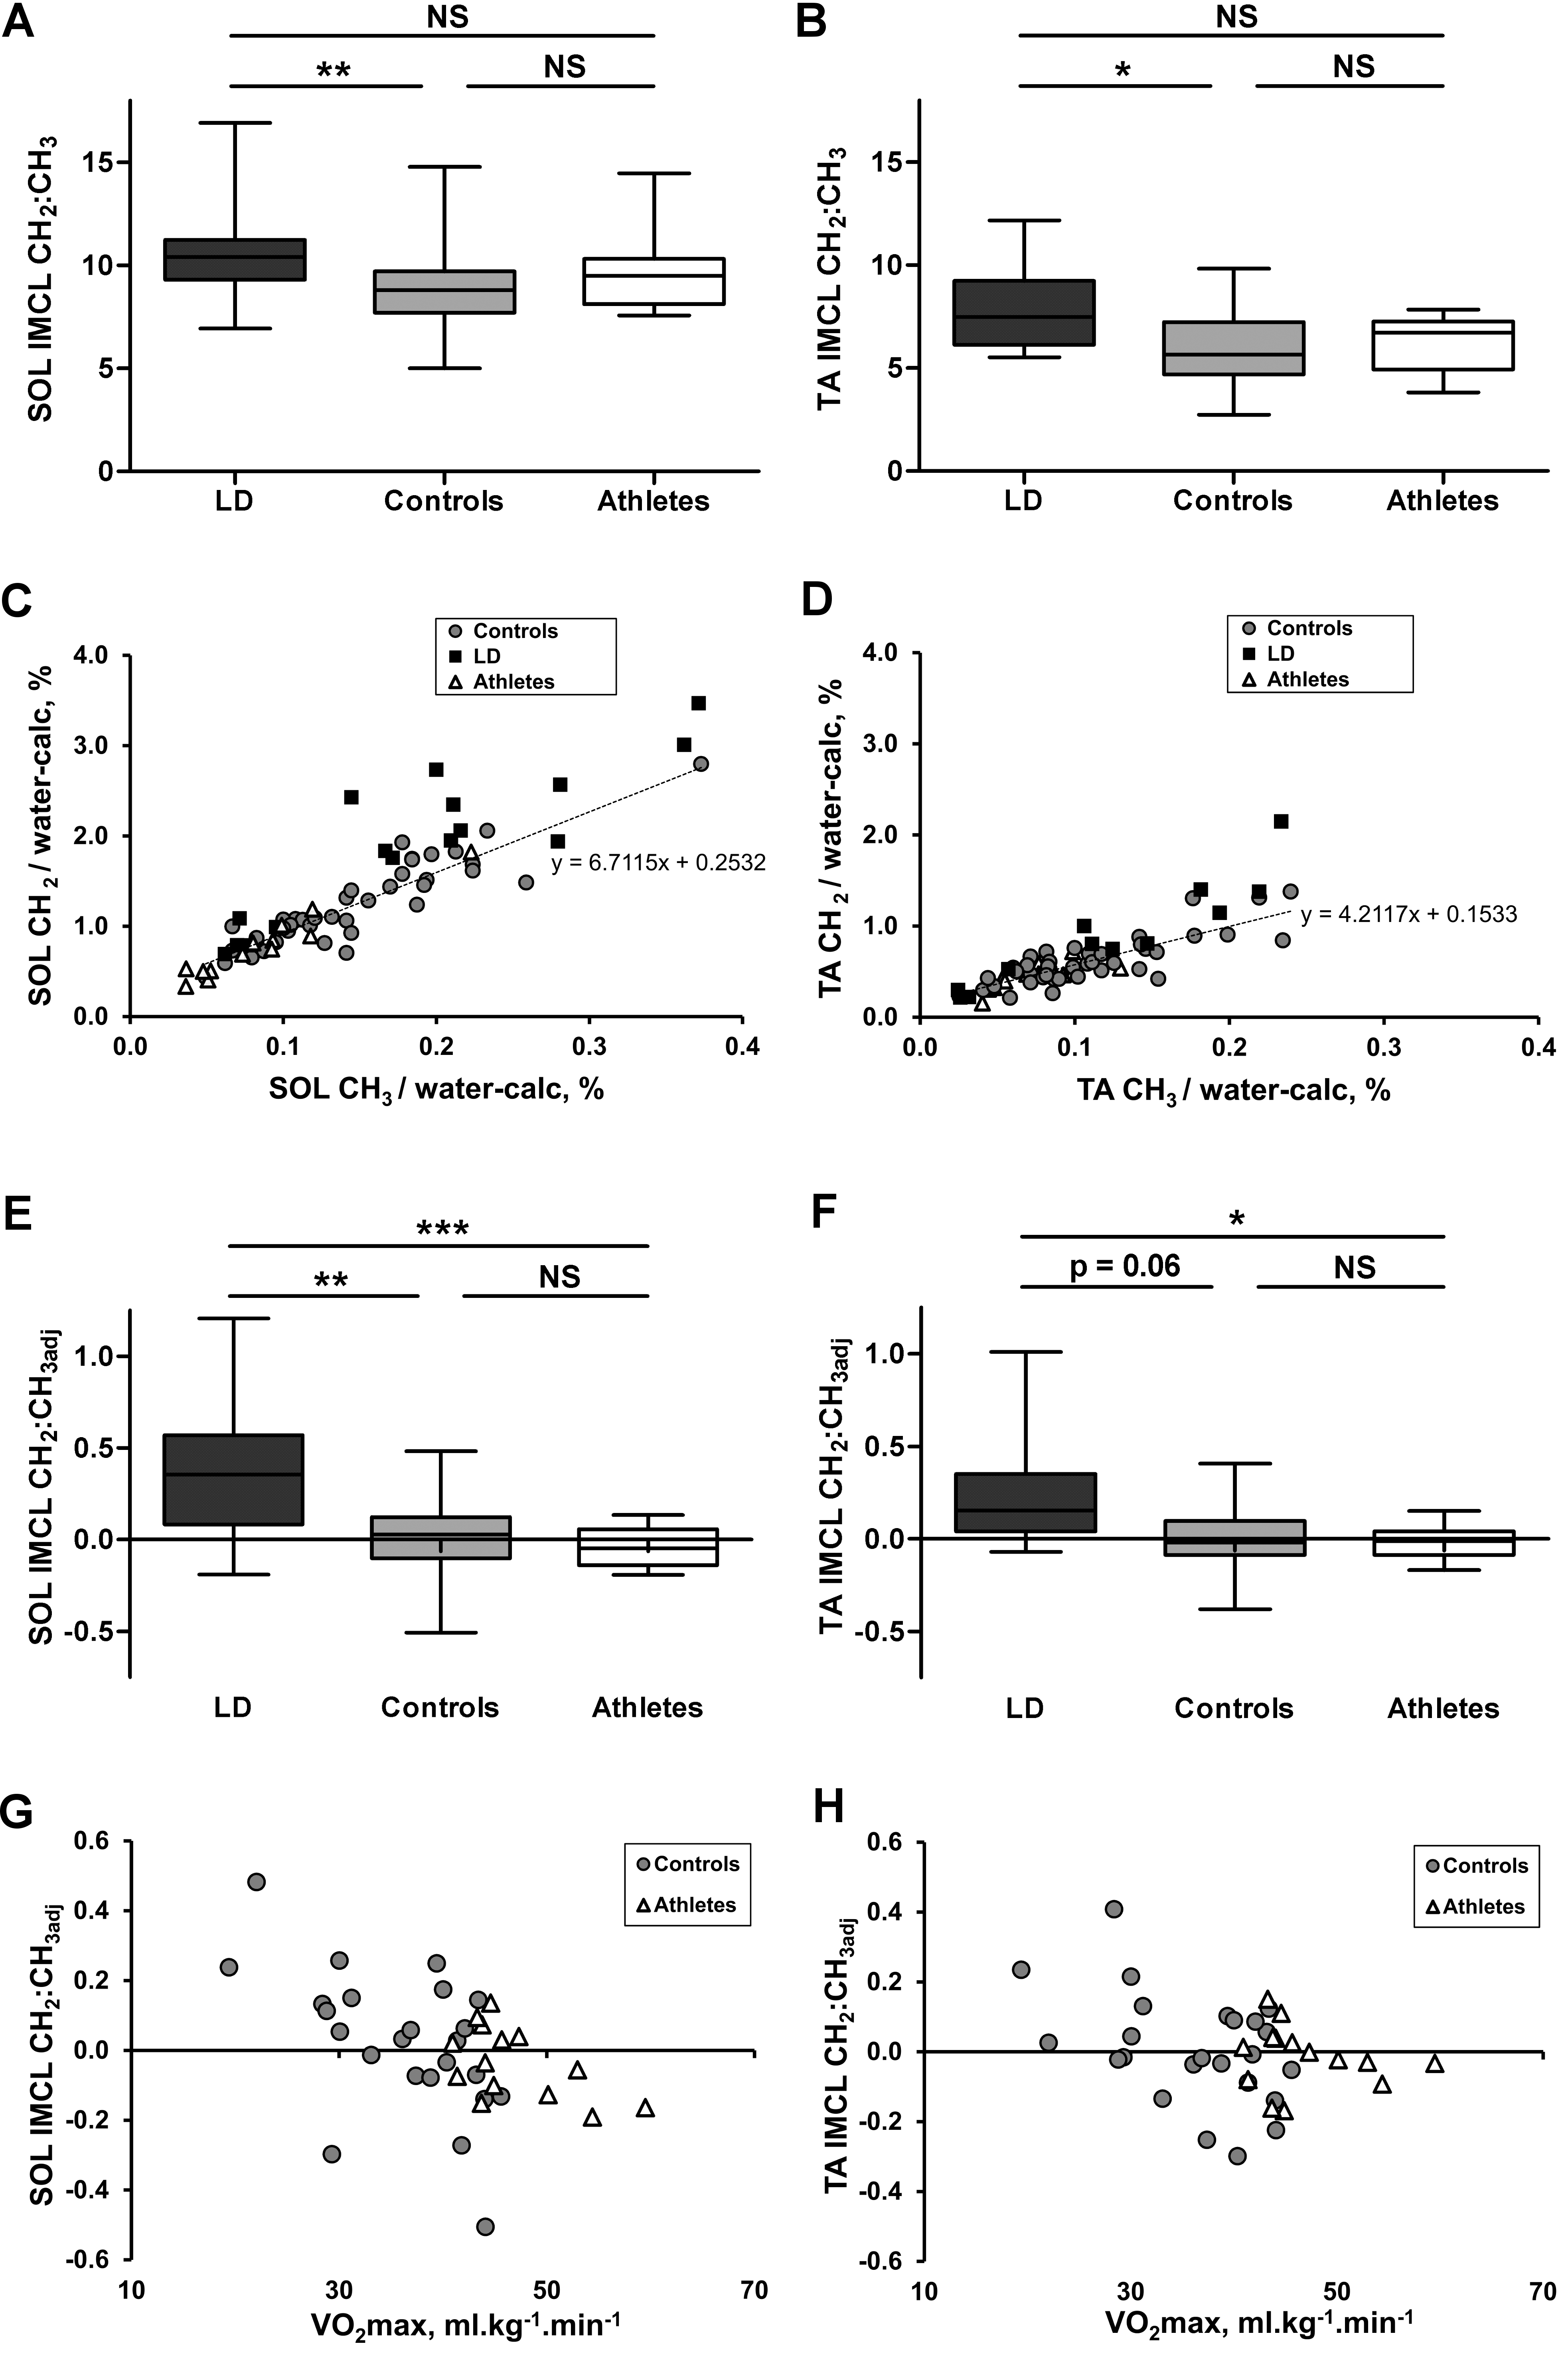
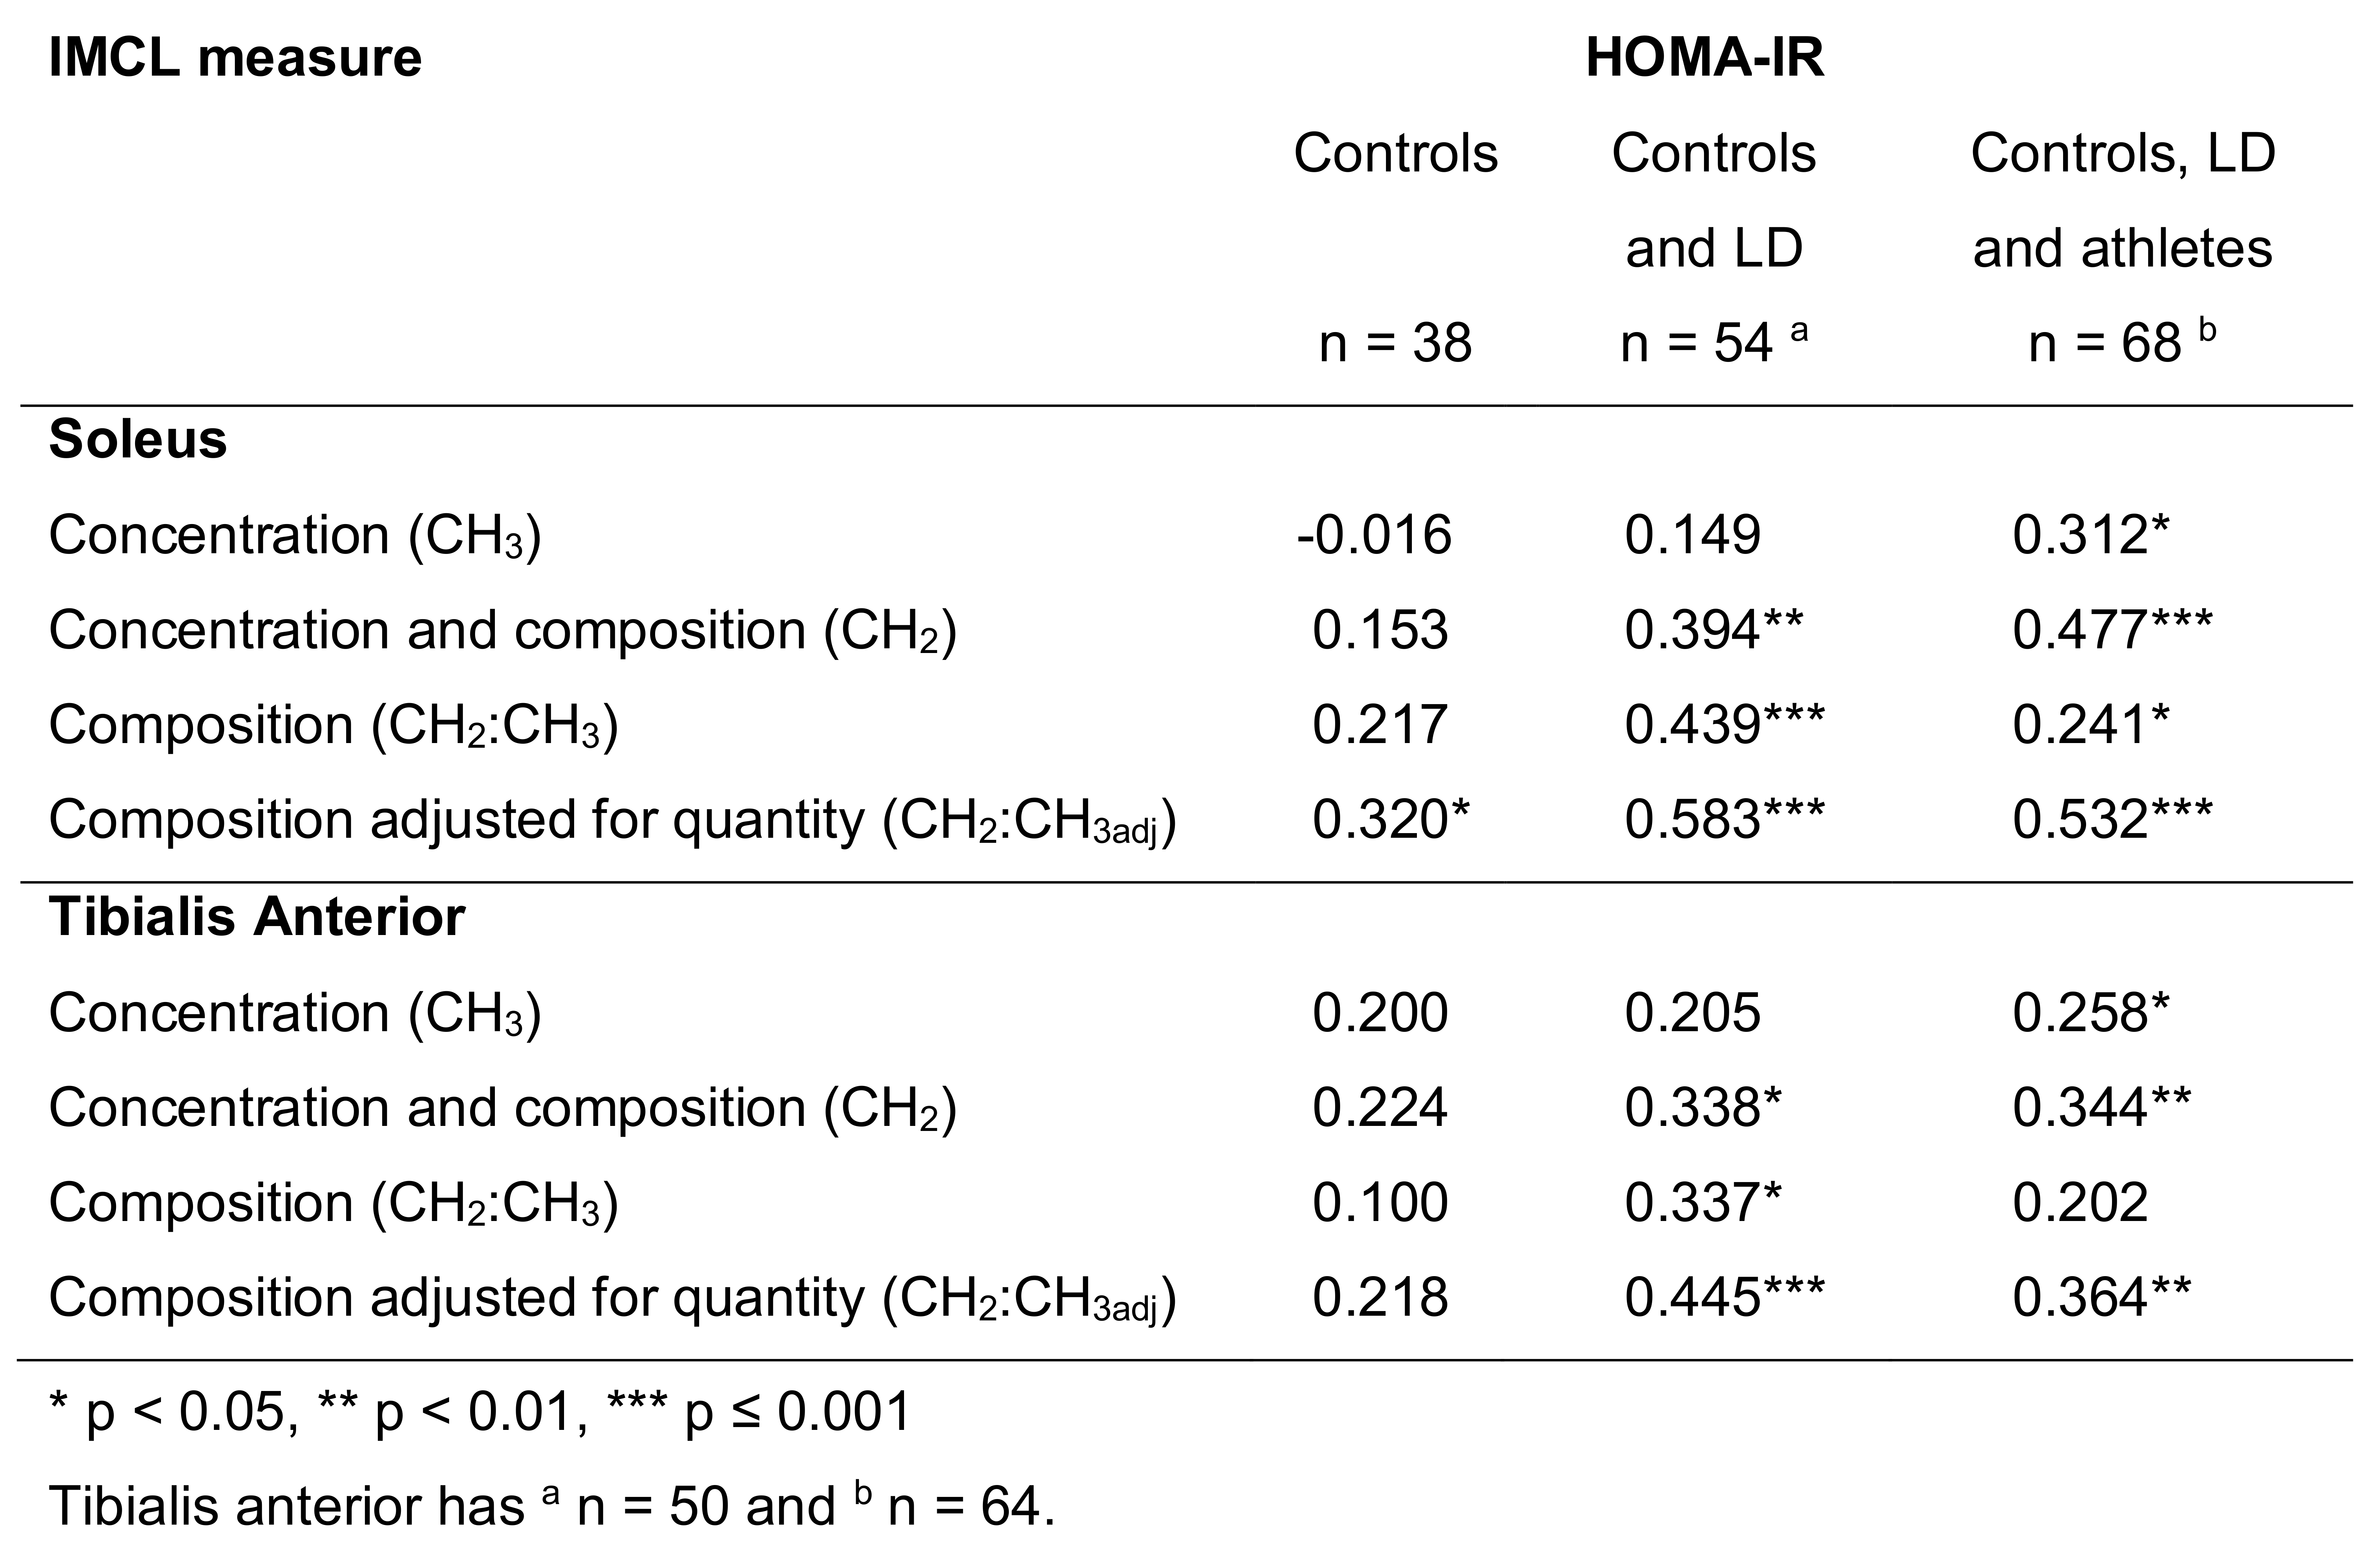
The IMCL CH2:CH3 ratio was significantly higher in both muscles of the lipodystrophic patients compared with age- and gender-matched controls, but not athletes (Fig.3A&B). IMCL CH2:CH3 was dependent on IMCL concentration in the controls, and after adjusting the composition index for quantity (CH2:CH3adj) was able to distinguish patients from athletes (Figs.3E&F). This CH2:CH3adj marker had the stronger relation to insulin resistance (HOMA-IR) compared to concentration alone (Fig.4) and was inversely related to VO2max (Fig.3G&H).
Fig.5 middle illustrates the different fitting results and how the IMCL relations with HOMA-IR are robust (Fig.5 lower).
Discussion
Use of the recently validated 1H MRS approach to determine both the IMCL composition and concentration independent of composition within the soleus and tibialis anterior muscles of female individuals covering a wide range of insulin sensitivities has revealed that accumulation of saturated IMCL is more strongly associated with whole-body insulin resistance than IMCL concentration alone. Our demonstration of an inverse relation of IMCL content and VO2max in controls and athletes is contradictory to the athlete’s paradox but is consistent with a study 8 where a combination of daily training with a low fat diet depleted IMCL levels to a consistent level that related to VO2peak, suggesting our female elite athletes were nearly ‘empty’ of IMCL. Our finding of a strong relationship between VO2max and relatively unsaturated IMCL pools in controls and athletes points to a role of exercise in decreasing the amount of saturated fat within the IMCL store.
Conclusion
The association of insulin resistance with accumulation of saturated IMCL, especially within controls, could suggest an early involvement in its pathogenesis and provide a reason why combined exercise and diet are effective therapeutic options in the early stages of insulin resistance.
Acknowledgements
We thank all the participants, staff at both the NIHR Cambridge Clinical Research Facility and the Wolfson Brain Imaging Centre (WBIC). We acknowledge the NIHR Core Biochemistry Assay Laboratory, Cambridge Biomedical Research Centre, UK, for providing the insulin analysis. We thank Wiktor Olszowy (WBIC) for statistical advice. This research was supported by grants from the Clinical Research Infrastructure Grant, UK NIHR Cambridge Biomedical Research Centre, and the UK Medical Research Council Centre for Obesity and Related Metabolic Diseases. DBS is supported by the Wellcome Trust (107064) and AS by the NIHR via an award to the NIHR Cambridge Clinical Research Facility.References
1 Hernández EÁ, Kahl S, Seelig A, et al. Acute dietary fat intake initiates alterations in energy metabolism and insulin resistance. J Clin Invest. 2017;127(2):695-708.
2 Luukkonen PK, Sädevirta S, Zhou Y, et al. Saturated fat is more metabolically harmful for the human liver than unsaturated fat or simple sugars. Diabetes Care. 2018:dc180071.
3 Thankamony A, Kemp GJ, Koulman A, et al. Compositional marker in vivo reveals intramyocellular lipid turnover during fasting-induced lipolysis. Sci Rep. 2018;8(1):2750.
4 Naressi A, Couturier C, Devos JM, et al. Java-based graphical user interface for the MRUI quantitation package. Magma Magn Reson Mater Physics, Biol Med. 2001;12(2-3):141-152.
5 Stefan D, Cesare F Di, Andrasescu A, et al. Quantitation of magnetic resonance spectroscopy signals: the jMRUI software package. Meas Sci Technol. 2009;20(10):104035.
6 Vanhamme L, Van Den Boogaart A, Van Huffel S. Improved method for accurate and efficient quantification of MRS data with use of prior knowledge. J Magn Reson. 1997;129:35-43.
7 Tanaka H, Monahan KD, Seals DR. Age-predicted maximal heart rate revisited. J Am Coll Cardiol. 2001;37(1):153-156.
8 Ith M, Huber PM, Egger A, et al. Standardized protocol for a depletion of intramyocellular lipids (IMCL). NMR Biomed. 2010;23(5):532-538.
Figures