1924
Assessment of Renal Function Using noncontrast-enhanced MRI: 3D-FIESTA with spatial labeling with multiple inversion pulses and Diffusion-weighted imaging1Radiology, Tongji Hospital, Huazhong University of Science and Technology, Wuhan China, China, 2Department of Radiology, Tongji Hospital, Huazhong University of Science and Technology, Wuhan, Hubei, China
Synopsis
Previous researchs had proved that corticomedullary differentiation contrast ratio obtained from SLEEK was significantly positively correlated with eGFR. But they did not quantitatively analyze the diagnostic performance of SLEEK and did not compare it to other imaging methods. We obtained the area under the curve (AUC) by making the ROC curve to compare the diagnostic performance between SLEEK and DWI. DWI, previous reports have shown that ADC values are positively correlated with eGFR, may be an effective methods to evalaute renal function. Therefor we compared SLEEK with DWI to assess the diagnostic value of SLEEK.
Purpose
To assess whether noncontrast-enhanced MRI with spatial labeling with multiple inversion pulses (SLEEK) can improve the visibility of renal corticomedullary differentiation quantitatively by ROC curves in patients with renal dysfunction compared with the Diffusion-weighted imaging (DWI) and evaluated the association between renal cortical thickness and estimated glomerular filtration rate (eGFR).Materials and Methods
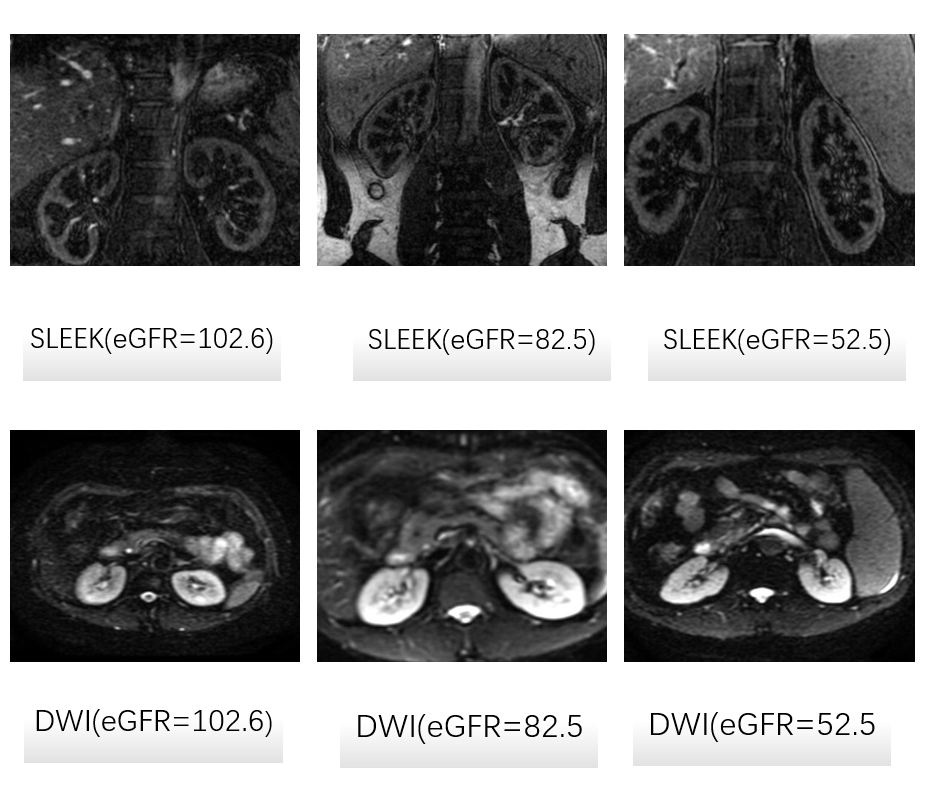
Seventy eight patients with or without renal dysfunction underwent abdominal MRI at 1.5T including a coronal SLEEK sequence and an axial DWI sequence. Patients according to the eGFR were divided into three groups (Group 1, eGFR>90ml/min/1.73m2; Group 2, 60ml/min/1.73m2<eGFR<90ml/min/1.73m2; and Group3, eGFR<60ml/min/1.73m2). Image analysis was performed by two radiologists to generate a signal intensity (SI) by SLEEK and an apparent diffusion coefficient (ADC) by mono-exponential model DWI. The estimated GFR (eGFR) was measured within 10 days before MRI examination.Results
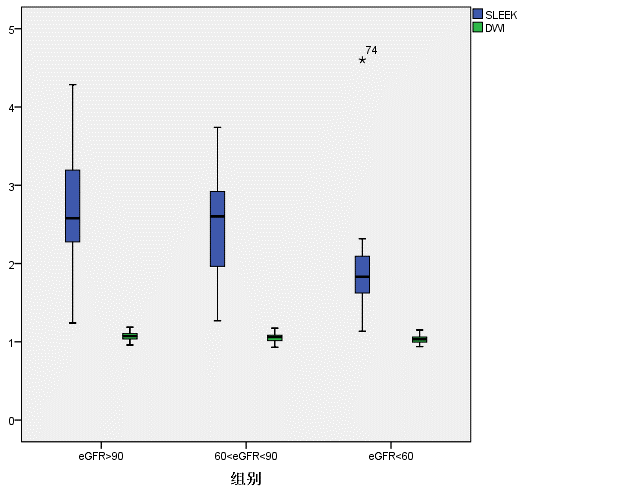
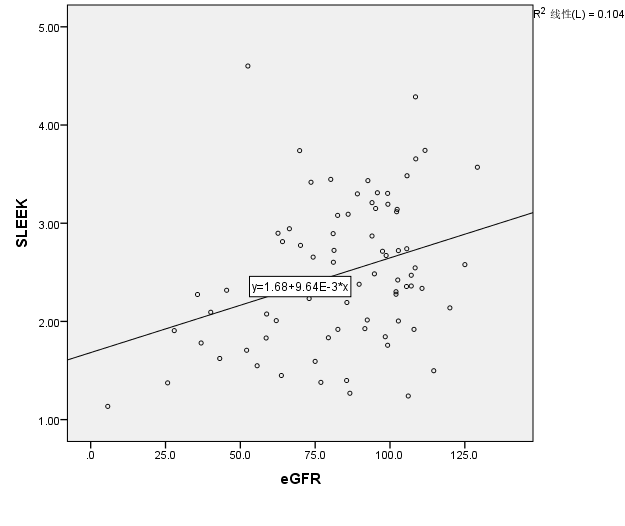
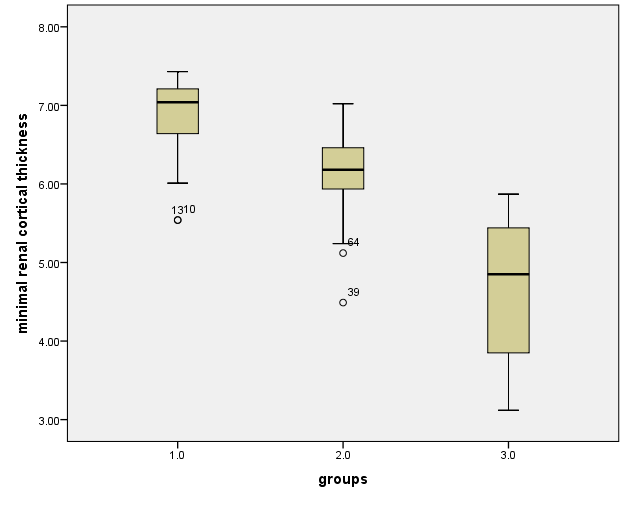
The area under the ROC curve (AUC) of SLEEK combined DWI (0.653) was higher than SLEEK (0.646) or DWI (0.609) separately. Combined SLEEK and DWI generated the higher specificity (94.6%), but the sensitivity (35%) was not as good as SLEEK (52.5%) or DWI (60%). The mean corticomedullary contrast ratio, which was positively correlated with eGFR (p=0.004, r=0.322), was significantly higher in SLEEK with TI=1000ms than in DWI with b value of 1000 s/mm2 in all three groups (p=0.001). There was a significant difference in corticomedullary contrast ratio in SLEEK between group1 and group3 (p=0.006), however, there were no significant differences between group1 and group2 (p=0.285) or group2 and group3 (p=0.064). In the SLEEK, a significantly positive correlation was observed between minimal renal cortical thickness and eGFR (P<0.001, r=0.729).Discussion
Our study found that corticomedullary differentiation contrast ratio obtained from SLEEK was significantly positively correlated with eGFR, which was similar to previous findings.[14] But they did not quantitatively analyze the diagnostic performance of SLEEK and did not compare it to other imaging methods. We obtained the area under the curve (AUC) by making the ROC curve to compare the diagnostic performance between SLEEK and DWI and we found that combined SLEEK and DWI generated the highest AUC (0.653) and corresponding sensitivity and specificity were 94.6% and 35%, respectively. Combined SLEEK and DWI can improve specificity, but the sensitivity is not as good as applying SLEEK or DWI alone.
Regardless of the simple mono-exponential model or bi-exponential model for DWI, previous reports have shown that ADC values are positively correlated with eGFR, [13, 17, 18] however, in our study, DWI's ability to distinguish corticomedullary contrast ratios was not as good as SLEEK, even in the third group (eGFR <60 ml/min/1.73m2), corticomedullary contrast ratio in SLEEK images with optimal TI was approximately 2 times that in DWI images.
Conclusion
Noncontrast-enhanced MRI with SLEEK can improve the recognition of renal corticomedullary differentiation in patients with renal dysfunction compared with DWI and assess renal function quantitatively. SLEEK combined with DWI can be a better technique to evaluate the function of kidney.Acknowledgements
No acknowledgement found.References
1. McLaughlin, M.J. and A.E. Courtney, Early recognition of CKD can delay progression. Practitioner, 2013. 257(1758): p. 13-7, 2.
2. Shemesh, O., et al., Limitations of creatinine as a filtration marker in glomerulopathic patients. Kidney Int, 1985. 28(5): p. 830-8.
3. Dilauro, M., et al., Comparison of Contrast-Enhanced Multiphase Renal Protocol CT Versus MRI for Diagnosis of Papillary Renal Cell Carcinoma. AJR Am J Roentgenol, 2016. 206(2): p. 319-25.
4. Wang, H., et al., Dynamic Contrast-enhanced MR Imaging in Renal Cell Carcinoma: Reproducibility of Histogram Analysis on Pharmacokinetic Parameters. Scientific reports, 2016. 6(1): p. 29146.
5. Liu, W., K. Sung and D. Ruan, Shape-based motion correction in dynamic contrast-enhanced MRI for quantitative assessment of renal function. Medical Physics, 2014. 41(12): p. 122302.
6. Pietsch, H., et al., Impact of renal impairment on long-term retention of gadolinium in the rodent skin following the administration of gadolinium-based contrast agents. Invest Radiol, 2009. 44(4): p. 226-33.
7. Bhave, G., J.B. Lewis and S.S. Chang, Association of gadolinium based magnetic resonance imaging contrast agents and nephrogenic systemic fibrosis. J Urol, 2008. 180(3): p. 830-5; discussion 835.
8. Grobner, T., Gadolinium--a specific trigger for the development of nephrogenic fibrosing dermopathy and nephrogenic systemic fibrosis? Nephrol Dial Transplant, 2006. 21(4): p. 1104-8.
9. Adams, L.C., et al., Assessing venous thrombus in renal cell carcinoma: preliminary results for unenhanced 3D-SSFP MRI. Clinical Radiology, 2018. 73(8): p. 757.e9-757.e19
10. Otsuka, T., et al., Kidney morphological parameters measured using noncontrast-enhanced steady-state free precession MRI with spatially selective inversion recovery pulse correlate with eGFR in patients with advanced CKD. Clinical and Experimental Nephrology, 2018. 22(1): p. 45-54.
11. Mytsyk, Y., et al., Differential diagnosis of the small renal masses: role of the apparent diffusion coefficient of the diffusion-weighted MRI. Int Urol Nephrol, 2017.
12. Meta analysis of diffusion weighted Source Clin Imaging SO 2018 Aug 23 52 264 272[PMIDT30172176].
13. Ding, J., et al., Assessment of renal dysfunction with diffusion-weighted imaging: comparing intra-voxel incoherent motion (IVIM) with a mono-exponential model. Acta Radiologica, 2016. 57(4): p. 507-512.
14. Noda, Y., et al., Measurement of renal cortical thickness using noncontrast-enhanced steady-state free precession MRI with spatially selective inversion recovery pulse: Association with renal function. Journal of Magnetic Resonance Imaging, 2015. 41(6): p. 1615-1621.
15. Kanki, A., et al., Corticomedullary differentiation of the kidney: Evaluation with noncontrast-enhanced steady-state free precession (SSFP) MRI with time-spatial labeling inversion pulse (time-SLIP). Journal of Magnetic Resonance Imaging, 2013. 37(5): p. 1178-1181.
16. Ye, H., et al., Coronal Diffusion-weighted Magnetic Resonance Imaging of the Kidney: Agreement with Axial Diffusion-weighted Magnetic Imaging in Terms of Apparent Diffusion Coefficient Values. Chinese Medical Journal, 2015. 128(4): p. 499.
17. Yalcin-Safak, K., et al., The relationship of ADC values of renal parenchyma with CKD stage and serum creatinine levels. Eur J Radiol Open, 2016. 3: p. 8-11.
18. Xu, Y., X. Wang and X. Jiang, Relationship between the renal apparent diffusion coefficient and glomerular filtration rate: Preliminary experience. Journal of Magnetic Resonance Imaging, 2007. 26(3): p. 678-681.
19. Otsuka, T., et al., Kidney morphological parameters measured using noncontrast-enhanced steady-state free precession MRI with spatially selective inversion recovery pulse correlate with eGFR in patients with advanced CKD. Clin Exp Nephrol, 2017.
20. Nery, F., I. Gordon and D.L. Thomas, Non-Invasive Renal Perfusion Imaging Using Arterial Spin Labeling MRI: Challenges and Opportunities. Diagnostics (Basel), 2018. 8(1).
21. Kanki, A., et al., Evaluation of renal cortical thickness by non-contrast-enhanced MR imaging with spatially selective IR pulses: comparison between cirrhotic and non-cirrhotic patients. The British journal of radiology, 2016. 89(1064 ): p. 20150803 .
22. Tsukuda, T., et al., Pre- and postprandial alterations of portal venous flow: Evaluation with single breath-hold three-dimensional half-fourier fast spin-echo MR imaging and a selective inversion recovery tagging pulse. Journal of Magnetic Resonance Imaging, 2005. 22(4): p. 527-533.
23. Garcia, D.M., G. Duhamel and D.C. Alsop, Efficiency of inversion pulses for background suppressed arterial spin labeling. Magnetic Resonance in Medicine, 2005. 54(2): p. 366-372.
24. Depiction of Transplant renal Vascular anatomy and complications: Unenhanced MR Angiography by Using Spatial Labeling with Multiple Inversion Pulses1.
25. Denic, A., et al., Clinical and Pathology Findings Associate Consistently with Larger Glomerular Volume. Journal of the American Society of Nephrology : JASN, 2018. 29(7): p. 1960.
Figures
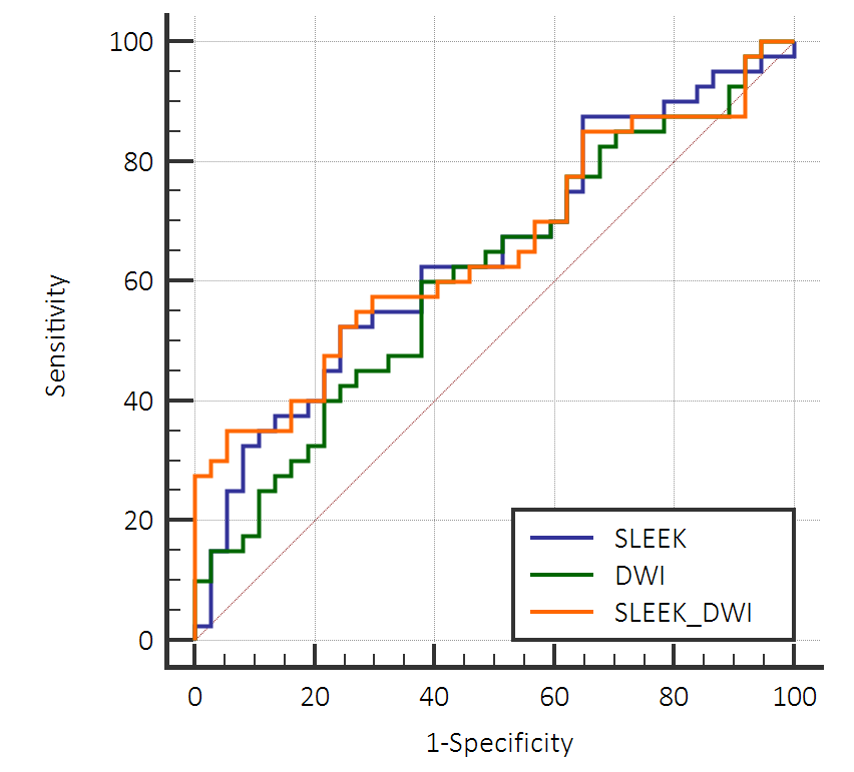
- ROC
curves for diagnostic performance of SLEEK, DWI, SLEEK combined DWI in
differentiating the patients with normal renal function(eGFR>90ml/min/1.73m2) and abnormal renal function
(eGFR<90ml/min/1.73m2). The SLEEK combined DWI diagnostic
efficiency and its AUC is 0.653.