1922
Renal intravoxel-incoherent-motion analysis with a three-compartment model taking into account the renal tubules1Tohoku University Graduate school of medicine, Sendai, Japan, 2Tohoku University hospital, Sendai, Japan
Synopsis
We were able to estimate diffusion and relaxation parameters of the renal parenchyma, flowing blood and tubular water by intravoxel incoherent motion (IVIM) analysis with a three-compartment model and SE+FLAIR diffusion imaging. The reactive change of three parameters (apparent diffusion coefficient of parenchyma, transverse relaxation rate of blood, and fraction of flowing blood in the renal cortex) were observed.
INTRODUCTION
Intravoxel incoherent motion (IVIM) imaging can differentiate and estimate parameters of tissue blood flow components and parenchymal components in a target tissue. In renal IVIM, it is reported that water components in renal tubules should be also considered1. However, to our knowledge, no study has been reported regarding image analyses that actually take into account of them. If relaxation time of each component differs, it should also be included in an analysis model. In this study, we have developed a three-compartment model that is consisted of renal parenchyma, blood vessels and tubules. We have applied the model to analyze IVIM images acquired before and after hydration challenge.METHODS
The study was approved by the institutional review board and written informed consent was obtained from all study subjects. Ten healthy volunteers (mean age, 34.8 years, range, 23-67 years, men, 6) were enrolled in this study. All subjects underwent MRI examinations before and 20-40 minutes after hydration challenge (drinking water: amount of water, 20ml/kg * body weight). A 3T MR scanner (Achieva dStream, Philips Medical Systems) with 32ch ds-Torso and 32ch Posterior coils was used for the examinations. Spin-echo (SE)-based DWI and fluid-attenuated inversion- recovery (FLAIR)-DWI with short and long TE were imaged in coronal plane under free breathing. Basic imaging parameters were: slice thickness = 8 [mm], number of slice = 1, acquisition matrix = 65x112 , FOV = 230 [mm], number of signal averaged=15, b=0, 250, 500 [s mm-2]. Imaging parameters of FLAIR-DWI were: TR/TEshort/TElong = 5500/59/84 [ms] and TI =2000[ms]. Imaging parameters for SE-based DWI were: TR/TEshort/TElong = 3000/59/84 [ms].
The following parameters were estimated based on fitting three-compartment model to the 12 image data with least squares method: apparent diffusion coefficients (Dt), longitudinal relaxation rate (R1t = 1/T1t), transverse relaxation rate (R2t = 1/T2t) of renal parenchymal component, fraction (fb) and transverse relaxation rate (R2b = 1/T2b) of flowing blood component, and fraction of renal tubular water (fw). We hypothesized the following parameters with published references:2 apparent diffusion coefficients (Db,) and longitudinal relaxation time (R1b = 1/T1b) of flowing blood, apparent diffusion coefficients (Dw), longitudinal (R1w = 1/T1w) and transverse (R2w = 1/T2w) relaxation rate of water in renal tubules. The MRI signal from each component was assumed to decay exponentially by diffusion and relaxation: Exp[-D b] Exp[- R TE]; then superposed. Pared T-test was performed to evaluate changes of these parameters before and after hydration challenge. P < 0.05 was considered statistically significant.
RESULTS
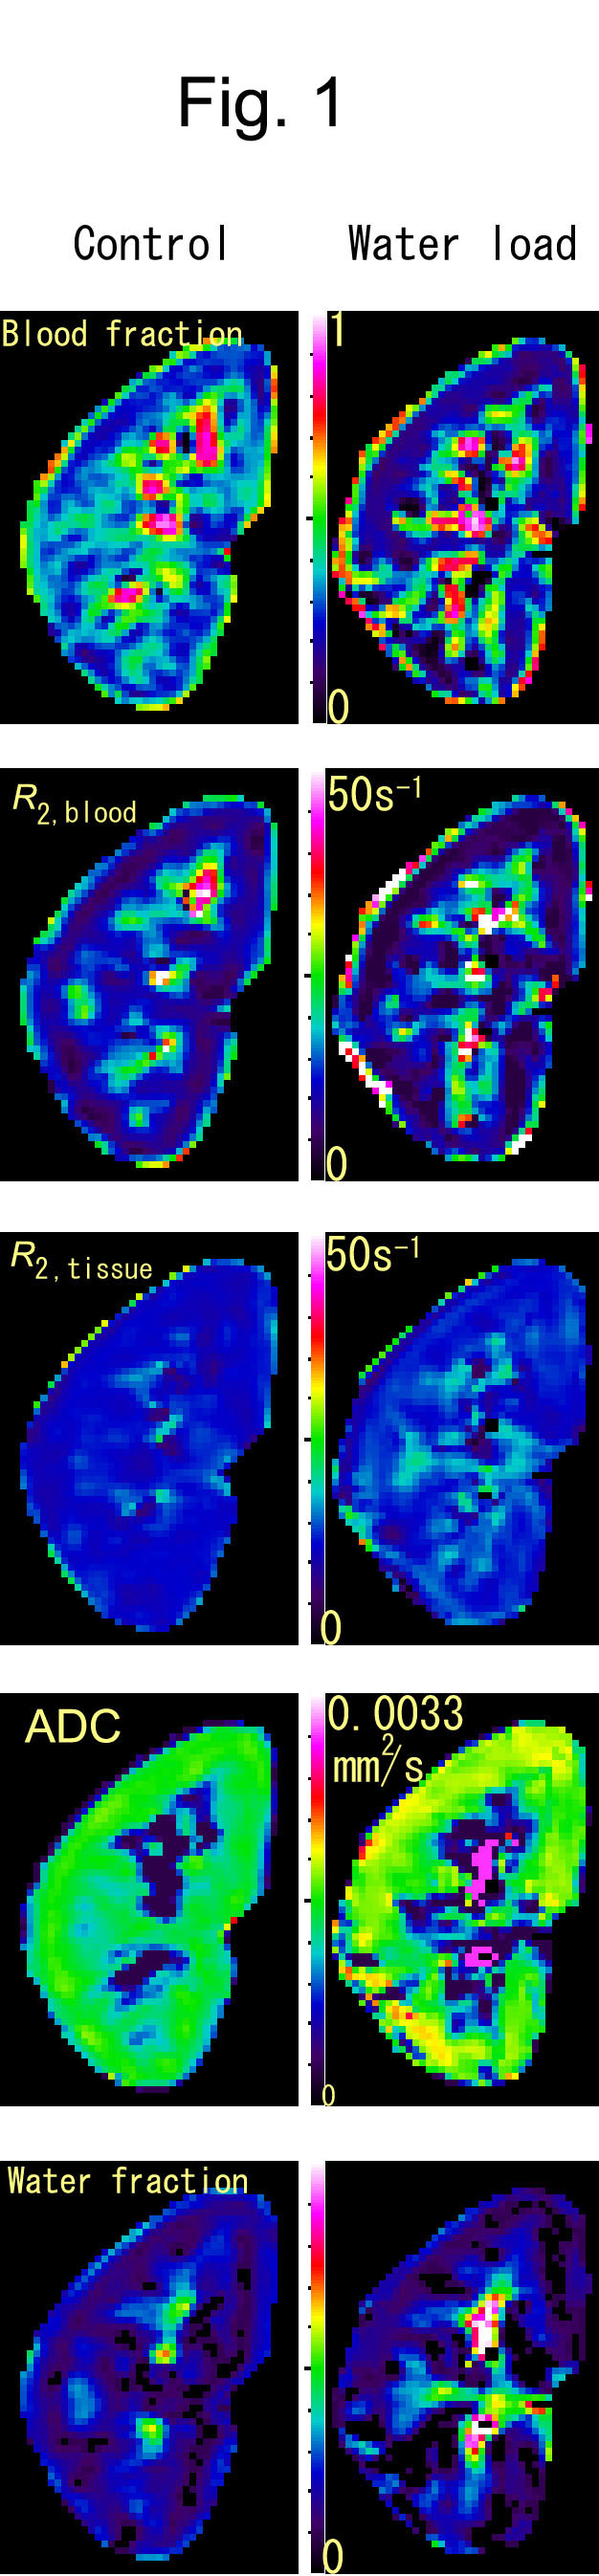
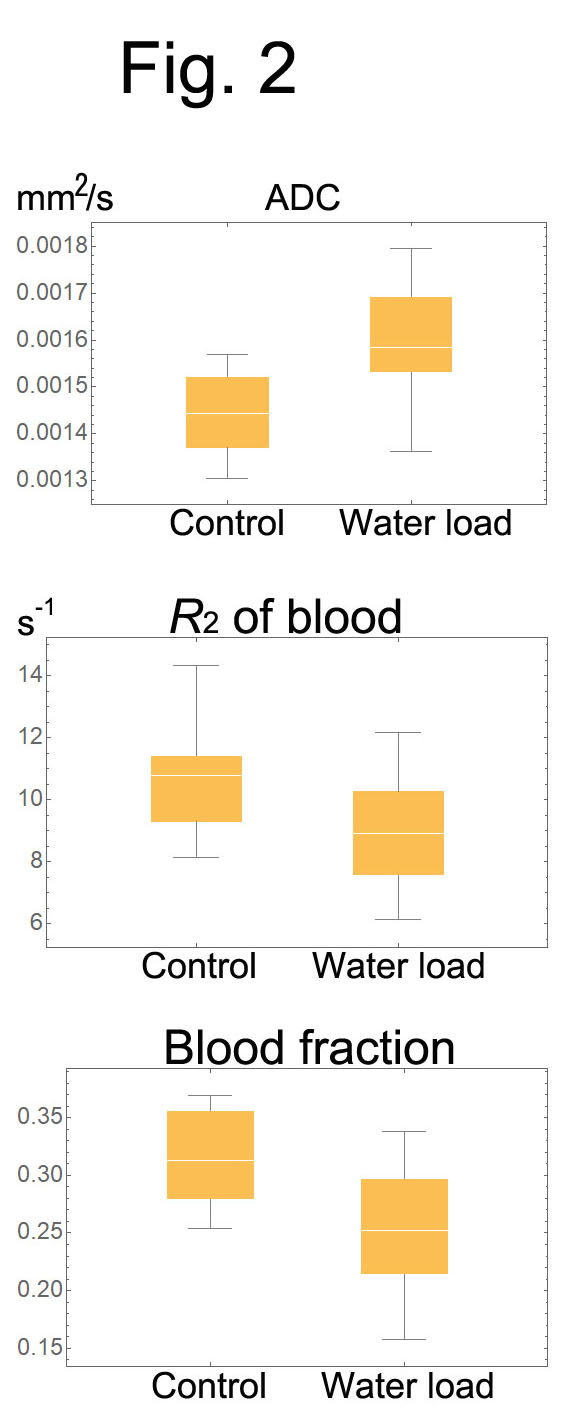
Fig. 1 shows examples of estimated parameter maps before and after water loading. The increase in parenchymal Dt, decreases in fb and R2b of the blood were significantly (P≤0.01) observed in the renal cortex after water loading (Fig. 2).DISCUSSION
We were able to estimate diffusion and relaxation parameters of the renal parenchyma, blood flow and tubular water by IVIM analysis with a 3-compartment model and SE+FLAIR diffusion imaging. The estimated values except for fw (previously unknown) were not significantly different from those appeared in previous reports. The reactive change in 3 parameters (Dt, R2b, fb) were observed. Comparative studies with established renal-function evaluation may provide clinically useful non-invasive evaluation method for renal function. SE+FLAIR IVIM imaging takes long time for acquisition (around 20-30 min). More time efficient method of the imaging is necessary. In addition, the model parameters are too many. Some of the parameters are desirable to be determined by additional methods.CONCLUSION
We were able to estimate diffusion and relaxation parameters of the renal parenchyma, blood flow and tubular water by IVIM analysis with a 3-compartment model and SE+FLAIR diffusion imaging. Reactive changes in 3 parameters (Dt, R2b, fb) were observed.Acknowledgements
No acknowledgement found.References
1. Zhang JL, Rusinek H, Chandarana H, Lee VS. Functional MRI of the kidneys. J. Magn. Reson. Imaging 2013;37:282–293
2. Bojorquez J, Bricq S, Acquitter C, et al. What are normal relaxation times of tissues at 3 T? Magnetic Resonance Imaging 2017;35:69–80.
Figures