1920
MRI based Renal Resistivity Index in Chronic Kidney Disease1Department of Physics, University of Colombo, Colombo 3, Sri Lanka, 2Department of Radiology and Neuroradiology, National Hospital of Sri Lanka, Colombo, Sri Lanka
Synopsis
We show, for the first time, the feasibility of using MRI based renal resistivity index (RRI) to differentiate patients with chronic kidney disease from healthy subjects. RRI and the Pulse Wave Velocity (PWV) of the abdominal aorta were calculated using quantitative phase contrast imaging. The RRI was significantly higher in CKD patients (0.71 ± 0.07) than in the healthy subjects (0.65 ± 0.04). The mean PWV was also significantly higher in CKD patient indicating hypertension and arterial stiffness in CKD. The high RRI in CKD indicates restriction to perfusion, probably due to of tubulointerstitial fibrosis in the kidney.
Introduction
Chronic Kidney Disease (CKD) is a highly prevalent renal disorder that could progress to end-stage renal failure. One of the most widely used quantitative diagnostic procedures for kidney diseases is Renal Resistivity Index (RRI)1 which measures the resistance to blood flow, as a result of microvascular abnormalities2.
RRI = (peak systolic velocity - end systolic velocity) / peak systolic velocity
RRI increases with the severity or stage of the disease and correlates with pathological changes such as tubulointerstitial fibrosis and arteriosclerosis in CKD patients3. Generally, RRI = 0.70 is considered an upper threshold for healthy kidney though this number, tends to increase with various pathologies. RRI is based on the Doppler Effect, which depends on the angle of the reflector relative to the Ultrasound (US) probe4. Thus, US based RRI is prone to errors since the probe reflector angle cannot be determined accurately and its operator dependability. Pulse wave velocity (PWV), a method of determining arterial stiffness, is used in the diagnosis of CKD / End Stage Renal Disease using Computer Tomography (CT)5 and US6. In this study we assess the feasibility of phase contrast MRI based RRI and aortic PWV in the classification of CKD and healthy subjects. To our knowledge, this is the first study in which, MRI has been used for RRI calculation.
Method
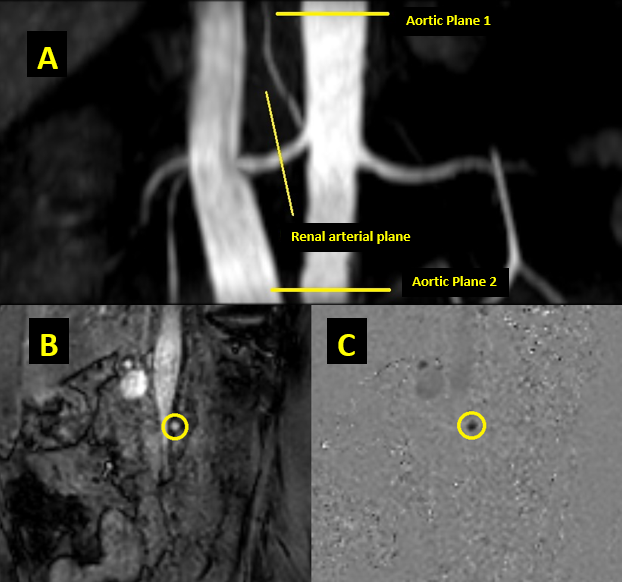
In the present study eighteen age matched (CKD patients n=08 mean age = 51 ± 11 years, healthy volunteers n=10 mean age = 51 ± 8 years, p>0.01) subjects were recruited, with the approval of the institutional ethics committee. Informed written consent was obtained prior to each examination from all subjects. Image acquisition was done using a 3.0 T, multi transmit enabled MRI system (Ingenia, Phillips, The Netherlands) with ECG gating aided. Selected patients were clinically diagnosed as CKD based on their high serum-creatinine levels and healthy volunteers had no clinical history of renal diseases. Renal artery and aortic planes were localized using 3D Time-of-Flight SSFP imaging. The right renal artery and two locations along the abdominal aorta (above and below the renal artery intersection) were scanned (figure 1 A) using, fast phase contrast sequence; sQFlow (TE/TR = 5/3 ms, FOV = 30×30 cm2, slice thickness = 5 mm, matrix size = 256×256, gating = cardiac, VENC = 200 ms-1, temporal resolution = 39 ms) and velocity maps were generated. Renal arterial and aortic blood flow over time were analyzed off-line using custom written Matlab scripts (The MathWorks, Inc., Natick, Massachusetts, US). Region of interest (ROI) was drawn manually around the border of the artery of interest on the magnitude image, the same ROI was used in velocity maps (figure 1 C) to identify the arterial and aortic regions. Background compensation was performed to reduce phase offset errors and background noise. RRI was calculated by determining maximum (peak systolic) and minimum (end systolic) blood velocities. The aortic PWV was calculated; dividing the length between the two plains on aorta by the time shift of maximum velocities in the respective plains. Calculated data were statistically analyzed using two sample student T-test assuming unequal variance.Results
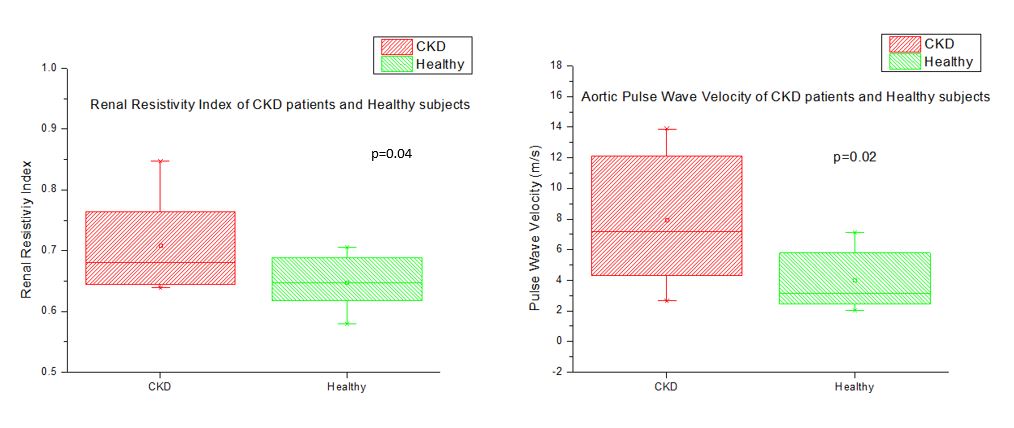
The mean RRI of CKD patients (0.71 ± 0.07) was significantly higher (p=0.04) than that of the healthy subjects (0.65 ± 0.04). The mean PWV of CKD patients (8.0 ± 4.0 ms-1) was also significantly higher (p=0.02) than that of the healthy subjects (4.0 ± 1.8 ms-1) indicating elevated aortic stiffness.Discussion
Our findings suggest that it is feasible to use MRI based RRI and PWV to classify CKD and healthy kidneys. Both of these parameters have shown elevated values in CKD patients. Elevated aortic PWV is associated with hypertension7, a main risk factor for CKD8. Elimination of angle dependency in flow calculation and operator dependency is the main advantage of MRI over US. All CKD patients recruited in this study were on medication for hypertension, which could potentially affect the distribution of RRI and PWV values in the CKD group.Acknowledgements
This research was funded by National Research Council, 120/07, Vidya Mawatha, Colombo 07, Sri Lanka (Grant number – 16-044)References
1. Radermacher J, Chavan A, Bleck J, Vitzthum A, Stoess B. Use of Doppler Ultrasonography to Predict the outcome of Therapy for Renal-Artery Stenosis. N Engl J Med. 2001;344(6):410-417. doi:10.1056/NEJM200102083440603
2. Bude RO, Rubin JM. Experimental Studies Relationship between the Resistive Index and Vascular Compliance and Resistance 1. 1999.
3. Bigé N, Lévy PP, Callard P, et al. Renal arterial resistive index is associated with severe histological changes and poor renal outcome during chronic kidney disease. BMC Nephrol. 2012;13(1):1-9. doi:10.1186/1471-2369-13-139
4. Aaslid R. The Doppler Principle Applied to Measurement of Blood Flow Velocity in Cerebral Arteries. New York: Springer US; 1986.
5. Temmar M, Liabeuf S, Renard C, et al. Pulse wave velocity and vascular calcification at different stages of chronic kidney disease. J Hypertens. 2010;28(1):163-169. doi:10.1097/HJH.0b013e328331b81e
6. Blacher J, Safar ME, Guerin AP, Pannier B, Marchais SJ, London GM. Aortic pulse wave velocity index and mortality in end-stage renal disease. Kidney Int. 2003;63(5):1852-1860. doi:10.1046/j.1523-1755.2003.00932.x
7. Safar ME, Henry O, Meaume S. Aortic Pulse Wave Velocity: An Independent Marker of Cardiovascular Risk. Am J Geriatr Cardiol. 2002;11(5):295-304. doi:doi.org/10.1111/j.1076-7460.2002.00695.x
8. Mehta R, Cai X, Lee J, et al. Association of Fibroblast Growth Factor 23 With Atrial Fibrillation in Chronic Kidney Disease, From the Chronic Renal Insufficiency Cohort Study. JAMA Cardiol. 2016;5(1):548-556. doi:10.1001/jamacardio.2016.1445
Figures