1918
Dynamic changes in cyst growth rates in early autosomal dominant polycystic kidney disease1University of Alabama at Birmingham, Birmingham, AL, 35294, AL, United States, 2University of Kansas, Lawrence, KS, United States, 3Mayo clinic, Rochester, MN, United States, 4University of Chicago, Chicago, IL, United States, 5Emory University, Atlanta, GA, United States, 6University of Pittsburgh, Pittsburgh, PA, United States, 7Legacy Good Samaritan Hospital, Portland, OR, United States
Synopsis
The best method for
the identification of high-risk patients with rapidly progressive autosomal
dominant polycystic kidney disease (ADPKD) is based on height and age-adjusted
total kidney volume (TKV). We sought to improve this assessment by exploring
individual renal cyst growth rates over time. MRI data revealed that ADPKD cysts
grow, remain stable or disappear. The individual cyst volume distribution over
the first year (e.g., skewness or kurtosis) correlated strongly with TKV change
over 3 years (better than TKV change over the first year). It remains to be
determined whether these indices outperform TKV in the prediction of renal
function outcomes.
Introduction
The best methods for identification of high-risk patients for rapidly progressive autosomal dominant polycystic kidney disease (ADPKD) are based on total kidney volume (TKV). Specifically, the height adjusted TKV and age form the foundation for recently defined ADPKD classification1 for prioritization of patients that may benefit most from therapeutic interventions.2 This classification also allows monitoring of therapeutic responses.2 However, TKV trajectories are typically not smooth, even when followed on a yearly basis, and accurate assessment of therapeutic response may require a several-year follow-up. Therefore, we sought a more sensitive alternative for monitoring of the disease activity. While individual cysts were reported to grow at different, although constant, rates (on average 17% per year),3 we hypothesized that: i) fluctuations in TKV over time might be explained by changes in individual cyst growth rates or by cyst disappearance (e.g., due to a cyst rupture), and ii) an index reflecting the growth characteristics of individual cysts might correspond to the underlying disease activity more accurately than the TKV-based indices, especially in the context of disappearing cysts.
Methods
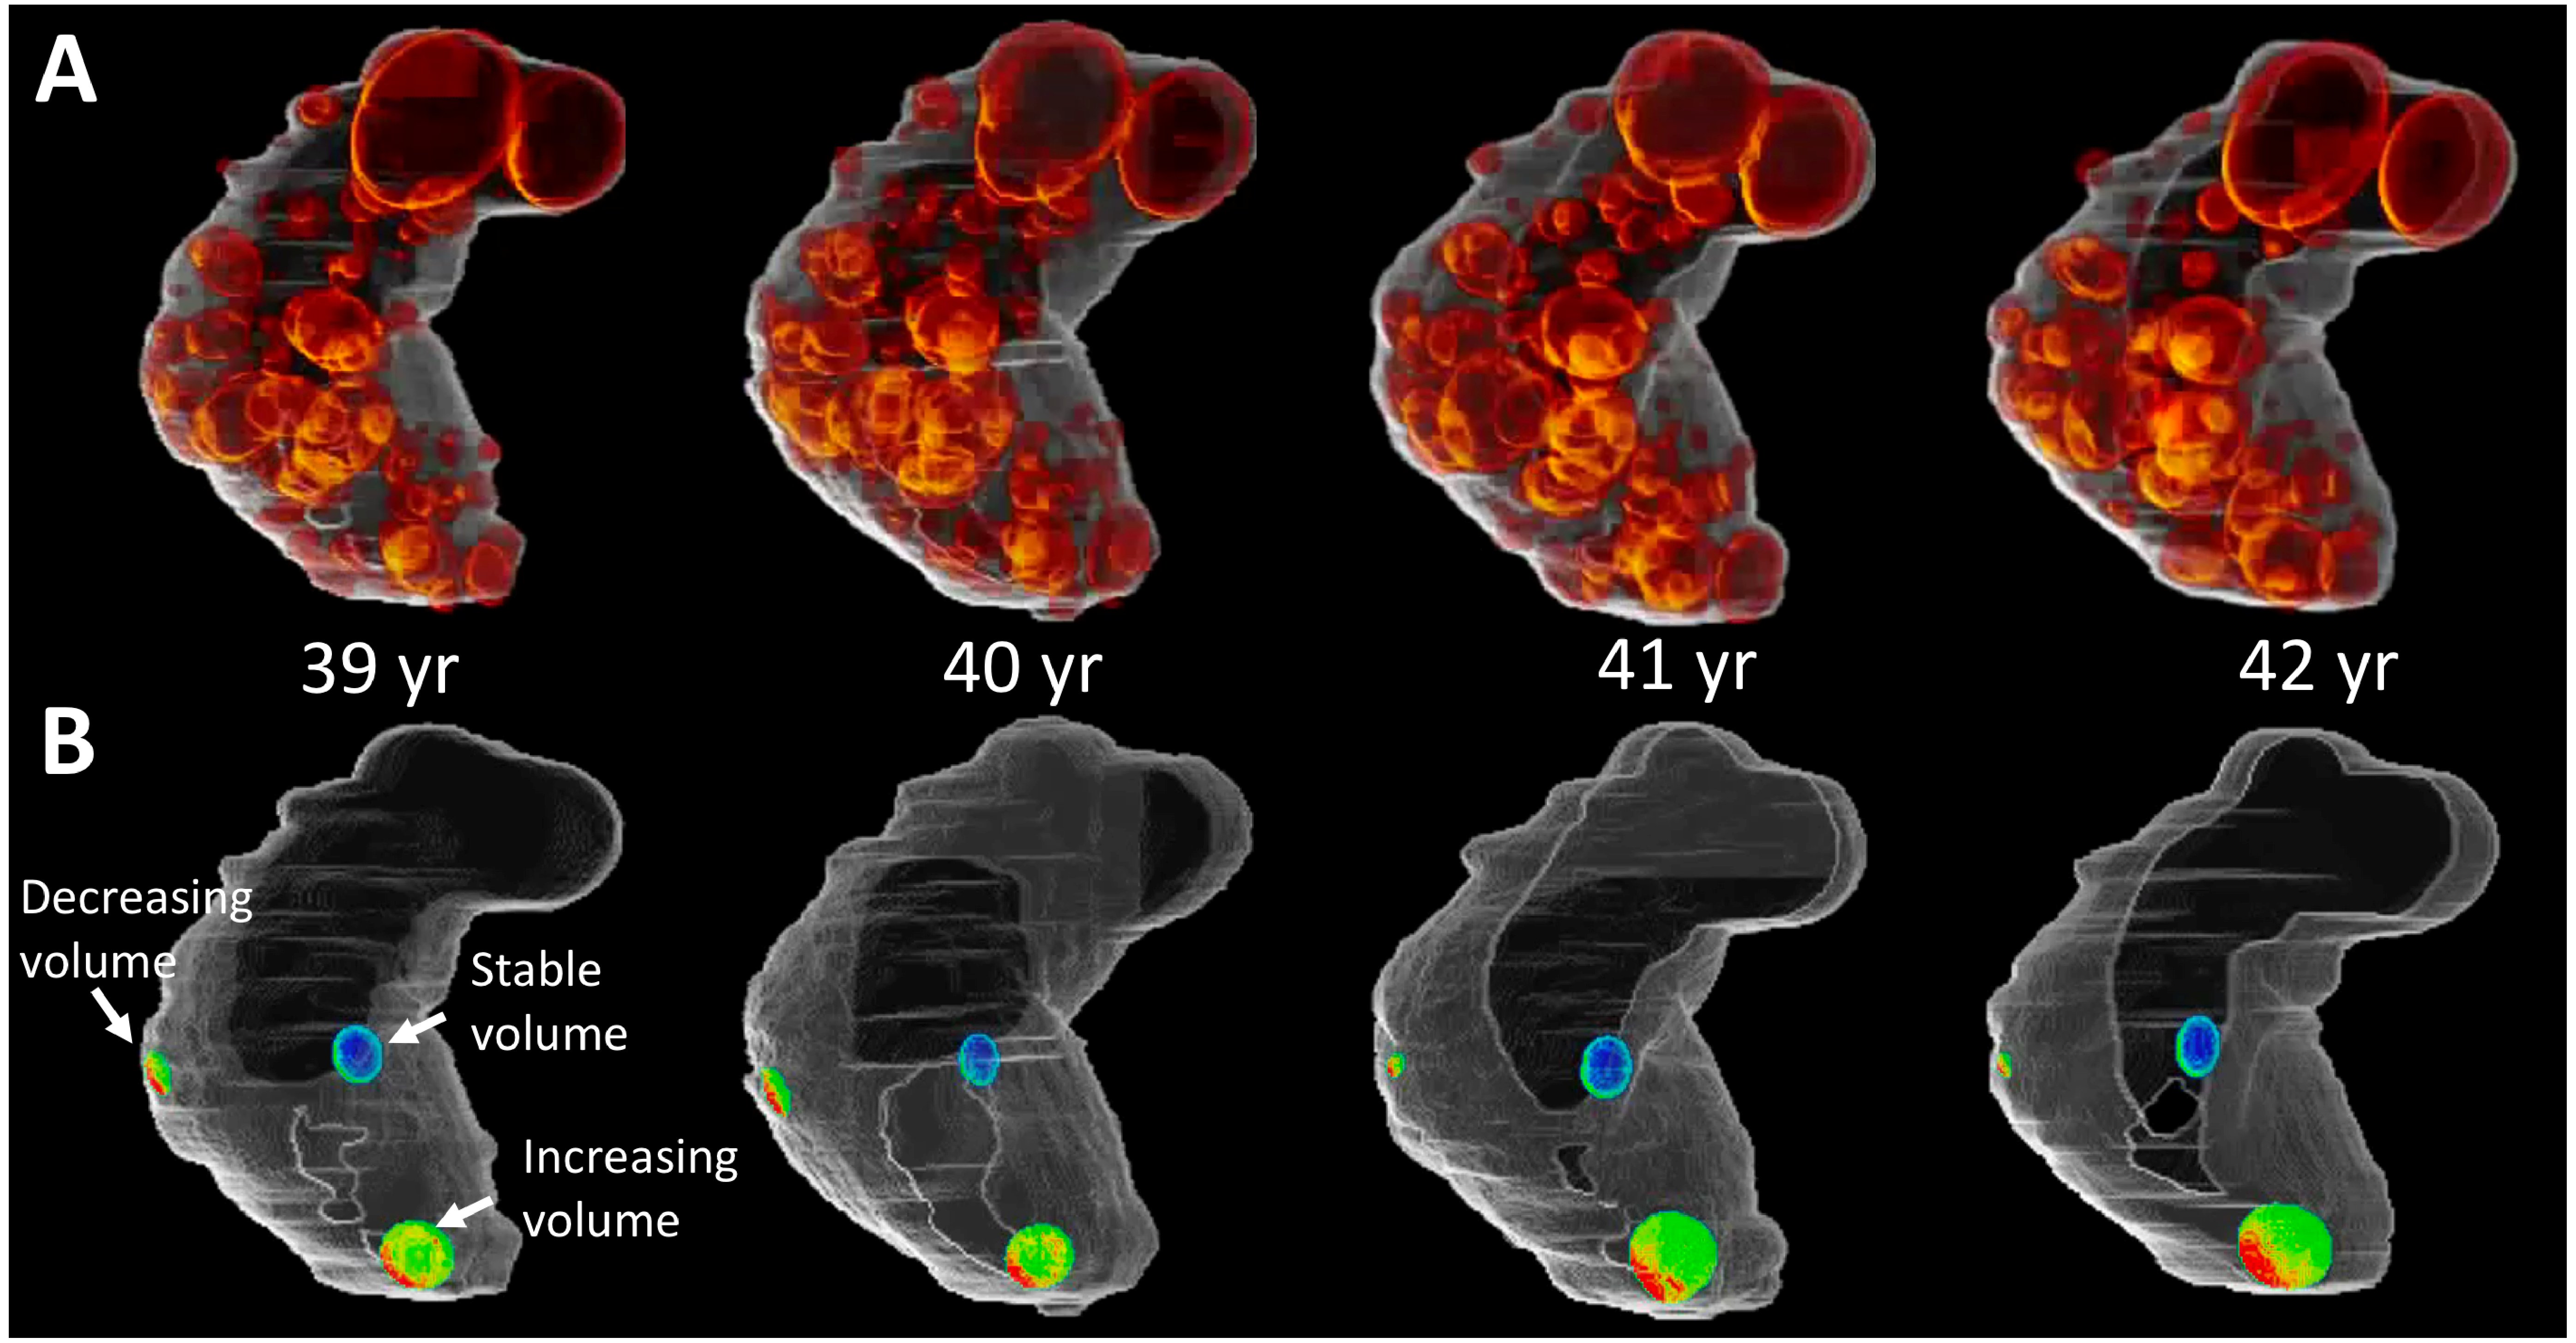
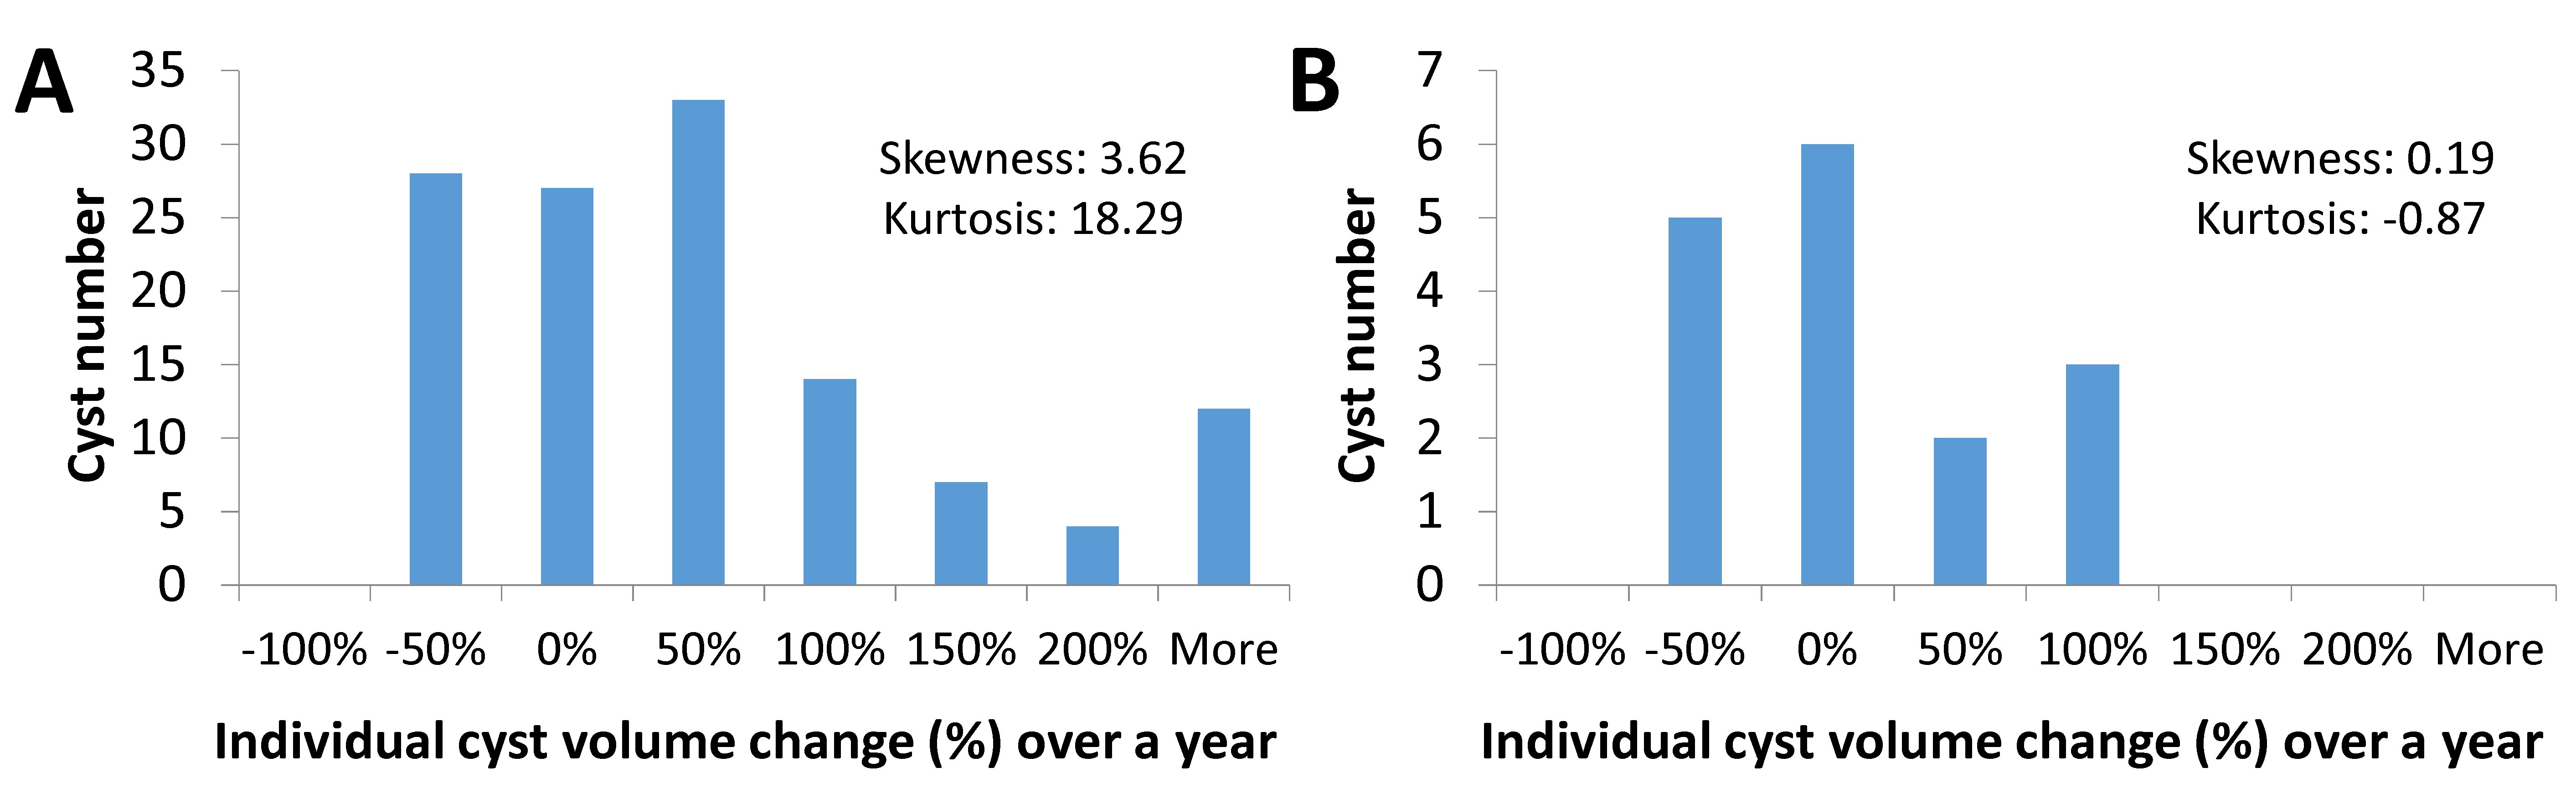
As the initial step towards the evaluation of individual renal cyst growth rates on ADPKD outcomes, we examined MRI images from ten ADPKD patients recruited to the Consortium for Radiologic Imaging Studies of Polycystic Kidney Disease (CRISP) study (6 males and 4 females; average age of 25 yrs). Specifically, we focused on the baseline and the first three annual follow-up MRIs obtained with a 1.5T clinical MRI scanner and a torso phased array coil. 2D T2W images were obtained in coronal view with the following parameters: repetition time (TR)=9-18 s, echo time (TE)=65-90 ms, field of view (FOV)=32-35 cm, thickness=3-5 mm, number of excitation (NEX)=1 or 2, matrix size=256x256, and number of slices=20-40. Kidney and cyst regions were segmented using a thresholding technique, and interpolated to have a cubic voxel (0.68x0.68x0.68 cm; see example on Fig. 1A). All four segmented/interpolated images of each kidney (or cysts) were co-registered using 3D rigid transformation. Two 3D cyst images acquired in two consecutive years were merged, and cysts with matching location were labeled as the same one. The volume change of each individual cyst during the first year was calculated, assigned to specific groups based on the growth rate range, and depicted in histograms. Two histogram features such as skewness and kurtosis were retrieved, and each feature was correlated with TKV change over 3 years. TKV change over the first year was also correlated with that over 3 years. Kidney/cyst segmentation was implemented using ImageJ (NIH free software), while the image co-registration, cyst labeling and histogram feature extraction were conducted automatically using a lab-made computer software program made with Labview (National Instruments, Austin TX). Statistical analyses were done in SAS, version 9.4 (SAS Institute Inc., Cary NC).Results
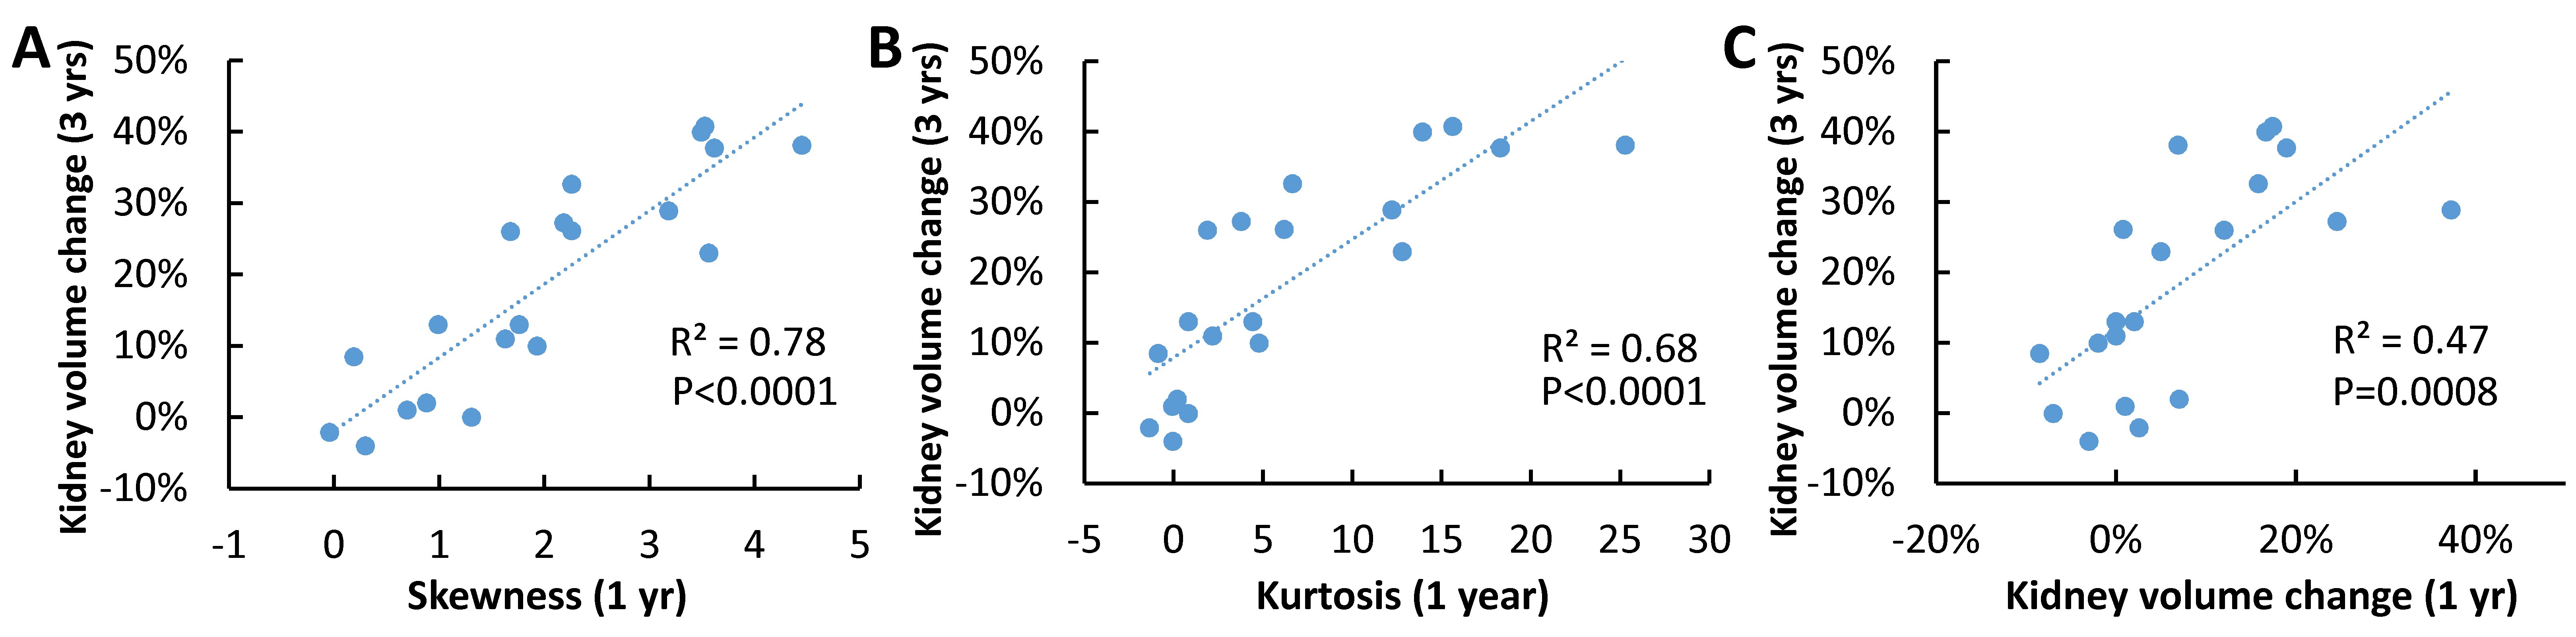
Observed average renal cyst growth rates were about 15% per year (Fig. 1A). However, individual cysts volumes increased or remained relatively unchanged or even decreased over the 3-year follow-up (Fig. 1B). The distribution of individual cyst volume changes in two representative kidneys is depicted as histograms; e.g., for kidney volume increase of 38% over 3 years (Fig. 2A) and 8% increase during the same time period (Fig. 2B). The skewness of cyst growth rate distribution was 0.19-3.62 and kurtosis (-0.87)-18.29. Both, the skewness and kurtosis correlated strongly with TKV change over 3 years (R2=0.78 and R2=0.68; both p<0.0001; Figs. 3A and 3B). In comparison, the TKV change over the first year correlated with the TKV change over 3 years only moderately (R2=0.47; p=0.0008; Fig. 3C).Discussion
The observed dynamic character of individual ADPKD cyst growth rates has not been previously appreciated. The individual cyst growth indices may represent a critical ADPKD readout that more closely reflects the disease activity than TKV indices. This insight may enhance understanding of the disease pathogenesis and development of future therapeutics. Also, we suggest that the dynamic characteristics of cyst growth rates and its local effects might in part explain association of specific renal image texture characteristics with more severe ADPKD outcomes.4Conclusion
This study demonstrates that individual renal ADPKD cyst growth can change over time. The pattern of these changes over 1 year (assessed as skewness and kurtosis) outperforms a baseline TKV or its change over 1 year in the prediction of TKV after 3 years of follow-up. These initial data require validation on a larger number of ADPKD patients. Also, it remains to be determined whether the ADPKD cyst growth skewness and kurtosis indices outperform TKV based indices in the prediction of renal function outcomes.Acknowledgements
This study was supported by NIH P30DK074038 grant.References
1. Irazabal MV, Rangel LJ, Bergstralh EJ, Osborn SL, Harmon AJ, Sundsbak JL, Bae KT, Chapman AB, Grantham JJ, Mrug M, Hogan MC, El-Zoghby ZM, Harris PC, Erickson BJ, King BF, Torres VE, Investigators C. Imaging classification of autosomal dominant polycystic kidney disease: a simple model for selecting patients for clinical trials. J Am Soc Nephrol. 2015;26(1):160-72.
2. Chebib FT, Perrone RD, Chapman AB, Dahl NK, Harris PC, Mrug M, Mustafa RA, Rastogi A, Watnick T, Yu ASL, Torres VE. A Practical Guide for Treatment of Rapidly Progressive ADPKD with Tolvaptan. J Am Soc Nephrol. 2018;29(10):2458-70.
3. Grantham JJ, Cook LT, Wetzel LH, Cadnapaphornchai MA, Bae KT. Evidence of extraordinary growth in the progressive enlargement of renal cysts. Clin J Am Soc Nephrol. 2010;5(5):889-96.
4. Kline TL, Korfiatis P, Edwards ME, Bae KT, Yu A, Chapman AB, Mrug M, Grantham JJ, Landsittel D, Bennett WM, King BF, Harris PC, Torres VE, Erickson BJ, Investigators C. Image texture features predict renal function decline in patients with autosomal dominant polycystic kidney disease. Kidney Int. 2017;92(5):1206-16.
Figures