1911
Glomerular fibrosis in rat kidneys assessed with a clinical 3T MR scanner1Radiology and Imaging Sciences, University of Utah, Salt Lake City, UT, United States, 2Division of Nephrology, University of Utah, Salt Lake City, UT, United States, 3Verily Life Sciences, Cambridge, MA, United States
Synopsis
Glomerular fibrosis develops in multiple types of chronic kidney diseases. This study aims to explore the promising MRI methods for quantifying glomerular fibrosis, and to evaluate the feasibility of performing the measurements for rat kidneys using clinical MRI scanner. Four healthy and 4 fibrotic rats were included in the experiment. With fibrosis, significant changes were found in cortical and medullary T1 and T2. Measurement of T2* suffered from susceptibility artifact. This study verified that clinical MRI scanners can be used to monitor the development of renal fibrosis in rat kidneys.
Introduction
Glomerular fibrosis develops in chronic kidney diseases (CKD) such as chronic glomerulonephritis and diabetic nephropathy. While magnetic resonance imaging (MRI) provides multiple methods for assessing kidneys (1), reliable methods for quantifying glomerular fibrosis are needed. A recent study (2) showed the potential of tissue T2 and perfusion in differentiating different degrees of glomerular fibrosis in rat kidneys. In this study, we tested the hypothesis that glomerular fibrosis causes significant changes in renal T1, T2 and T2*, and that with a 3T clinical MRI scanner these metrics can be measured reproducibly in rat kidneys.Method and Materials
The experiment was approved by the local IACUC, and included 8 male Sprague-Dawley rats weighing 244-273 g. To produce a rat model of renal fibrosis, in 4 of the 8 rats, an injection of 1.75 mg/kg monoclonal antibody OX-7 was injected via the tail vein (3, 4). Expansion of extracellular matrix (ECM) in glomeruli was expected to peak on days 5-7 after induction. MRI was performed using a customized six-channel coil with a U-shape frame and a 3T clinical MRI scanner (Prisma; Siemens). The rat was positioned in the coil in supine and head-first position. During MRI, anesthesia was maintained with isoflurane (100–200 ml/min at 2–3% vaporization) and the body temperature was maintained by pumping warm air heated by a heater (controlled by a monitor probe). Respiration was monitored by a probe positioned between the RF coil and the rat. For each kidney, all images (T1, T2, T2*) were acquired from an axial slice through the center of the kidney. T1-weighted imaging were acquired with modified Look-Locker inversion-recovery with balanced steady-state free precession readout: TI 118, 198, 408, 488, 698, 781, 988, 1280 ms, TE 1.71 ms, TR 290 ms, FOV 50×158 mm, resolution 0.62×0.62 mm, slice thickness 5 mm. T2-weighted images were acquired with turbo spin-echo sequence: TR 1000 ms, TE 9.5, 66, 123 ms, FOV 160×90 mm, resolution 0.62×0.62 mm, slice thickness 2 mm. T2*-weighted images were acquired with multi gradient-echo sequence: TR 1000 ms, TE 2, 5, 9, 12 ,15, 19, 22, 25 ms, flip angle 18°, FOV 204×51 mm, resolution 0.80×0.80 mm, slice thickness 4 mm. For reproducibility test, the scan procedure was repeated three times in a fully independent style. After the experiment, the rats were sacrificed, and the cortical tissue was sampled and stained with periodic acid-Schiff (PAS) solution. Mesangial expansion was estimated from photographs of 400-fold magnification.
T1, T2, and T2* maps were obtained by voxelwise fitting of the signal versus TE (or TI) curves. In each map, regions of interest (ROI) were drawn over cortex and outer stripe of medulla for each kidney. Over each ROI, the parameter values were averaged. For each tissue type (cortex or medulla) and each rat type (healthy or fibrotic), mean and standard deviation (STD) were computed for each parameter. Unpaired T test was used to compare the parameter values between cortex and medulla, and between healthy and fibrotic kidneys. To estimate reproducibility of each parameter, we computed the STD between the three independent estimates of the parameter, and averaged the STD across all the rats.
Results
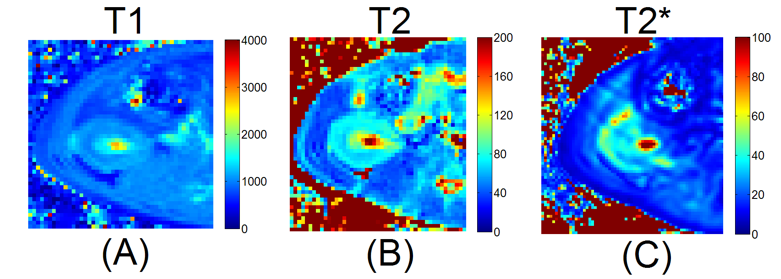
Figure 1 shows representative photomicrograph examples of PAS-stained glomerulus. The fibrotic glomerulus showed significantly more ECM area than the healthy one. Figure 2 shows maps of T1, T2, and T2* from a same rat. In the maps of T1 and T2, different renal regions can be visually differentiated. We did notice significant susceptibility artifact in T2* maps of multiple cases. Table 1 lists the values of the MRI parameters. With fibrosis, both T1 and T2 of renal cortex and medulla increased significantly, as compared to the healthy ones (P<0.001). T2* also increased in renal cortex (P = 0.043), but not significantly in medulla (P=0.205). In the reproducibility test, STD of the three independent estimates for T1 averaged at 72.3 ms (6%), for T2 4.6 ms (6%), and for T2* 4.1 ms (15-20%).Discussion
Glomerular fibrosis caused significant changes in tissue T1 and T2 of the rat kidneys. The changes in tissue T2* were not significant, which could be due to the susceptibility artifact or minimal change in tissue oxygenation. Even though the fibrosis was induced in glomeruli (i.e. cortex), medulla changes were found in both T1 and T2. The exact mechanism for this finding remains to be elucidated. We also found that even with a clinical MRI scanner, the measurements were relatively reproducible. With clinical MRI scanner, the findings with small animal studies can be easily translated to clinical applications.Acknowledgements
No acknowledgement found.References
1. Zhang JL, Morrell G, Rusinek H, Sigmund EE, Chandarana H, Lerman LO, Prasad PV, Niles D, Artz N, Fain S, Vivier PH, Cheung AK, Lee VS. New magnetic resonance imaging methods in nephrology. Kidney Int 85: 768–778, 2014
2. Conlin CC, Huang Y, Gordon BAJ, Zhang JL. Quantitative characterization of glomerular fibrosis with magnetic resonance imaging: a feasibility study in a rat glomerulonephritis model. Am J Physiol Renal Physiol 314: F747–F752, 2018
3. Bagchus WM, Hoedemaeker PJ, Rozing J, Bakker WW. Glomerulo- nephritis induced by monoclonal anti-Thy 1.1 antibodies. A sequential histological and ultrastructural study in the rat. Lab Invest 55: 680–687, 1986.
4. Zhang J, Gu C, Noble NA, Border WA, Huang Y. Combining angio- tensin II blockade and renin receptor inhibition results in enhanced antifibrotic effect in experimental nephritis. Am J Physiol Renal Physiol 301: F723–F732, 2011
Figures