1908
Small field of view 2D spatially selective RF excitation diffusion tensor (DTI) imaging of the kidneys: initial experience in healthy controls and patients with Type 2 diabetes1Austin Health, Heidelberg, Australia, 2The University Melbourne, Melbourne, Australia, 3The Florey Institute of Neuroscience and Mental Health, Melbourne, Australia, 4Siemens Healthcare Pty Ltd, Melbourne, Australia, 5New York University School of Medicine, New York, NY, United States
Synopsis
Fractional anisotropy (FA) and mean diffusivity (MD) derived from diffusion tensor imaging (DTI) are promising for assessing subclinical changes in diabetic kidney disease (DKD). However, renal echo planar DTI can be challenging due to susceptibility artefacts, which can be mitigated by a small field of view (FOV) 2D spatially selective RF excitation. We report initial experience at 3T in 9 controls and 4 diabetic patients, finding high inter-reader agreement for cortical and medullary FA and MD, and significantly lower medullary and cortical FA in patients compared to controls. Small FOV DTI is a feasible non-invasive method of DKD assessment/ monitoring.
PURPOSE
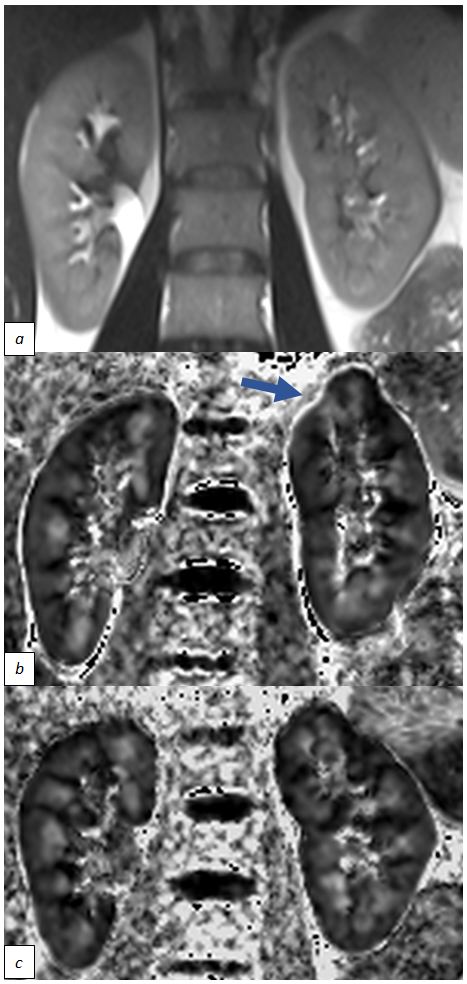
Traditional clinical markers of renal function decline (albuminuria, declining estimated glomerular filtration rate [eGFR]) are unreliable in early diabetic kidney disease (DKD)1. Increased cortical fractional anisotropy (cFA), decreased medullary fractional anisotropy (mFA) and decreased cortical and medullary mean diffusivity (cMD/ mMD) have been reported using diffusion tensor imaging (DTI) in people with type 2 diabetes (T2DM), including those with normal renal function2,3,4. These changes may reflect disruption of renal architecture, offering a potential non-invasive biomarker for early kidney disease3,4,5. Susceptibility artifact from adjacent gas-filled structures, particularly at 3T and with echo planar imaging (EPI), may impact accuracy of DTI metrics (Figure 1). Small field of view (FOV) imaging with two-dimensional spatially selective radiofrequency pulses offers a means to mitigate distortion from susceptibility artefact and image blur6. This study aims to assess feasibility, inter-reader agreement of derived cFA, mFA, cMD, mMD values of small FOV EPI DTI and to assess differences in healthy controls and T2DM patients.METHOD
4 T2DM patients (2M, 2F, range 64-77 years) with Chronic Kidney disease (CKD) Stage 1-3a (eGFRs 58, 79, 85 and >90 ml/min/1.73m2) and 9 healthy controls (1M, 8F, mean 40 years, eGFR >90 ml/min/1.73m2) were prospectively recruited and imaged using a 3T MRI system (MAGNETOM Skyra, Siemens Healthcare, Erlangen, Germany) equipped with a 60-channel body array coil. Respiratory-triggered DTI was performed with a small field of view (FOV) EPI sequence (ZOOMit, Siemens Healthcare, Erlangen, Germany): TR/TE/ES = 3000/74 /0.75 ms, FA = 90°, FOV = 240 x 192 mm2, matrix size = 90 x 72, slice thickness = 5 mm, 5 slices, b = 0, 150 and 500 s/mm2 (1/1/3 averages), 12 directions, parallel imaging (GRAPPA, R = 2, separate calibration scan), typical TA 4 min. Anatomic T2-weighted (HASTE) images were also obtained for reference: TR/TE 1000/95ms, FA 114°, FOV = 350 x 328 mm2, matrix size = 256 x240, sl 5mm, 17 slices, TA 17s.
Motion correction5 was performed using FireVoxel (NYUMC, NY), and FA and MD maps were created with 3D Slicer7 non-product software. Two radiologists blinded to subject identity independently scored FA map corticomedullary differentiation on a 4-point scale (1=poor, 4=excellent) and drew at least 6 cortical and medullary regions of interest (ROIs) per kidney on FA and MD maps avoiding cysts, vessels and artifacts5. Average FA and MD values were derived for each kidney compartment.
Inter-reader agreement for FA and MD was assessed using Lin’s concordance correlation coefficient (LCCC), reference ranges as described by Landis and Koch8. Volunteer and patient group differences and concordance between eGFR and FA/MD were compared with random intercept regression analysis, with p<0.05 considered statistically significant.
RESULTS
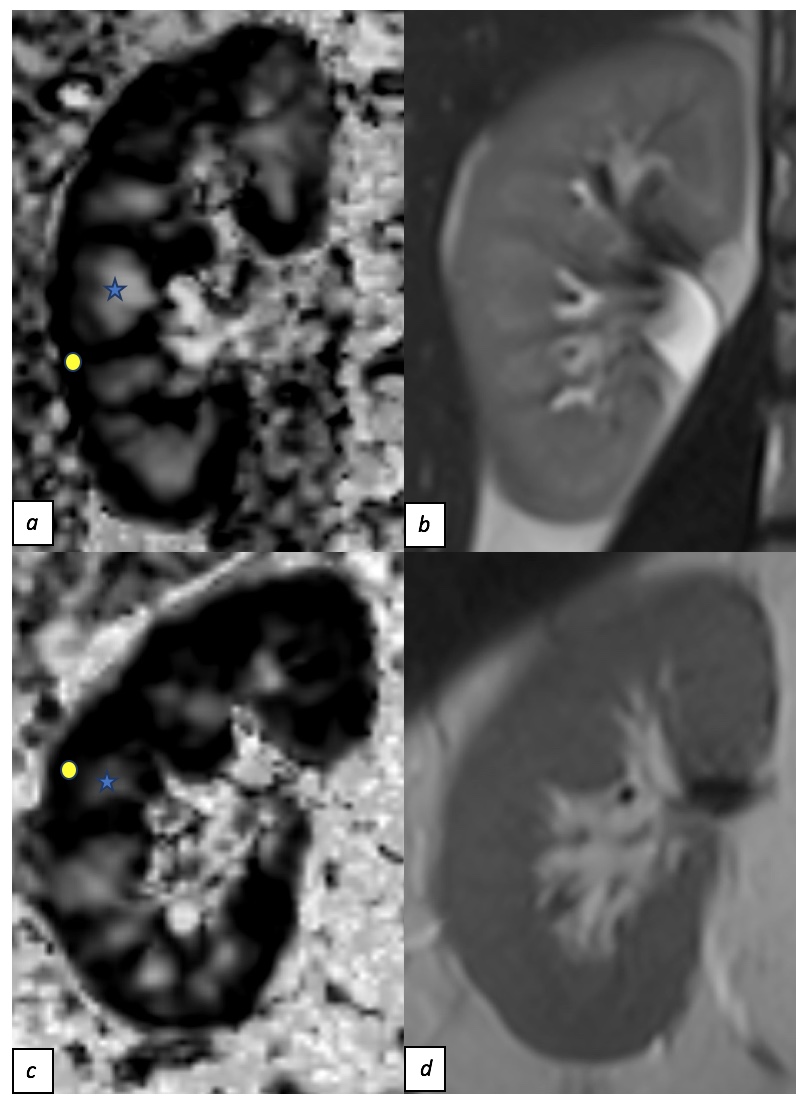
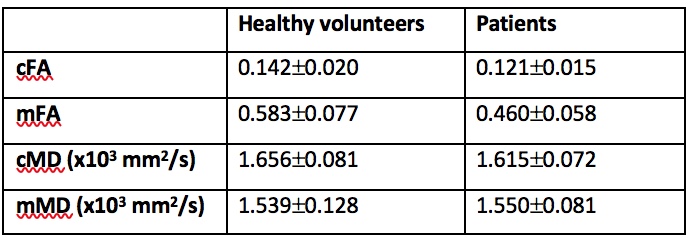
All subjects successfully completed DTI imaging with representative images in Figure 2. Mean values for cFA, mFA, cMD and mMD are summarised in Table 1.
Mean (SD) corticomedullary differentiation scores of all subjects was 2.7±1.0, with lower scores for patients (2.1±1.2) versus volunteers (3.0±0.8).
There was substantial inter-reader agreement for cFA and mFA (LCCC 0.76 and 0.74 respectively), and almost perfect agreement for cMD and mMD (LCCC 0.89 and 0.93 respectively)8.
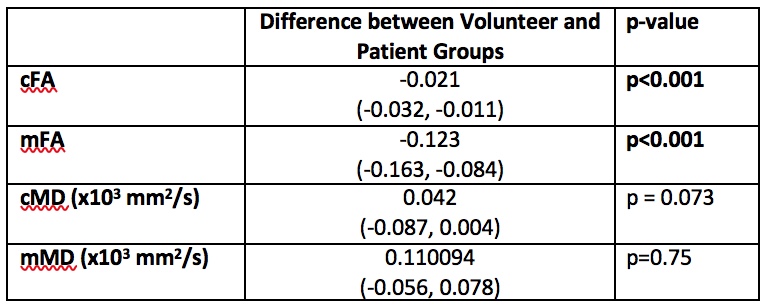
Random intercept regression analysis comparing volunteer and patient groups demonstrated lower cFA and mFA in the patient group. The mean cFA value was 0.021 (95% CI 0.032 – 0.011) lower in patients (p < 0.001). The mean mFA was 0.123 (95% CI 0.163 – 0.084) lower in patients (p<0.001). No significant difference was found between cMD and mMD between the two groups (Table 2).
A small but significant association between mFA and eGFR was observed, with a 0.027 (95%CI 0.002 – 0.053) decrease in FA for every 10 ml/min/1.73m2 decrease in eGFR (p<0.001). No significant relationship between eGFR and cFA, cMD or mMD was observed.
DISCUSSION/CONCLUSION
Small FOV renal DTI is feasible with high inter-reader agreement for FA and MD. Although our conclusions are limited by small sample size, reduced corticomedullary differentiation and significantly lower medullary FA were demonstrated in people with T2DM compared to healthy controls and lower medullary FA associated with lower eGFR, in line with previous literature2. Slightly but significantly lower cortical FA was found in T2DM compared to normal healthy controls, differing to the experience of Razek et al3 who found increased cortical FA in disease. This may relate to small sample size of the current study, group-level differences other than T2DM, or differences in image acquisition/ analysis, with additional image registration performed in the current study. Overall, results of small FOV renal DTI are encouraging for non-invasive assessment and monitoring of DKD. Further validation of these findings in a larger population is planned.Acknowledgements
This work was supported by funding from the Royal Australian and New Zealand College of Radiologists.References
1. Reutens, A. T. (2013). Epidemiology of Diabetic Kidney Disease. Med Clin N Am, 1-18.
2. Lu, L., Sedor, J. R., Gulani, V., Schelling, J. R., et al., (2011). Use of Diffusion Tensor MRI to Identify Early Changes in Diabetic Nephropathy. Am J Nephrol, 476-482.
3. Razek, A. A., Al-Adlany, M. A., Alhadidy, A. M., Atwa, M. A., & Abdou, N. E. (2016). Diffusion tensor imaging of the renal cortex: correlation with urinary and serum biomarkers. Abdominal Radiology, 1493-1500.
4. Chen, X., Xiao, W., Li, X., He, J., et al., (2014). In vivo evaluation of renal function using diffusion weighted imaging and diffusion tensor imaging in type 2 diabetics with normoalbuminuria versus microalbuminuria. Front. Med, 471-476.
5. Caroli, A., Schneider, M., Friedli, I., Ljimani, A., et al., (2018). Diffusion-weighted magnetic resonance imaging to assess diffuse renal pathology: a systematic review and statement paper. Nephrol Dial Transplant, ii29-ii40.
6. He, Y.-L., Hausmann, D., Morelli, J. N., Attenberger, et al., (2016). Renal zoomed EPI-DWI with spatially-selective radiofrequency excitation pulses in two dimensions. European Journal of Radiology, 85, 1773-1777.
7. Fedorov, A., Beichel, R., Kalpathy-Cramer, K., Finet, et al., (2012). 3D Slicer as an Image Computing Platform for the Quantitative Imaging Network. Magn Reson Imaging, 1323-1341.
8. Landis, J. R., & Koch, G. G. (1977). The measurement of observer agreement for categorical data. Biometrics, 159-174.
Figures