1907
Effect of B0 shimming method and breath-holding position on the quantification of renal BOLD R2* in healthy volunteers1Sir Peter Mansfield Imaging Centre, University of Nottingham, Nottingham, United Kingdom
Synopsis
Tissue hypoxia is thought to play a key role in the development and progression of kidney disease. Blood oxygenation level-dependent (BOLD) MRI based on the absolute transverse relaxation rate (R2*) is widely used to assess renal tissue oxygenation. This study shows that breath-hold location (inspiration/expiration) and B0 shimming method (default/volume) can influence the quantification of renal R2* mapping. By using associated B0 mapping data it is possible to determine outliers in R2* arising from significant left-right B0 gradients/B0 offsets/large B0 FWHM, thus reducing the variance in quantified renal R2* values across a subject group.
PURPOSE:
Tissue hypoxia is thought to play a key role in the development and progression of kidney disease. Blood oxygenation level-dependent (BOLD) MRI based on the absolute transverse relaxation rate (R2*) is widely used to assess renal tissue oxygenation1. Some studies demonstrate an increased renal cortex R2* in CKD patients compared to healthy controls2(e.g.23.2±6.3s-1 vs. 19.7±3.2s-1) suggesting lower tissue oxygenation3,4, whilst medulla R2* is unchanged. However, many studies have failed to detect this change. Recently it has been shown that adverse outcomes can be predicted by absolute R2*, whilst a furosemide-induced change in R2* is not a predictor5. However, absolute R2* is prone to macroscopic background magnetic field (B0) inhomogeneity due to susceptibility-induced fields generated within the body which alter over the respiratory cycle6,7 and can differ between shimming methods. Previous studies have demonstrated that R2* is sensitive to dephasing due to local linear through-slice gradients (ΔB0) (corrected based on ΔB08,9,10) and concomitant gradient magnetic fields (minimised by coronal imaging near the magnet isocentre11). Here we evaluate the effect of breath-hold location and shimming method on B0 maps and the associated inter-subject variability in renal R2* measures.METHODS:
MR Acquisition: Data was collected on 10 subjects using a 3T Philips Ingenia scanner, magnitude and phase R2* data was acquired using a 12-echo mFFE scheme (TE/ΔTE=5/3ms, 1.5x1.5x5mm3, 5 coronal-oblique slices, 288x288mm FOV, FA 25o, SENSE2), and vendor B0-field maps using a dual-echo GRE (TR=9.5ms, TE/ΔTE=4/3ms, 2.5x2.5x6mm3, 400x400FOV, 17 slices, FA=3o, SENSE2). R2* and B0 maps were each collected for ‘default’ (whole FOV) and ‘volume’ (covering both kidneys) based shimming within a single expiration/inspiration breath-hold.
Data Analysis: mFFE data was fit voxel-wise to compute R2* maps using a log-linear fit (MATLAB). The kidney was manually segmented from the 1st echo and cortex/medulla masks created by thresholding based on average signal intensity across echoes, and masks applied to B0 maps. Histogram analysis was used to compute the mode and FWHM of cortex R2* and B0. From the B0 maps, the through-slice and left-right(L-R) B0 gradient was computed.
RESULTS
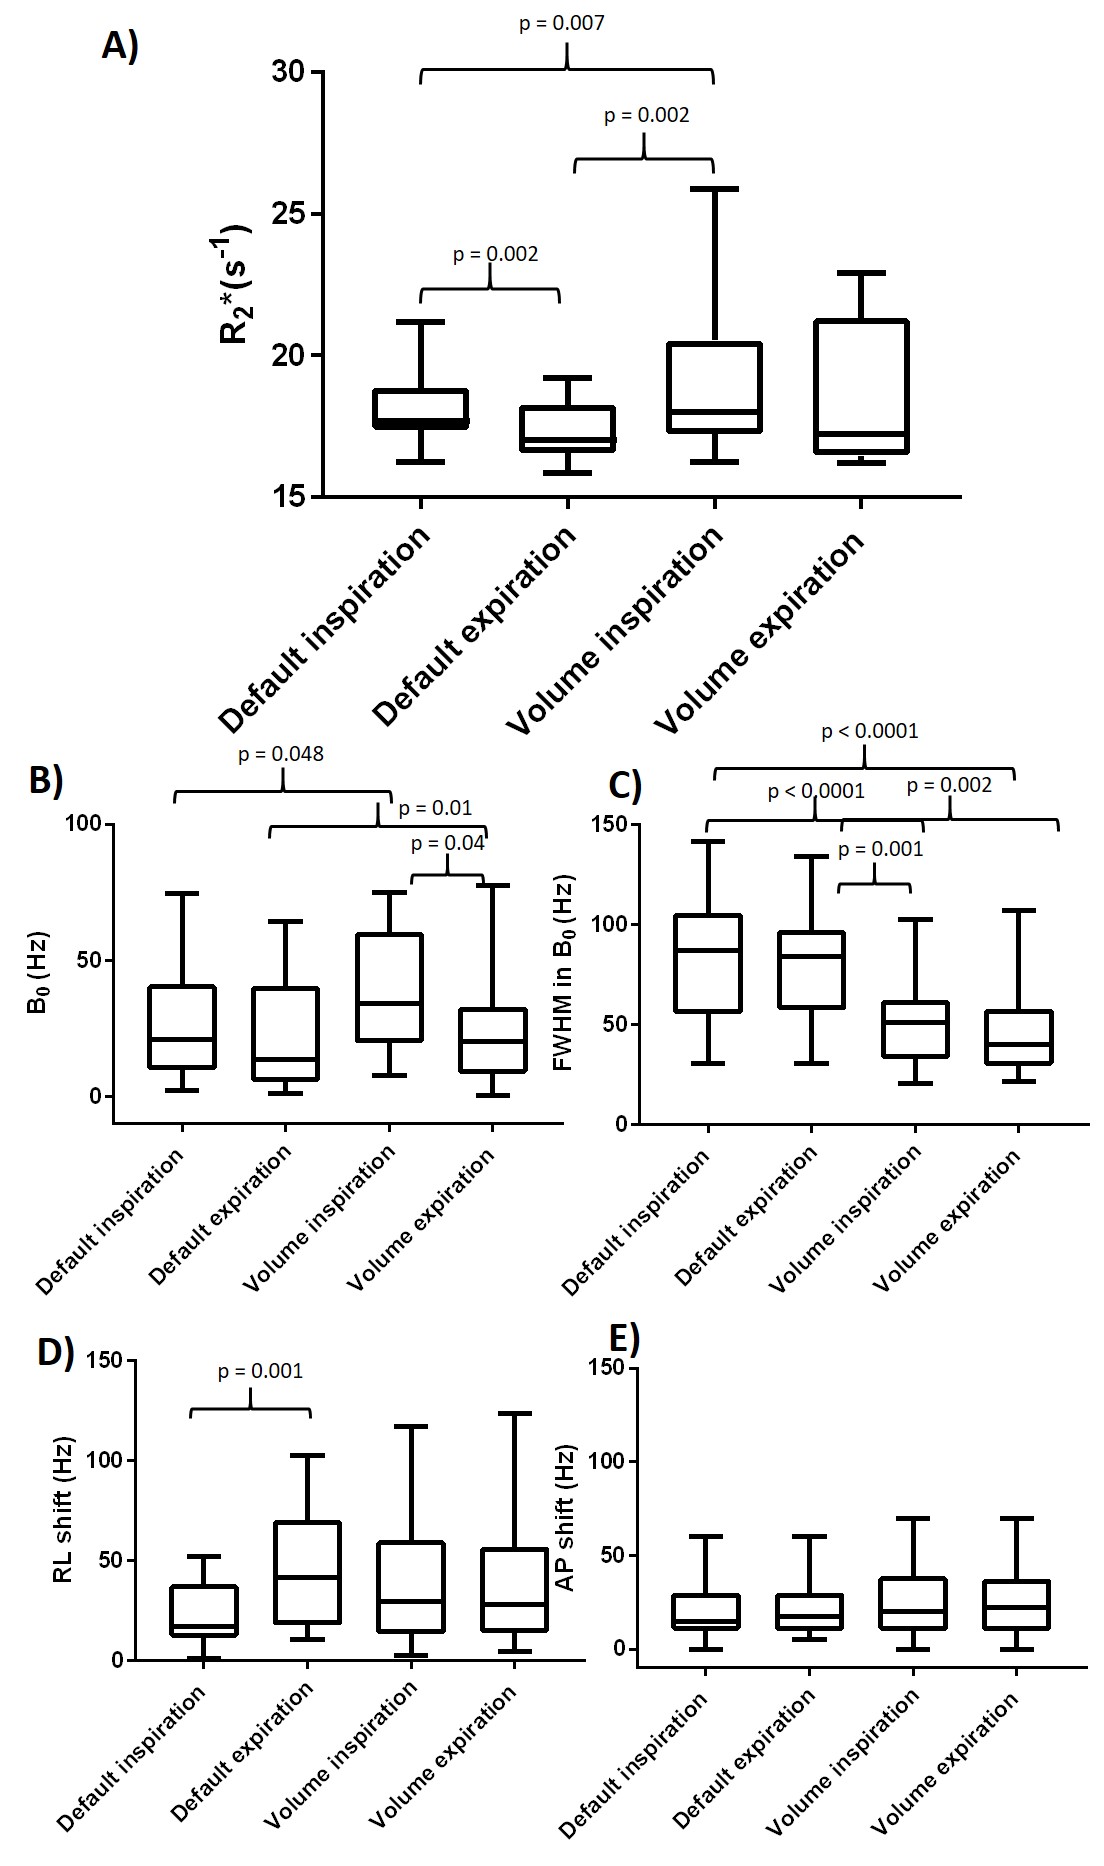
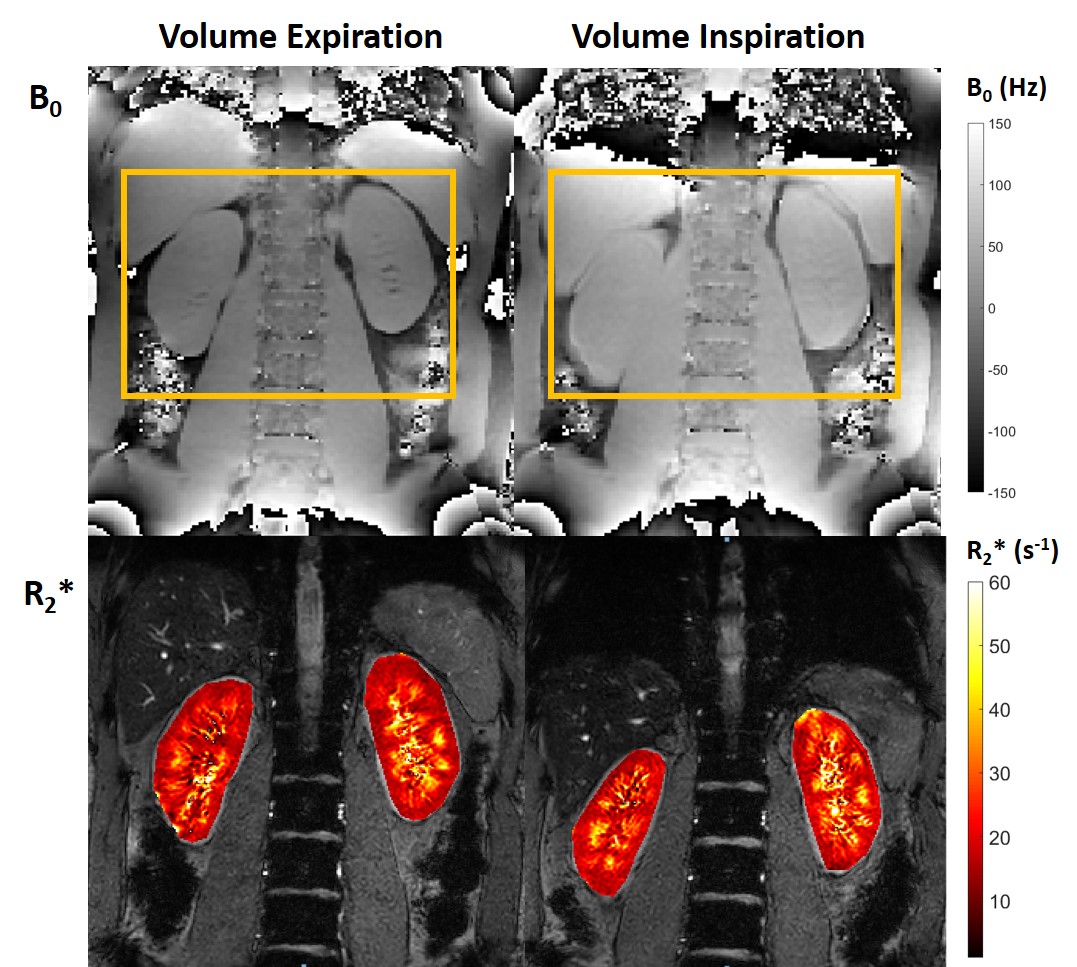
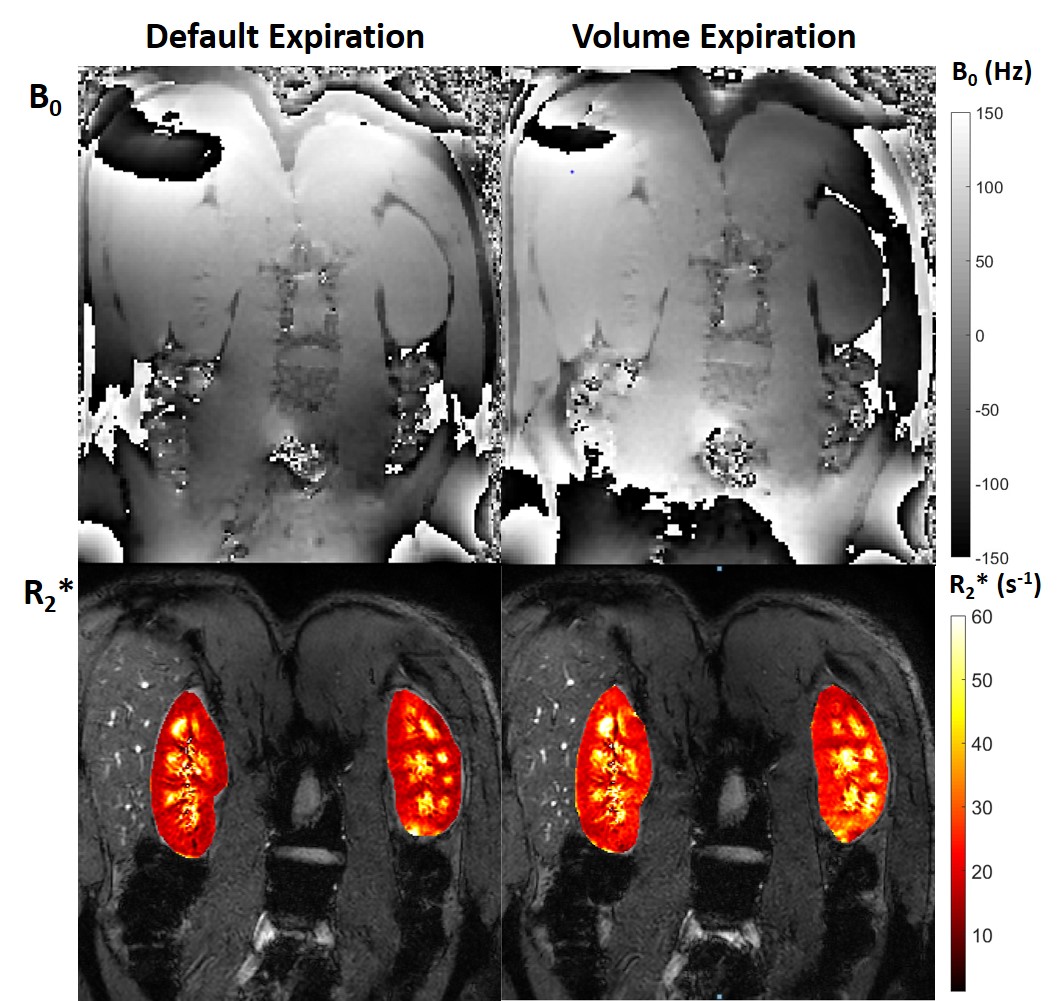
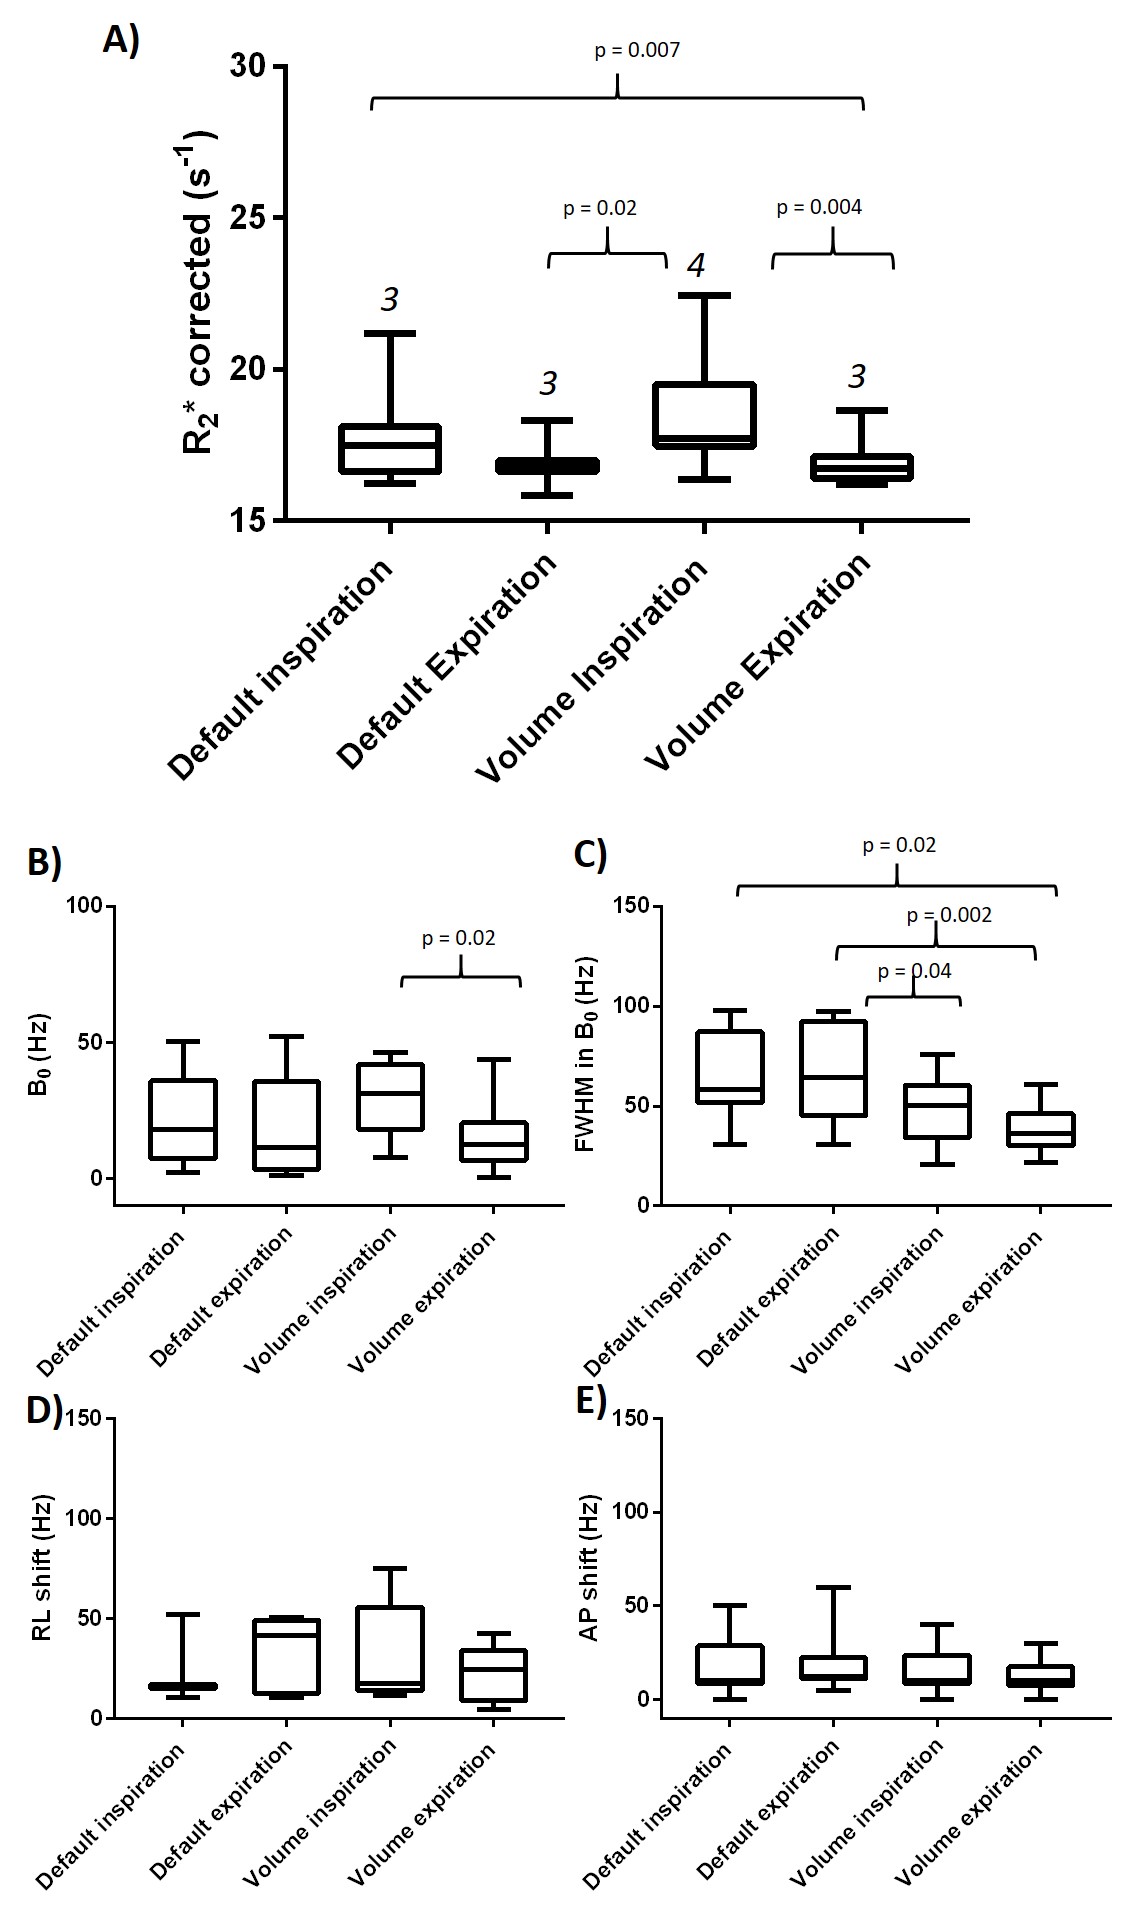
Figure 1A shows the effect of breath-hold position and shimming method on calculated renal cortex R2*. Cortex R2* has the highest value and variance for volume inspiration (median:18.0s-1,IQR:3.3) and lowest for default expiration (median:17.0s-1,IQR:1.7), with default shimming dependent on breath-hold position (a higher R2* for inspiration than expiration with an average shift in kidney position of 25±9mm between inspiration and expiration). The largest B0 offset was for volume inspiration (Fig.1B), whilst B0 FWHM was greatest for default shimming (Fig. 1C), as expected. There was a large variability in the B0L-R gradient (Fig. 1D), but not in B0 through-slice gradient (thus this was not corrected8,9,10) (Fig. 1E). There was a significant bias for R2* to be higher in left than right kidney for default shimming (p =0.007). Figure 2 shows example B0 and R2* maps indicating the differences between inspiration and expiration breath-holds, and Figure 3 shows the effect of a significant B0L-R gradient on R2* maps. To evaluate whether variations in B0 maps can explain the underlying variance in renal R2*, any subjects with a B0L-R gradient >50 Hz, B0 offset > 60 Hz or B0 FWHM >100Hz were removed, the resulting distribution of R2* values, and associated B0 field values are given in Figure 4. Volume and default expiration yield the lowest R2* with low variance.DISCUSSION:
We show that changes in breath-hold and B0 shimming method can influence resultant quantification of R2* mapping. By using the B0 mapping data it is possible to determine any outliers in the dataset due to either large B0L-R gradients (due to susceptibility of the heart, lungs, and liver12), B0 offsets or large B0 FWHM, this reduces the variance such that default and volume shimming methods yield comparable results for expiration. Importantly, if R2* data is collected with both magnitude and phase, B0 maps can be computed directly from the phase data of the first 2 echo times, reflecting underlying B0 variability of the R2* maps.CONCLUSION:
Non-renal factors can influence the absolute renal R2* values, and may underlie some of the variability in reported changes in R2* values in renal disease. This is important for studies of absolute R2* in kidneys and especially needs to be considered for comparisons across sites/scanners. B0 mapping together with R2* mapping is recommended. In future we will also assess how renal R2* slope is dependent on breath-hold location and shimming method, as this has been suggested to be less sensitive to macroscopic B0 inhomogeneity4.Acknowledgements
No acknowledgement found.References
1. Prujim M, Mendichovszky I et al. Renal blood oxygenation level-dependent magnetic resonance imaging to measure renal tissue oxygenation: a statement paper and systematic review. Nephrol Dial Transplant (2018) 33: ii22–ii28
2. Prasad PV, Thacker J, Li LP, Haque M, Li W, Koenigs H, Zhou Y, Sprague SM. Multi-Parametric Evaluation of Chronic Kidney Disease by MRI: A Preliminary Cross-Sectional Study. PLoS One. 2015 Oct 2;10(10):e0139661.
3. Prasad PV, Edelman RR, Epstein FH. Noninvasive evaluation of intrarenal oxygenation with BOLDMRI. Circulation 1996; 94: 3271–3275.
4. Li LP, Storey P, Pierchala L et al. Evaluation of the reproducibility of intrarenal R2* and DeltaR2* measurements following administration of furosemide and during waterload. JMagn Reson Imaging 2004; 19: 610–616.
5. Pruijm M, Milani B, Pivin E, Podhajska A, Vogt B, Stuber M, Burnier M. Reduced cortical oxygenation predicts a progressive decline of renal function in patients with chronic kidney disease. Kidney International (2018) 93, 932–940.
6. Gelderen P, Zwart JA, Starewicz P, Hinks RS, Duyn JH. Real-Time Shimming to Compensate for Respiration Induced B0 Fluctuations. Magnetic Resonance in Medicine 57:362–368 (2007)
7. Vannesjo SJ, Miller KL, Clare S, Tracey I. Spatiotemporal characterization of breathing-induced B0 field fluctuations in the cervical spinal cord at 7T. NeuroImage 167 (2018) 191–202.
8. Dahnke H1, Schaeffter T. Limits of detection of SPIO at 3.0 T using T2 relaxometry. Magn Reson Med. 2005 May;53(5):1202-6.
9. Hernando D, Vigen KK, Shimakawa A, Reeder S, R*2 Mapping in the Presence of Macroscopic B0 Field Variations. Magn Reson Med. 2012 September ; 68(3): 830–840.
10. Peters AM, Brookes MJ, Hoogenraad FG, Gowland PA, Francis ST, Morris PG, Bowtell R. T2* measurements in human brain at 1.5, 3 and 7 T. Magnetic Resonance Imaging 25 (2007) 748–753.
11. Hoffstetter LW, Morrell G et al. T2* Measurement Bias Due to Concomitant Gradient Fields. Magn Reson Med. 2017 April ; 77(4): 1562–1572.
12. Lee SK, Hancu I. Patient-to-Patient Variation of Susceptibility-Induced B0 Field in Bilateral Breast MRI. J. Magn. Reson. Imaging 2012;36:873–880.
Figures