1906
Optimization of an asymmetric spin echo EPI approach for oxygen extraction fraction measurement in the healthy kidney1GE Healthcare, Shanghai, China, 2GE Healthcare, Beijing, China
Synopsis
The noninvasive assessment of renal oxygenation is of great clinical interest. Some recent studies used a single shot asymmetric spin echo (ASE) EPI approach to measure oxygen extraction fraction (OEF) in the brain. Compared to the brain, the abdomen suffers much larger field inhomogeneity and respiration induced motion artifacts. The ASE EPI sequence was optimized by shifting the readout position rather than the 180° RF pulse to reduce TE and hence susceptibility artifacts for better OEF measurement in the kidney. OEF results were in good agreement with the normal range of about 30%, as reported in the previous literature.
Purpose
The noninvasive assessment of renal oxygenation is of great clinical interest
because abnormal tissue oxygenation is associated with common renal injuries, such
as ureteral obstruction and renal artery stenosis. The detection of renal oxygenation
alterations may enable earlier and more effective treatment. Some recent studies
used a single shot asymmetric spin echo (ASE) EPI approach to measure oxygen
consumption in the brain.1 The transverse MR signal decay in the
presence of a blood vessel network was model to calculate quantitative oxygen
extraction fraction (OEF), as proposed by Haacke and Yablonskiy.2
However, the ASE EPI method has not been evaluated in the abdomen due to
several considerations. Compared to the
brain, the abdomen suffers much larger field inhomogeneity caused by different types
of tissues. The kidney is also more subject to respiration induced motion
artifacts. In this study, we optimized the ASE EPI sequence for better
measuring the OEF in the kidney and performed the feasibility study on healthy
volunteers.Methods
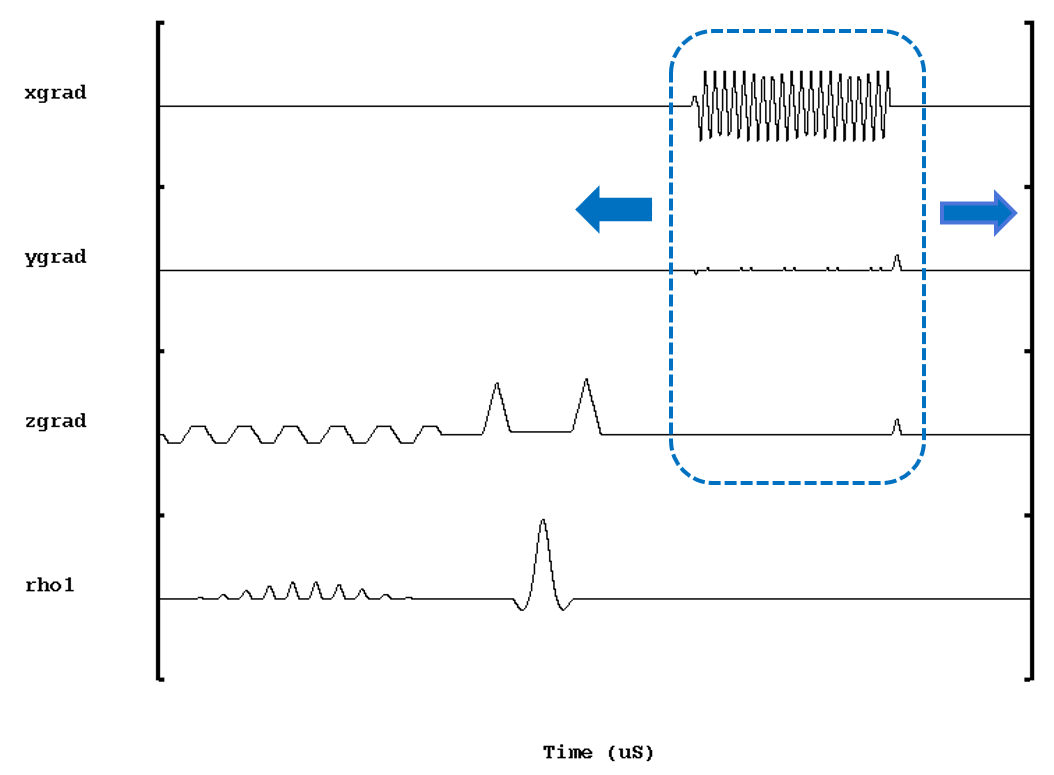
Five healthy volunteers (age 39-45 years old, one female) gave written informed consent to participate in the study. All MRI scans were performed on a 3.0-T MR750 scanner (GE Healthcare, Milwaukee, USA) using an 8-channel phase array torso coil. Instead of shifting 180° RF pulse in the previous approach, the optimized ASE EPI sequence kept the constant position of 180° RF pulse but shifted the position of the readout pulse to reduce TE and hence the susceptibility artifacts in the abdomen (Fig. 1). Scan parameters were as follows: TR=2000ms, FOV=240mm, slice thickness/gap=4/0mm, acquisition matrix=64×64, multi-phase=6, TE=50, 70 (TEse), 90, 100, 110, 120ms, number of excitations=3. The total acquisition time was 1min to acquire 30 slices. Image post-processing started with a rigid-body registration to correct for respiration induced motion artifacts. The next step was to estimate reciprocal of reversible transverse relaxation rate R2’ and deoxygenated blood volume λ by fitting the acquired images to the model proposed by Haacke and Yablonskiy.2 The effect of R2(1/T2) was determined using the first and third echoes acquired symmetrically about the spin echo with the echo spacing equal to 20ms. After R2 was determined, R2’ was calculated using linear least-squares curve fitting with the last four offset echoes with the echo spacing equal to 10ms. Deoxygenated blood volume λ was calculated with the following relationship: λ=ln(Sextrapolated(TEse)/S(TEse)) (Eq.1), where the signal S(TEse) was the spin echo. The amplitude Sextrapolated(TEse) was the extrapolation to the second echo time according to the last four echoes. Then δω map could be calculated using: 𝛿𝜔=𝑅2′/λ (Eq.2). After that, OEF value was estimated using the following equation: 𝑂𝐸𝐹=𝛿𝜔/(𝛾∙4/3𝜋∙∆χ∙𝐻𝑐𝑡∙𝐵0) (Eq.3), where γ was the gyromagnetic ratio, Δχ represented the susceptibility difference between fully deoxygenated blood vs. fully oxygenated blood and Hct was the hematocrit value.Results
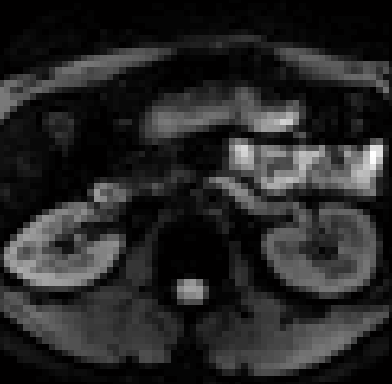
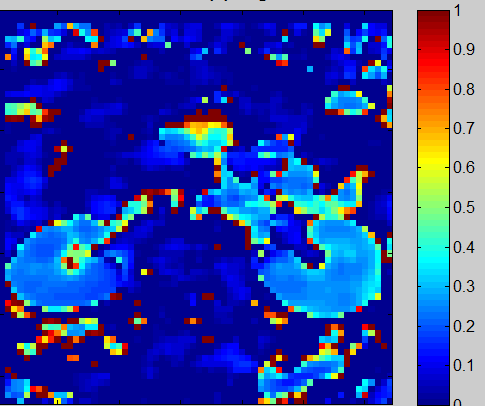
The raw ASE EPI image shows no noticeable susceptibility artifacts (Fig. 2). The motion artifacts caused by respiration were largely corrected by the rigid-body registration. Fig. 3 shows the corresponding OEF map and the calculated values are in good agreement with the normal range of about 30% as reported in the literature.1Discussion and Conclusion
ASE EPI has the potential to provide quantitative OEF maps for the kidney. These results hold promise for some clinical uses to monitor early changes in renal physiology and function. Further investigation is required to assess the sensitivity of OEF measurement in the disease situation.Acknowledgements
No acknowledgement found.References
1. An H, Lin W. Impact of intravascular signal on quantitative measures of cerebral oxygen extraction and blood volume under normo- and hypercapnic conditions using an asymmetric spin echo approach. Magn Reson Med. 2003;50:708–716.
2. Yablonskiy DA, Haacke EM. Theory of NMR signal behavior in magnetically inhomogeneous tissues: the static dephasing regime. Magn Reson Med. 1994;32:749–763.
Figures