1905
The Effects of Fixation and Age on Relaxometry Measurements of Ex-Vivo Kidneys1Sir Peter Mansfield Imaging Centre, The University of Nottingham, Nottingham, United Kingdom, 2Centre for Kidney Research and Innovation, The University of Nottingham, Nottingham, United Kingdom, 3School of Veterinary Medicine and Science, The University of Nottingham, Leicestershire, United Kingdom
Synopsis
The study of post-mortem brain tissue using MRI has been shown to provide a tool to assess whole organ microstructure and pathology with high spatial resolution. However, few studies have been performed on other organs in the body, here we perform ex-vivo imaging of whole kidneys. T1 and T2* of ex-vivo porcine kidneys are monitored over a ten-week period to study how T1 and T2* of the renal cortex and medulla vary over time from fixation. A clear understanding of the effects of fixation on tissue MRI parameters is crucial for interpreting ex-vivo MRI studies.
Purpose
Renal pathologies are currently assessed via biopsy followed by histological staining, this process is invasive and not representative of the entire kidney. Recently, multiparametric renal MRI protocols1 have been suggested to provide measures of underlying pathology2, for example longitudinal relaxation time (T1) and apparent diffusion coefficient (ADC) have been suggested to be markers of inflammation and fibrosis. Ex-vivo MRI can offer valuable quantitative measures for validating in-vivo MRI by comparing whole organ histology with high spatial-resolution and signal-to-noise ratio MRI data. By studying subjects who are undergoing a nephrectomy, the kidney can be scanned in-vivo, then upon removal the whole kidney can be scanned ex-vivo and biopsied for histology providing three complimentary streams of data. The study of post-mortem tissue samples has provided a better understanding of brain pathology from novel features of tissue architecture, relaxometry methods (T1,T2, and T2*), and diffusion tensor imaging (DTI)3–5. However most post-mortem studies involve immersion fixing with formalin. The effects of fixation on brain tissue has been reported6,7 but no literature is available on the effect of fixation on renal tissue. Here we characterize the changes of different MRI properties in the porcine kidney, whose renal anatomy is very similar to humans, to facilitate future ex-vivo relaxometry and DTI studies of the human kidney.Methods
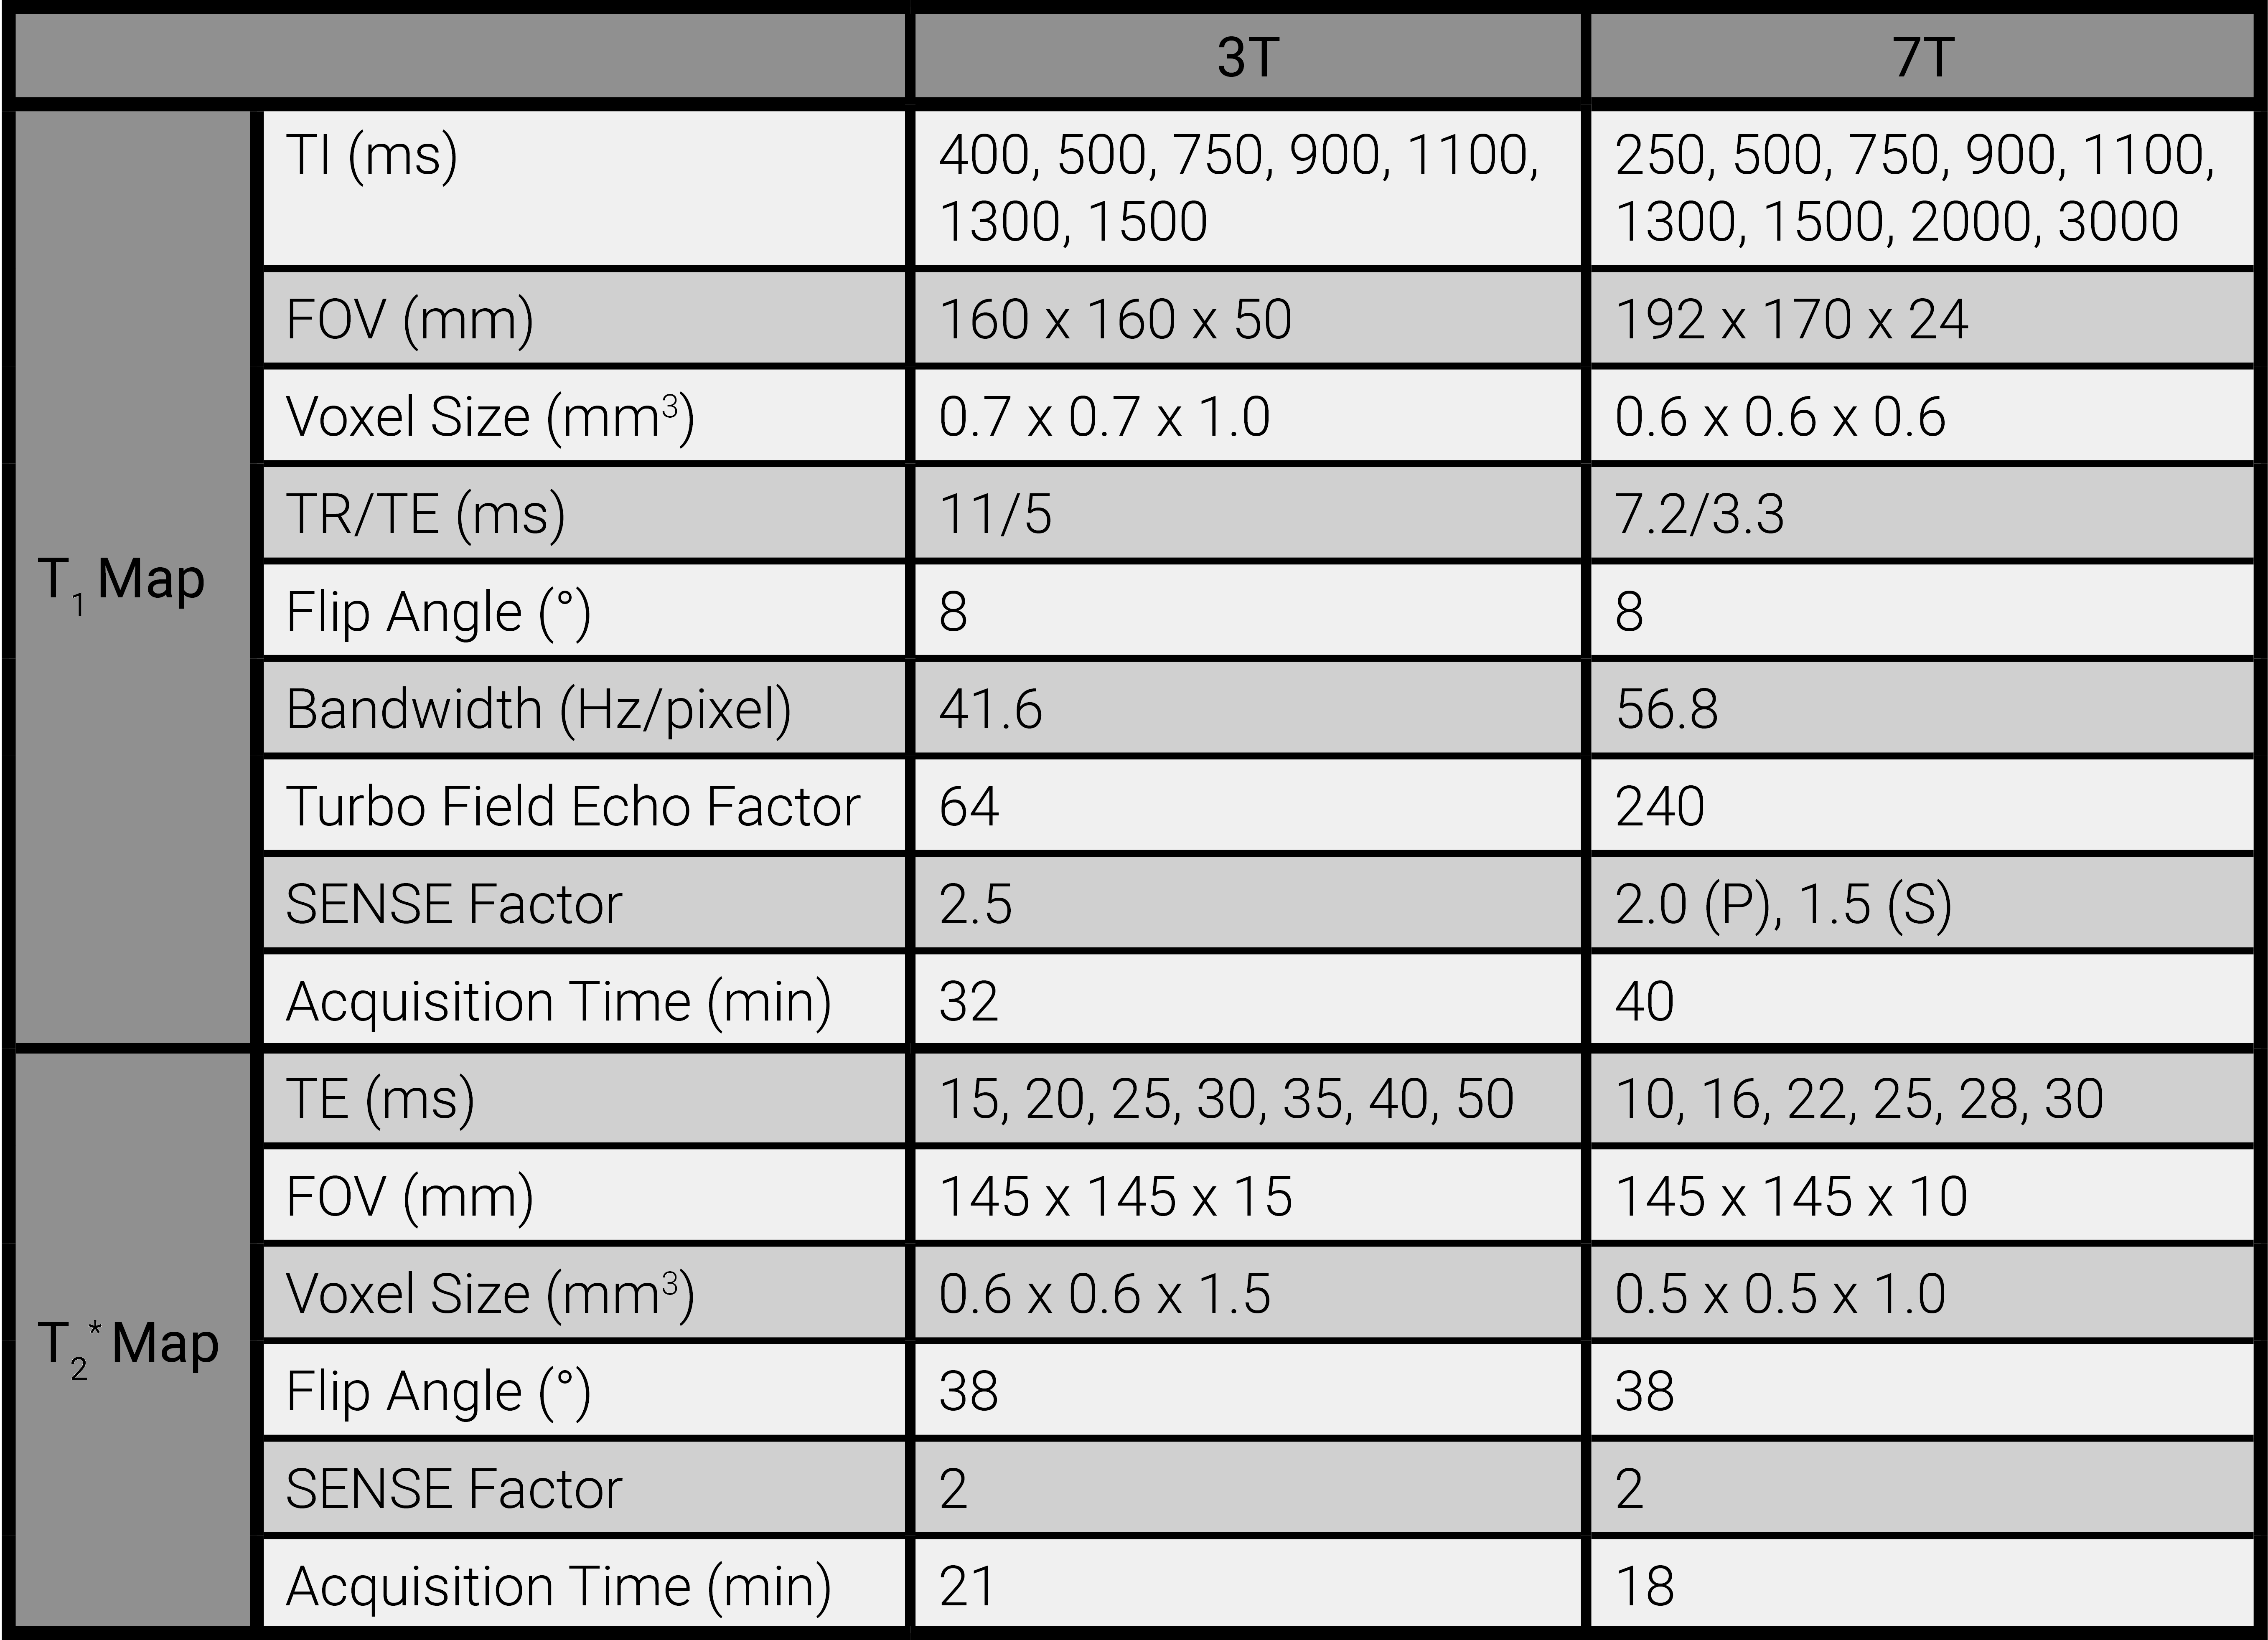
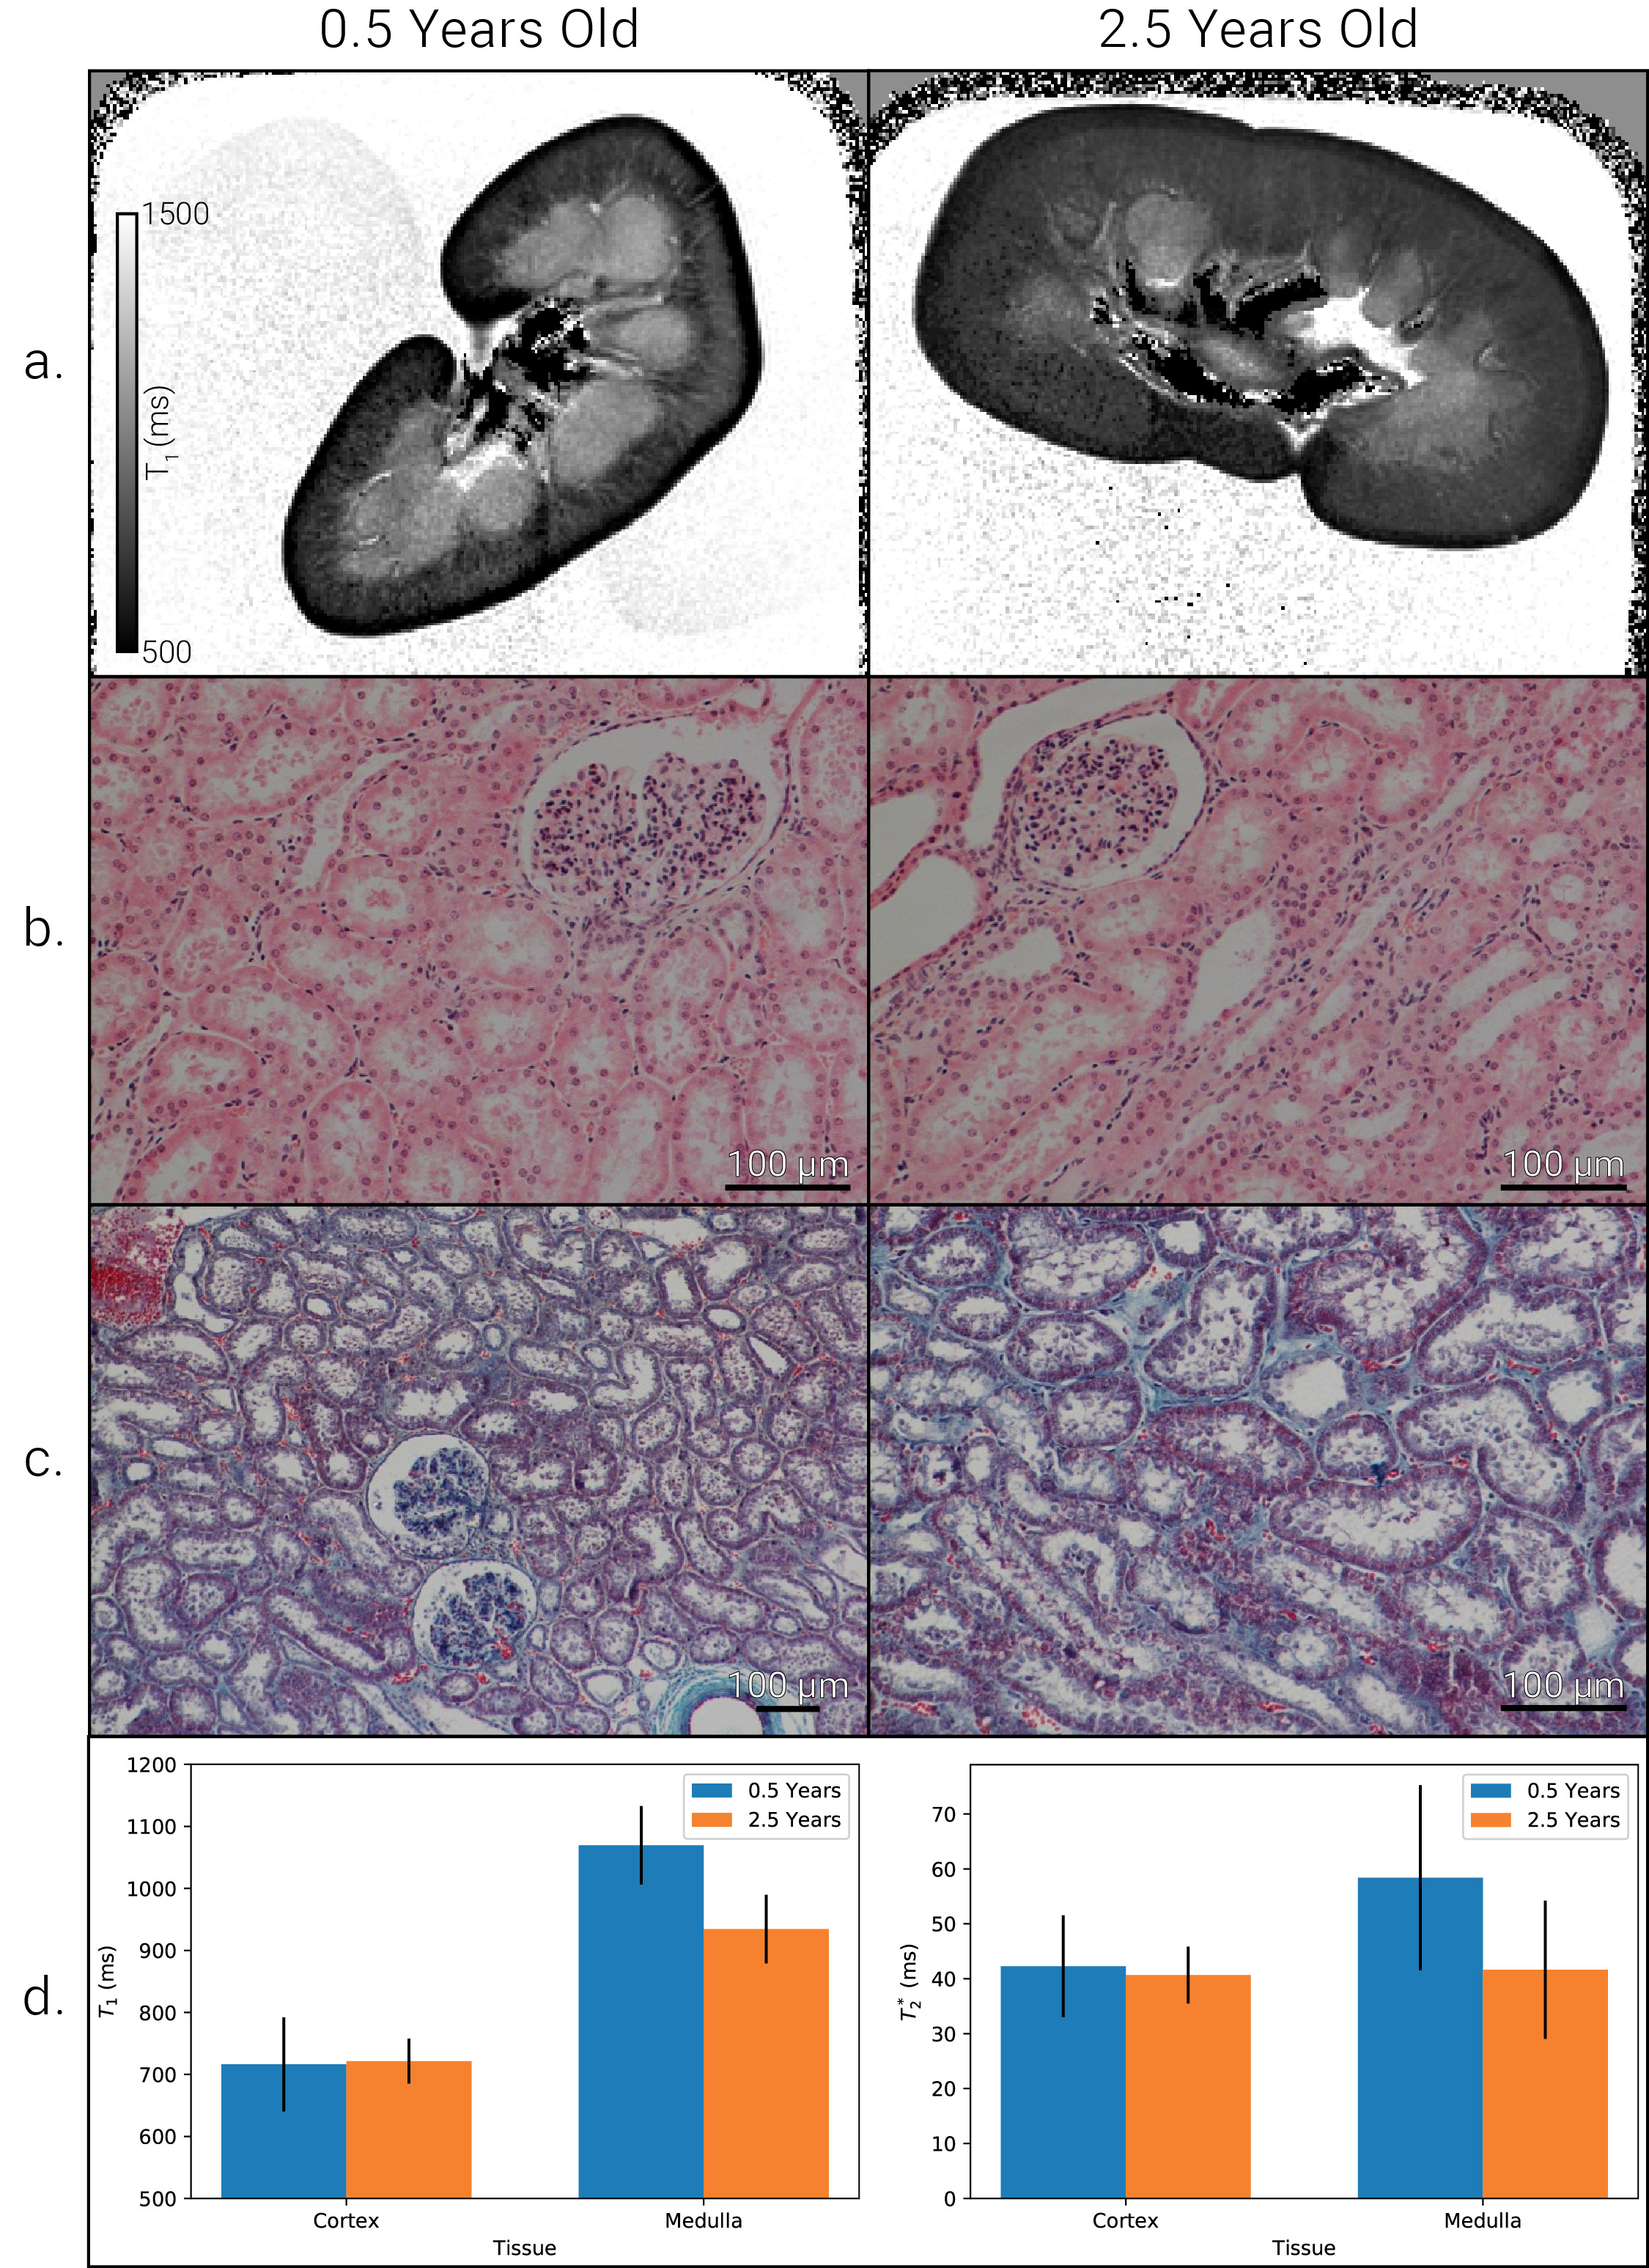
Data Acquisition: Whole porcine kidneys were fixed by placing them into ten-times their volume of 10% Neutral Buffered Formalin for 24-hours. They were then transferred to six times their volume of Phosphate-buffered Saline (PBS) to wash out excess formalin and rehydrate the kidneys8. To study the changes in T1 following removal from formalin, the kidneys were (i) scanned regularly over the first 24-hours in PBS, and (ii) scanned over a ten-week period in PBS. In addition, an unfixed kidney was scanned. Kidneys were scanned on both a 3T Philips Ingenia and 7T Philips Achieva to collect T1 and T2* relaxometry maps. T1 and T2* maps were generated using an ultrafast gradient echo scheme and a multi-shot FFE sequence respectively (Fig.1). To further study renal inflammation and fibrosis, known aged pigs were euthanized and kidneys scanned after 24-hours in PBS, and in addition histology was performed on the renal cortex using Haemotoxylin and Eosin (H&E) and Masson’s trichrome stains. To date kidneys have been collected from a 0.5-year and 2.5-year pig.
Data Analysis: T1 maps were formed by fitting the magnitude data corrected using the phase information9 on a voxel-by-voxel basis to an inversion recovery. T2* maps were generated by performing a weighted echo time fit from the log of the exponential signal decay. Once quantitative maps were made, regions of interest were defined for renal cortex and medulla.
Results
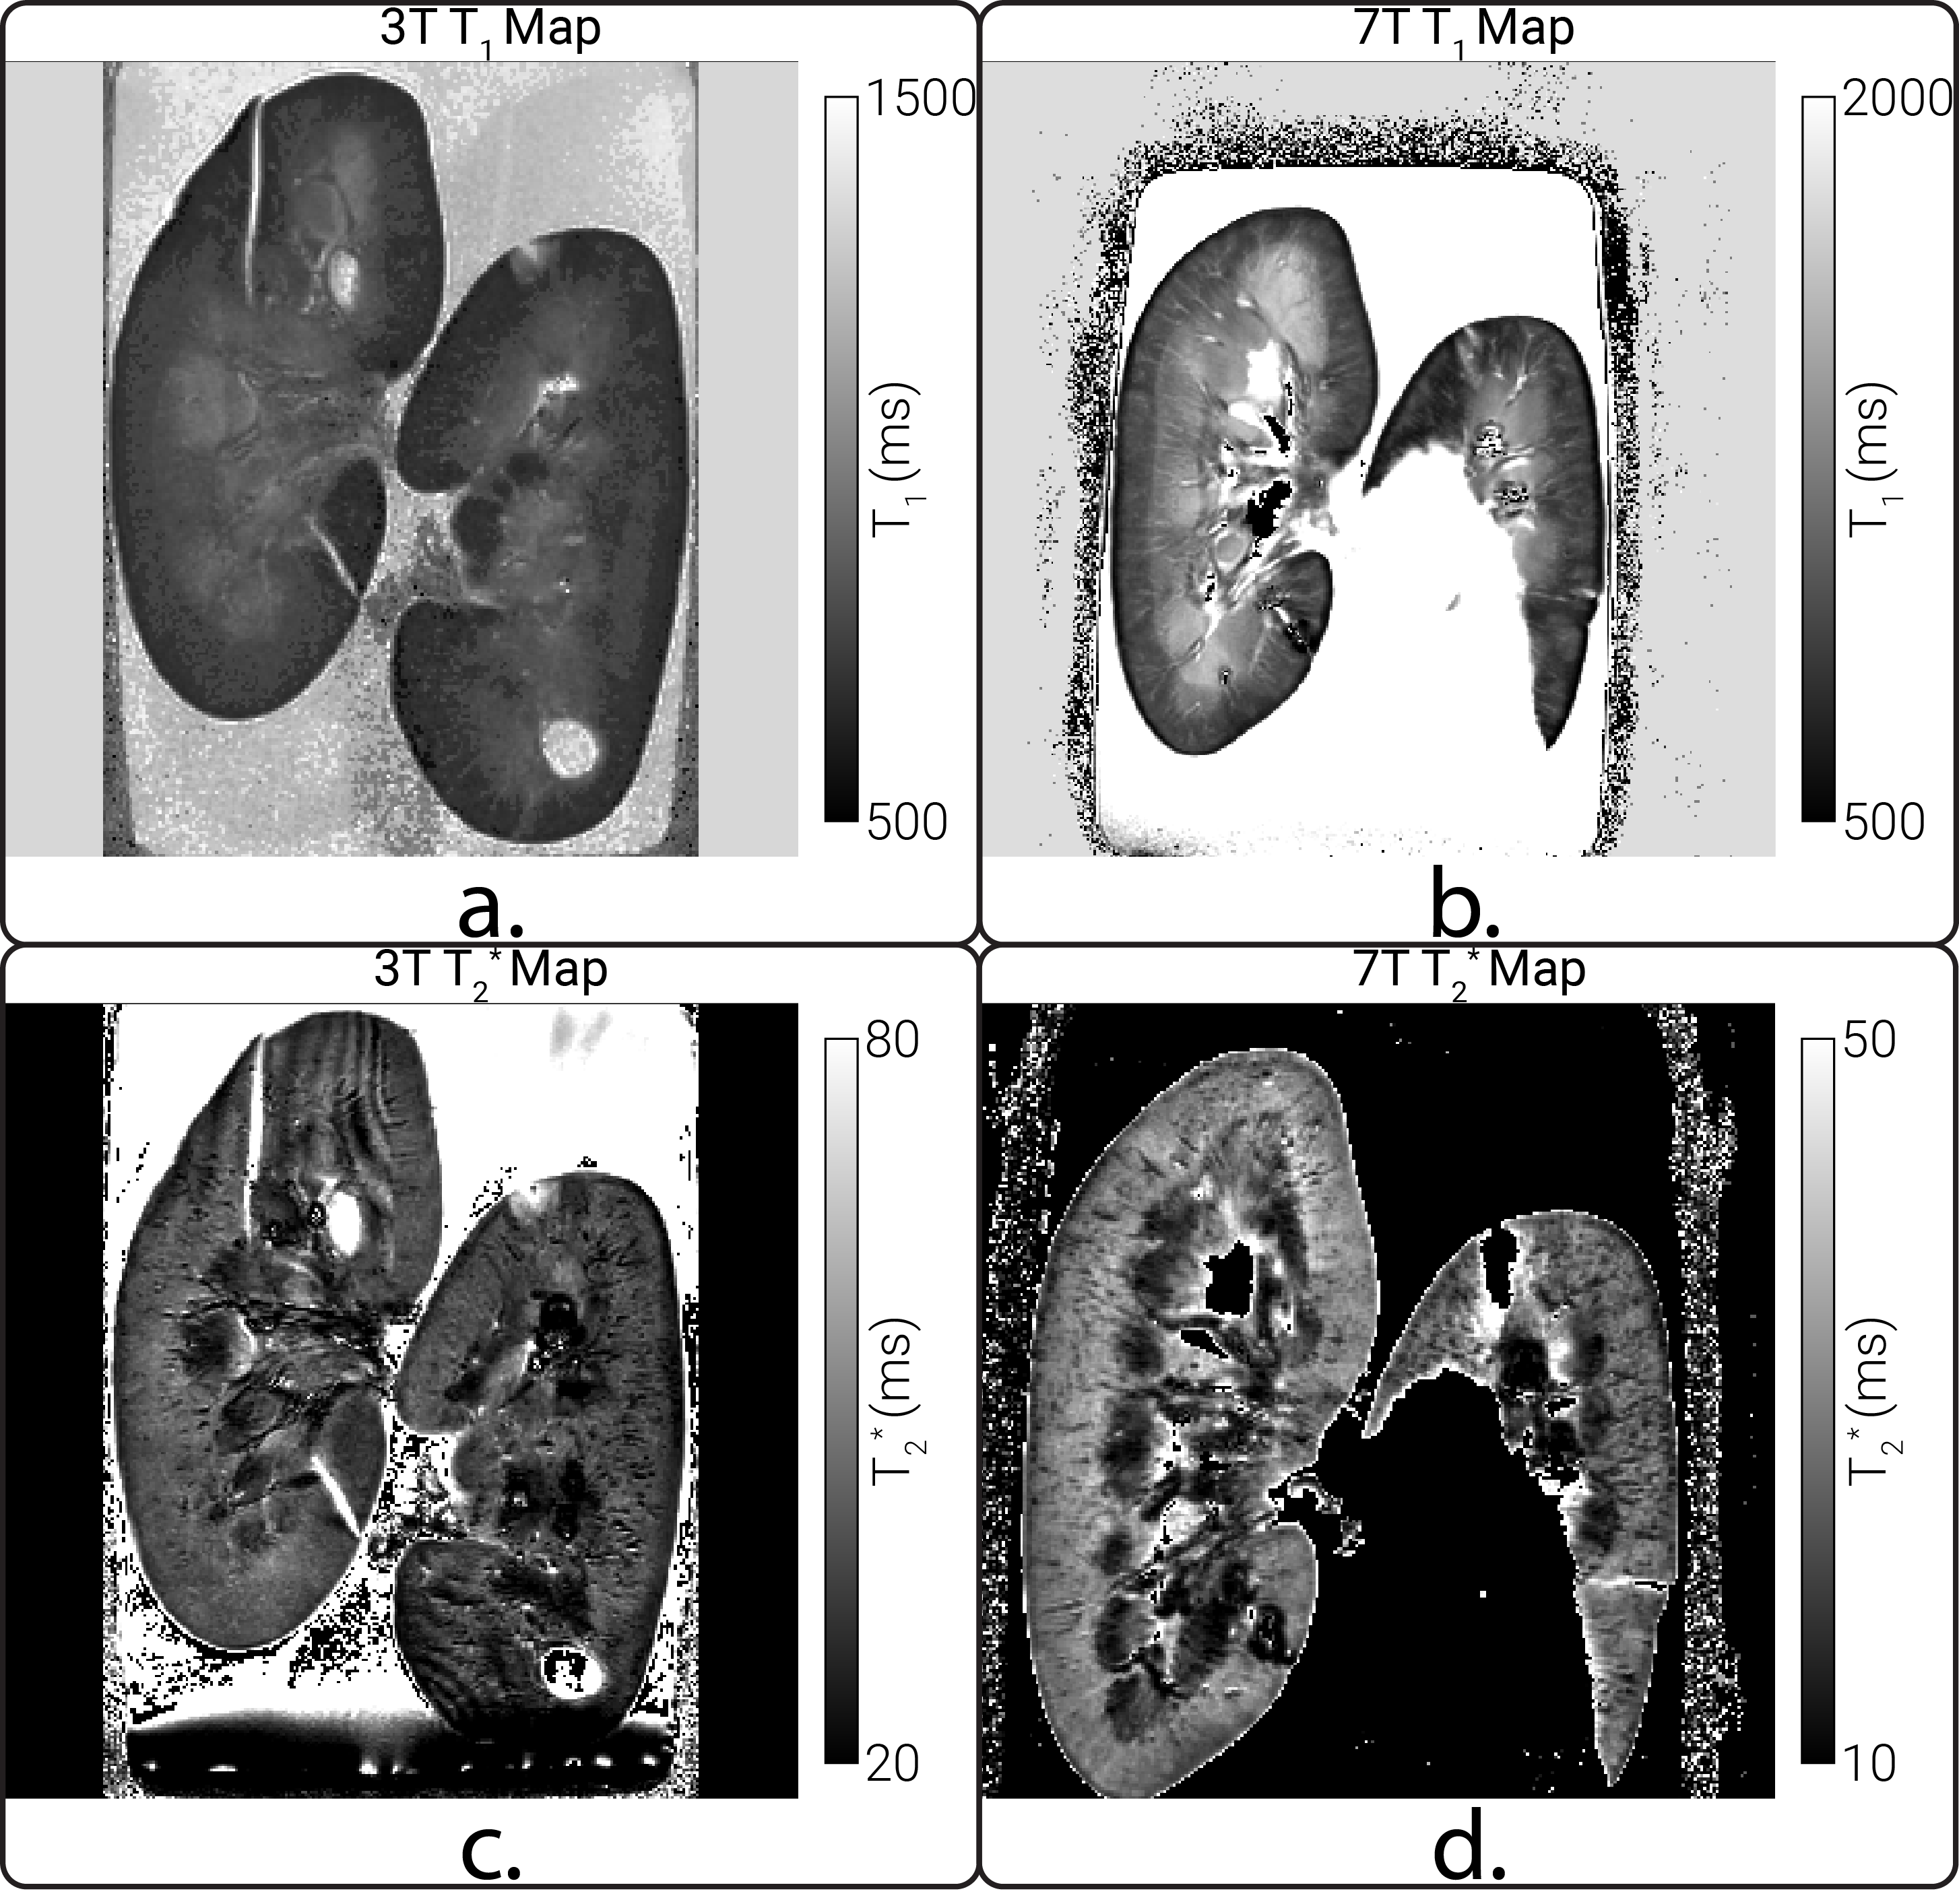
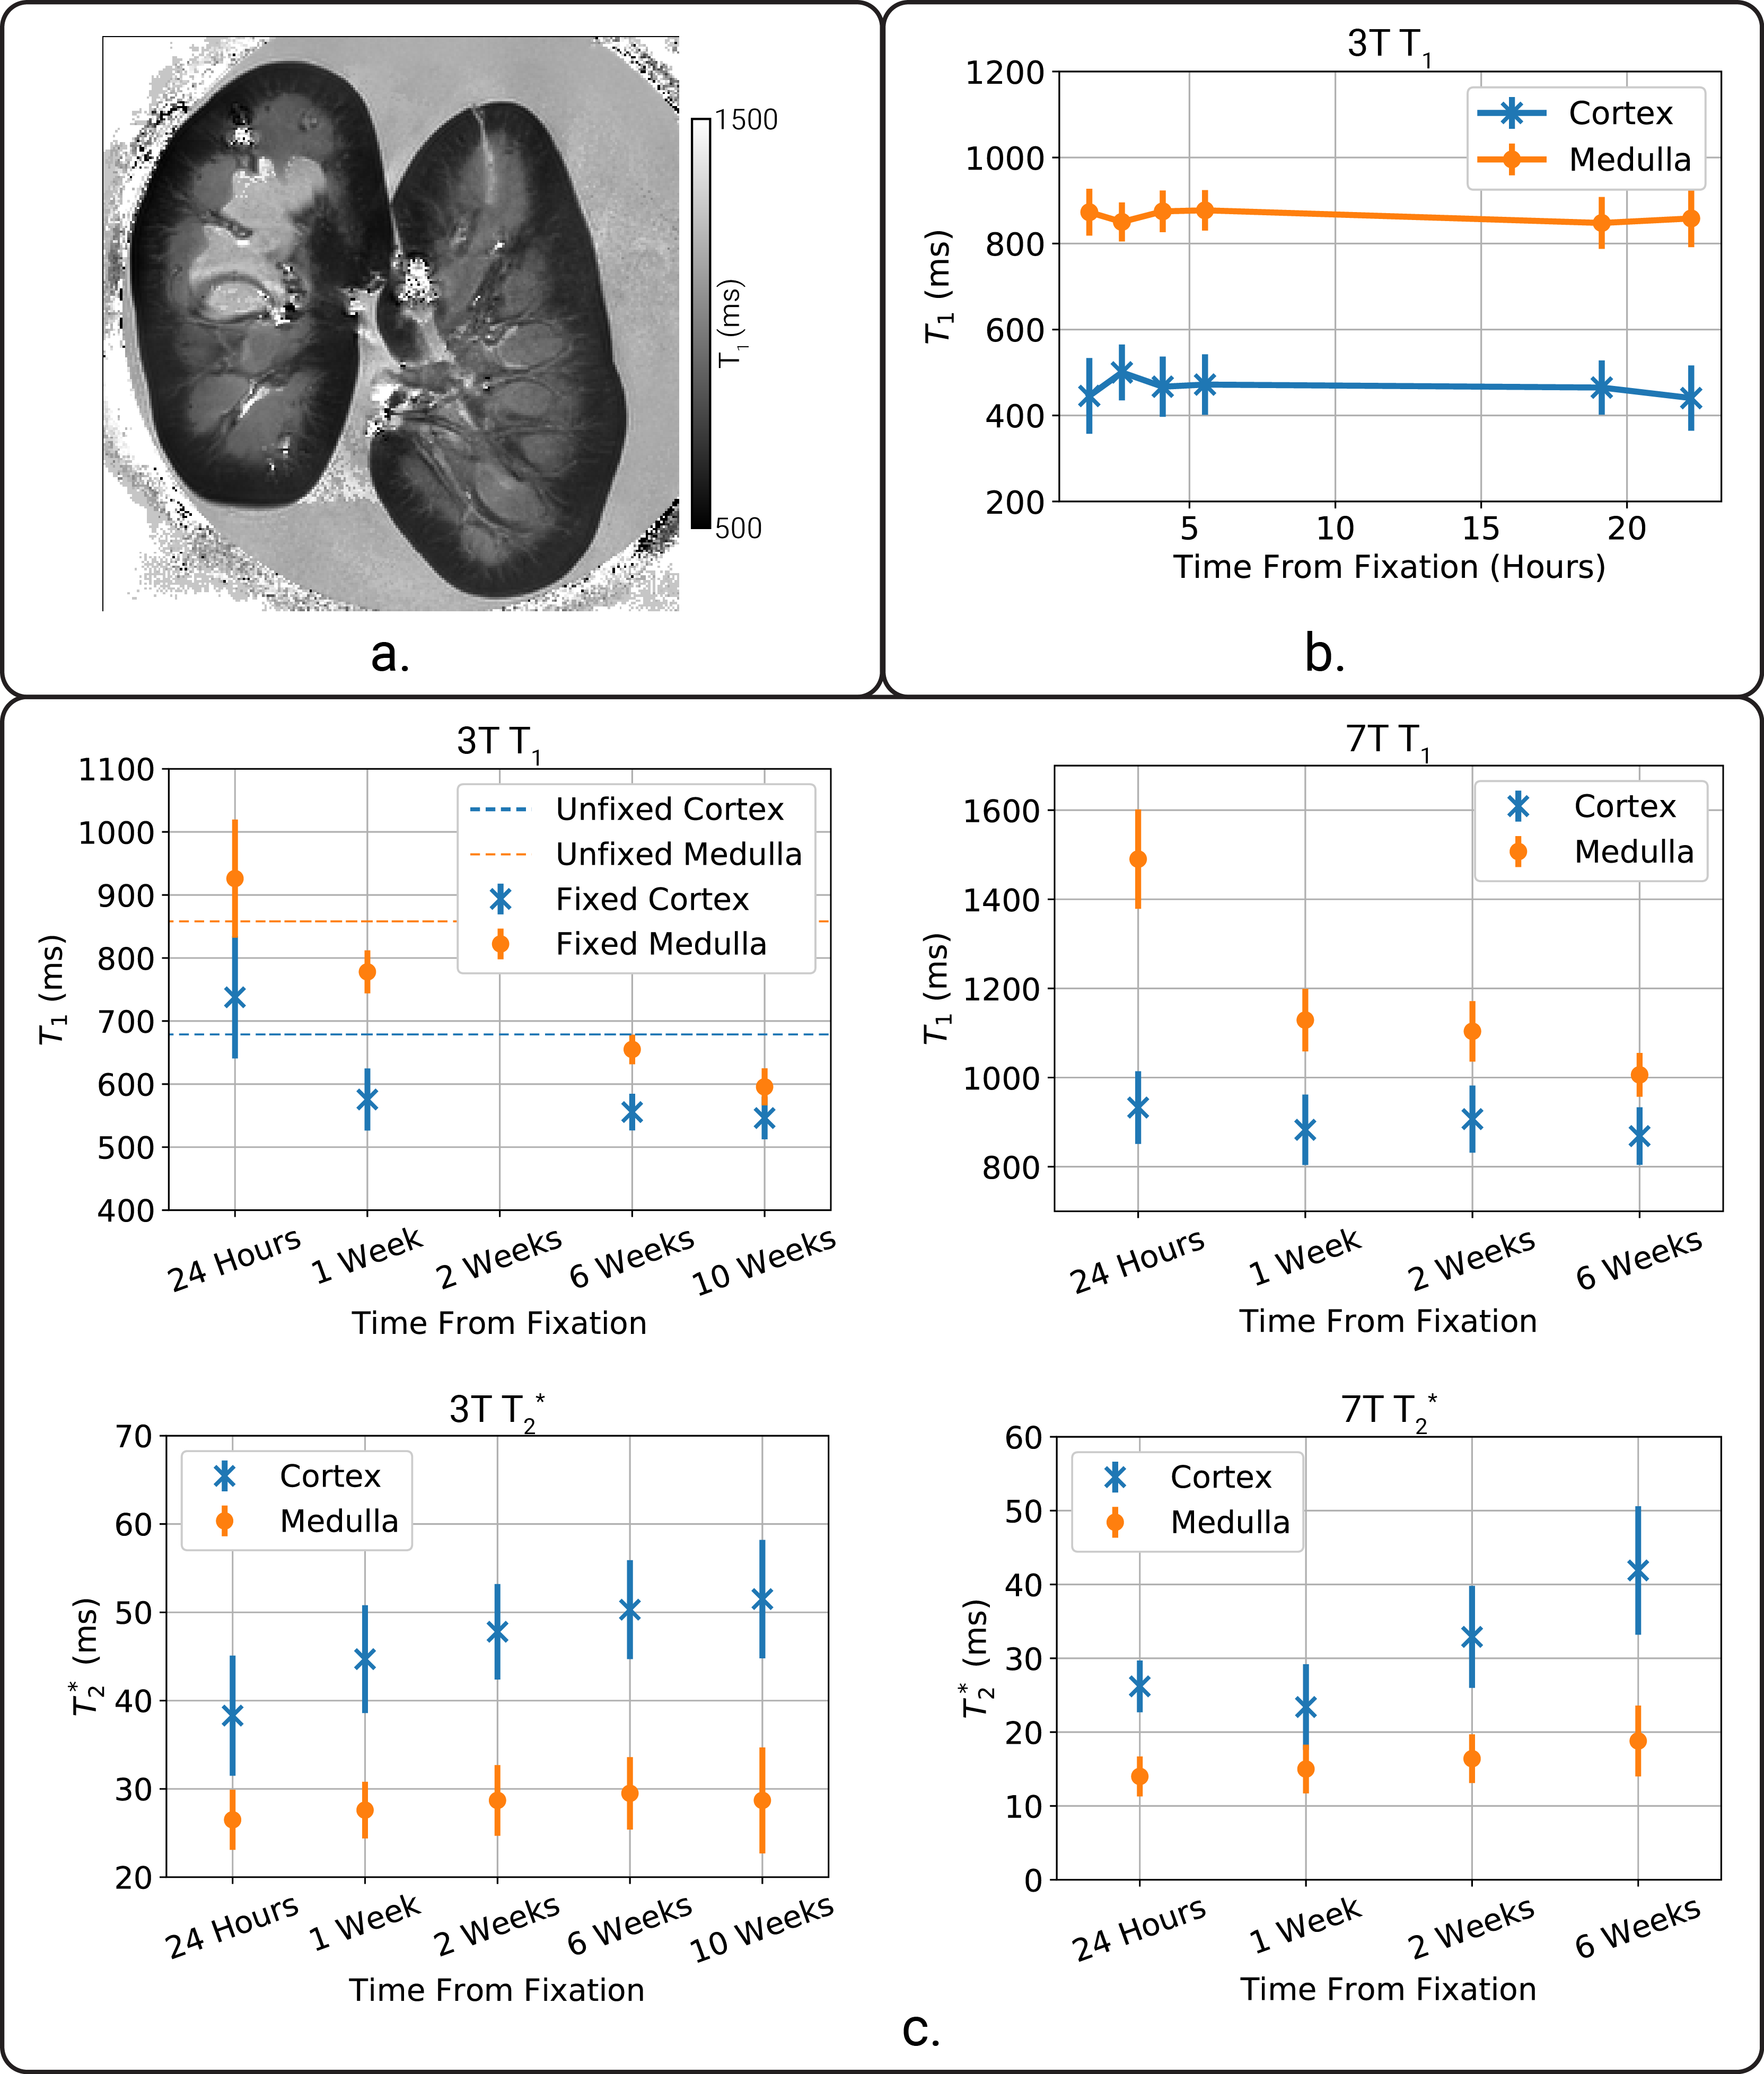
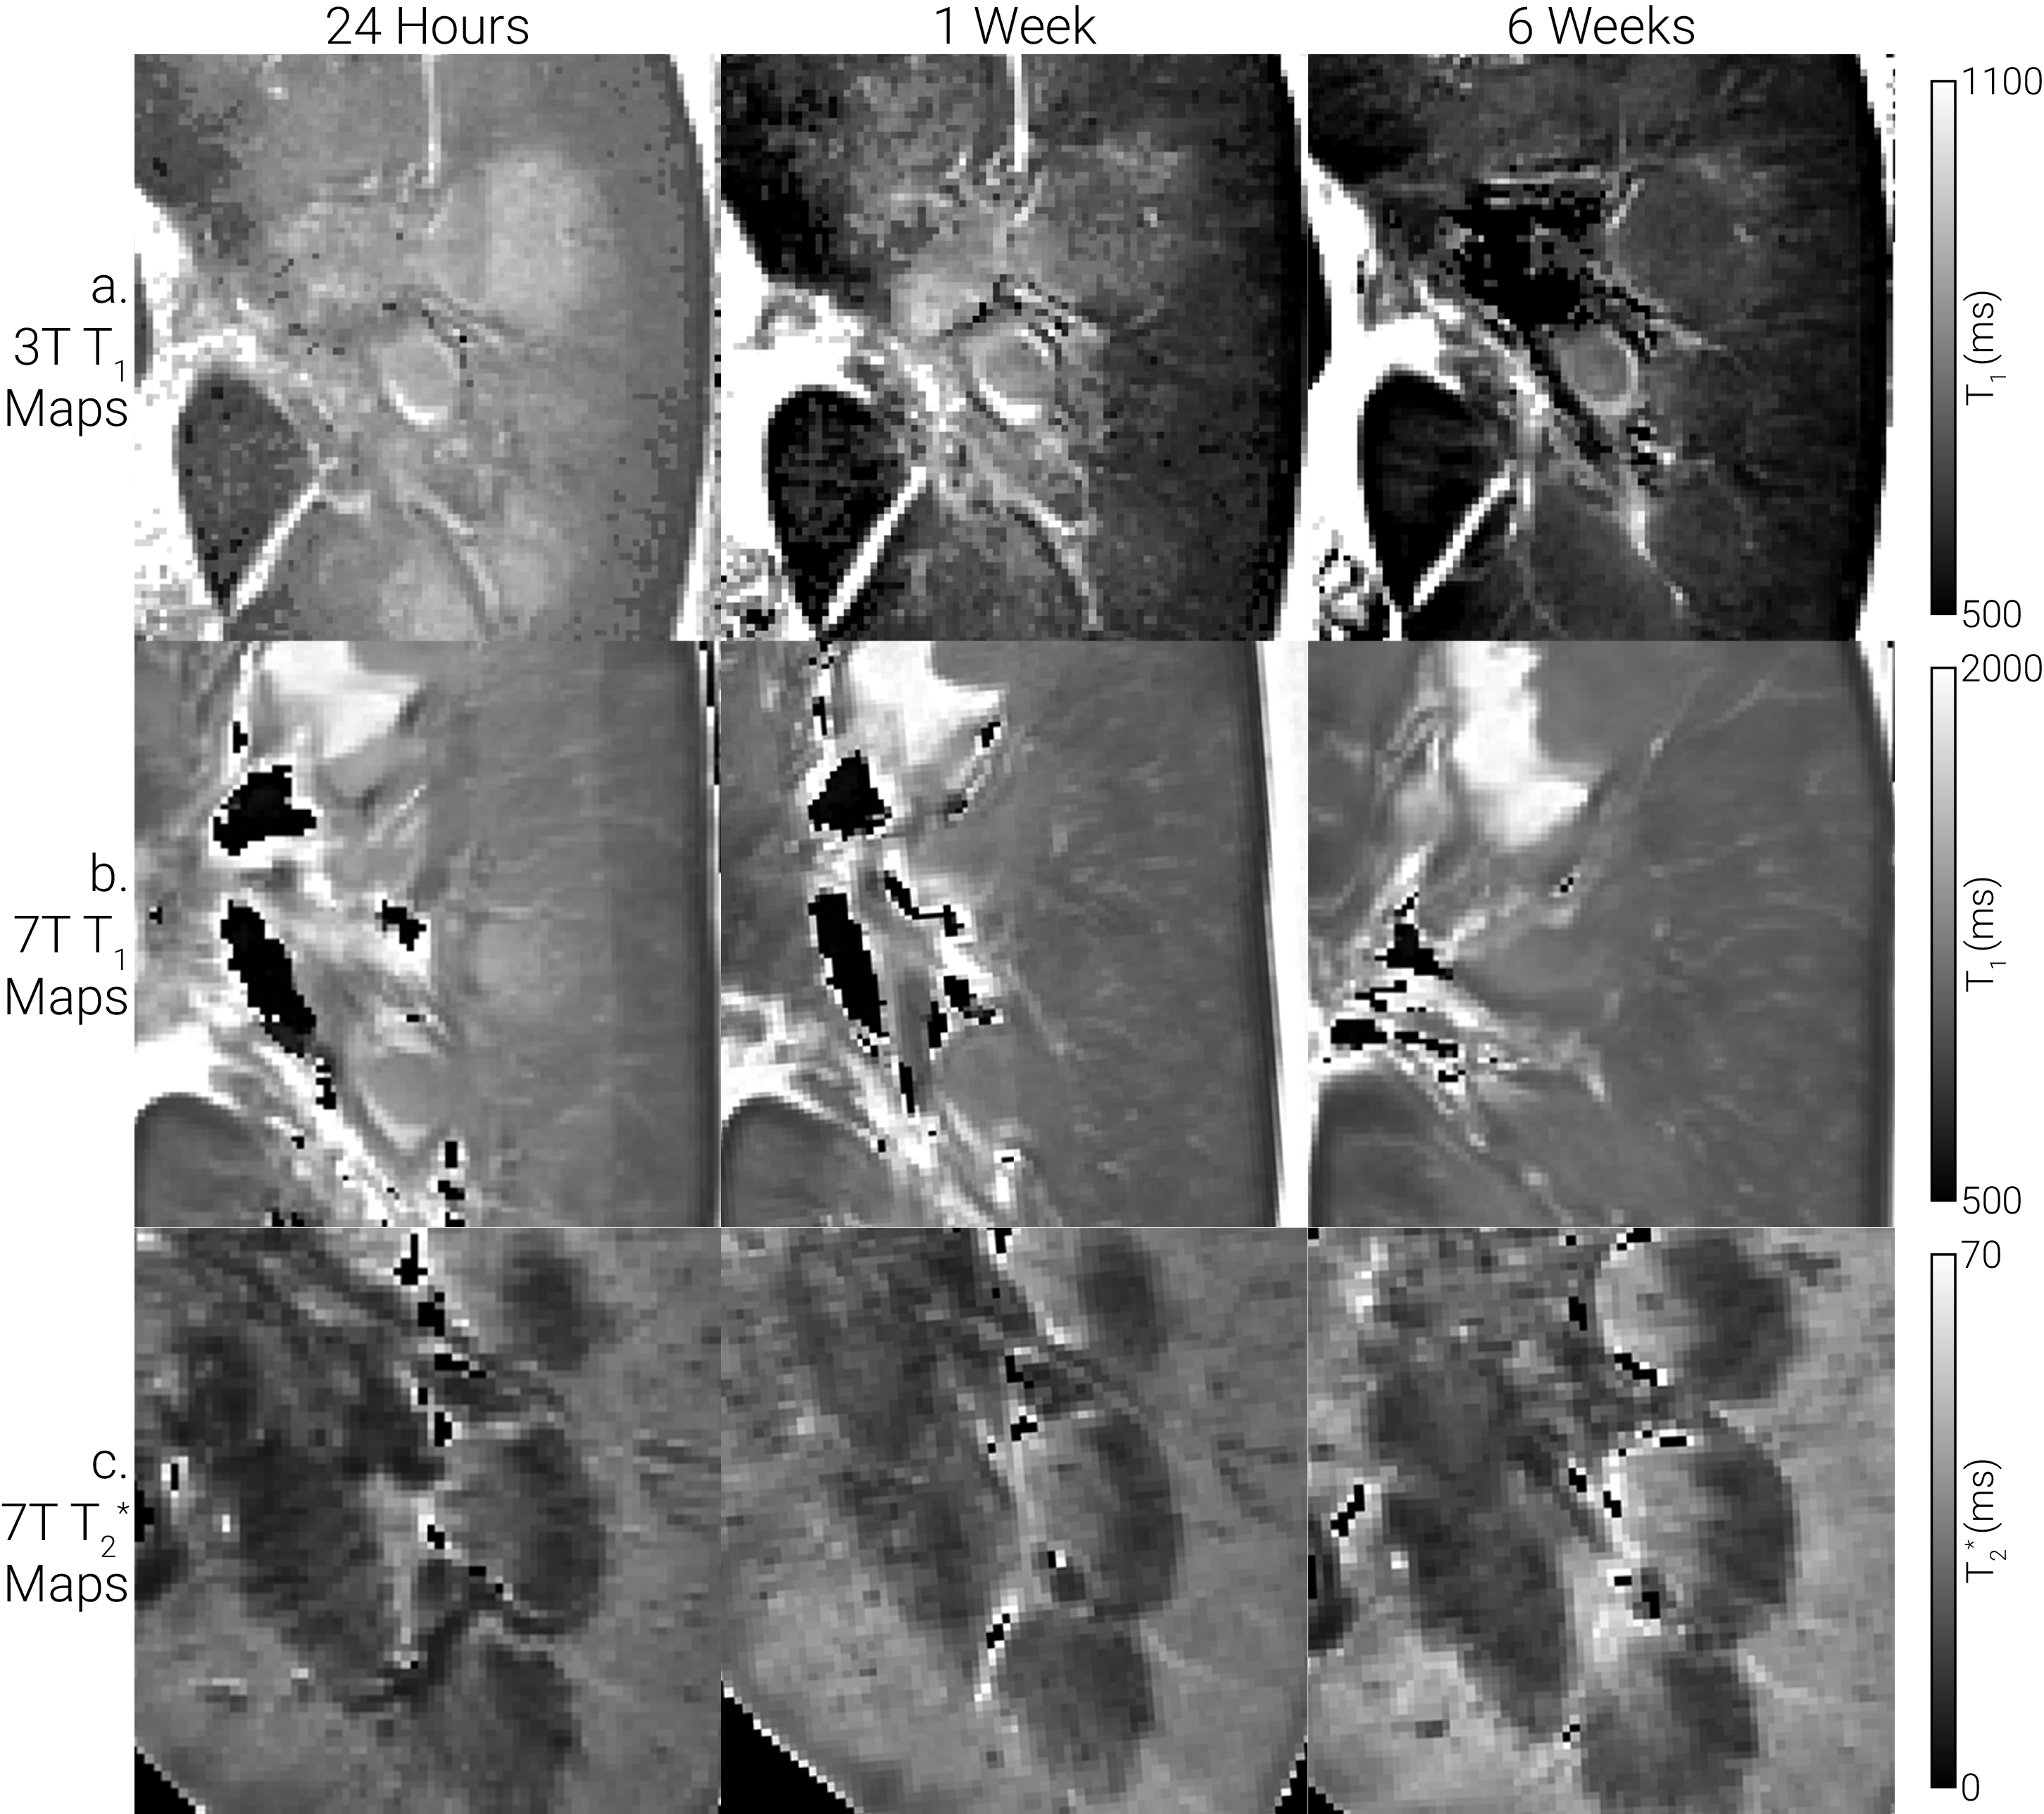
Example high resolution whole kidney T1 and T2* maps are shown in Fig.2. The T1 and T2* maps were imaged over 24-hours and ten-weeks (Fig.3). There was little change in T1 over 24-hours of immersion in PBS (Fig.3b), and T1 was close to that of an unfixed kidney. There was a large change in T1 observed between 24-hours and one week, after this there was a general decline in T1 of the medulla while the cortex remained constant (Fig.3b). The T2* of the medulla remains constant over the ten-weeks whilst the renal cortex T2* increases. Figure 4 shows matched slices from the 3T T1, 7T T1 and 7T T2* maps. In Fig.4b it is possible to differentiate between the cortex and outer medulla at 24-hours, but after one week this differentiation is no longer visible. No small scale changes are visible in the T2* maps, only the bulk increase in T2* of the cortex. Fig.5 shows 3T T1 and T2* maps of the 0.5 and 2.5 year-old kidneys and associated measures in renal cortex and medulla. MR data shows no significant difference in T1 or T2* of the cortex between 0.5 and 2.5 years; both T1 and T2* of the medulla is lower in 2.5-year kidney. No significant differences were seen between the histology of these pig kidneys. MRI and histology were similar between the 0.5 and 2.5-year pigs, we now plan to scan older pig kidneys which will have established levels of fibrosis on histology.Conclusion
Here we show that by scanning kidney samples for ten-weeks post fixation, T1 is similar to an unfixed kidney in the first 24-hours, after this T1 and T2* have a dependence on time after fixation. This suggests that nephrectomy samples should be scanned within 24-hours of rehydration.Acknowledgements
No acknowledgement found.References
1. Cox, E. F. et al. Multiparametric Renal Magnetic Resonance Imaging: Validation, Interventions, and Alterations in Chronic Kidney Disease. Front. Physiol. 8, (2017).
2. Friedli, I. et al. New Magnetic Resonance Imaging Index for Renal Fibrosis Assessment: A Comparison between Diffusion-Weighted Imaging and T1 Mapping with Histological Validation. Sci. Rep. 6, (2016).
3. Birkl, C. et al. Effects of formalin fixation and temperature on MR relaxation times in the human brain. NMR Biomed. 29, 458–465 (2016).
4. Kolasinski, J. et al. A combined post-mortem magnetic resonance imaging and quantitative histological study of multiple sclerosis pathology. Brain 135, 2938–2951 (2012).
5. Miller, K. L. et al. Diffusion imaging of whole, post-mortem human brains on a clinical MRI scanner. NeuroImage 57, 167–181 (2011).
6. Tovi, M. & Ericsson, A. Measurements of T1 and T2 over Time in Formalin-Fixed Human Whole-Brain Specimens. Acta Radiol. 33, 400–404 (1992).
7. Shatil, A. S., Uddin, M. N., Matsuda, K. M. & Figley, C. R. Quantitative Ex Vivo MRI Changes due to Progressive Formalin Fixation in Whole Human Brain Specimens: Longitudinal Characterization of Diffusion, Relaxometry, and Myelin Water Fraction Measurements at 3T. Front. Med. 5, (2018).
8. Sengupta, S. et al. High resolution anatomical and quantitative MRI of the entire human occipital lobe ex vivo at 9.4T. NeuroImage (2017). doi:10.1016/j.neuroimage.2017.03.039
9. Szumowski, J. et al. Signal polarity restoration in a 3D inversion recovery sequence used with delayed gadolinium-enhanced magnetic resonance imaging of cartilage (dGEMRIC). J. Magn. Reson. Imaging 36, 1248–1255 (2012).
Figures