1903
Multi-parametric MRI of Kidney Disease Progression in a Mouse Model of Autosomal Recessive Polycystic Kidney Disease (ARPKD)1Biomedical Engineering, Case Western Reserve University, Cleveland, OH, United States, 2Radiology, Case Western Reserve University, Cleveland, OH, United States, 3Biology, Case Western Reserve University, Cleveland, OH, United States, 4Radiology, Children’s Hospital of Philadelphia, Philadelphia, PA, United States, 5Pediatrics, Children’s Hospital of Philadelphia, Philadelphia, PA, United States, 6Cellular and Molecular Medicine, Cleveland Clinic Lerner Research Institute, Cleveland, OH, United States, 7Pediatrics, Case Western Reserve University, Cleveland, OH, United States, 8Center for Pediatric Nephrology, Cleveland Clinic Children's, Cleveland, OH, United States, 9CWRU Center for Kidney Research, The MetroHealth System, Cleveland, OH, United States
Synopsis
There are currently no sensitive measures for kidney disease progression in Autosomal Recessive Polycystic Kidney Disease (ARPKD). In this study, T1 and T2 relaxation times and Apparent Diffusion Coefficient (ADC)) were evaluated for their sensitivity to detect ARPKD progression in the bpk mouse model of ARPKD, which closely mimics human ARPKD kidney disease. Mean kidney T2 showed a significant correlation with both age and kidney volume. T1 and ADC showed no significant correlations. These results suggest that renal T2 relaxometry may be a viable marker for ARPKD kidney disease progression in vivo.
Purpose
Autosomal recessive polycystic kidney disease (ARPKD) is a rare but lethal genetic disorder characterized by diffuse renal microcysts.1,2 While new therapeutics are being developed for similar diseases, clinical trials for ARPKD patients are not currently possible due to the absence of sensitive measures of ARPKD kidney disease progression and/or therapeutic efficacy.1 The primary objective of this study was to evaluate the capability of multiple, established quantitative MRI techniques to detect ARPKD kidney disease progression in the bpk mouse model that closely mimics the progressive accumulation of diffuse renal microcysts typically associated with human ARPKD.3–5 Bpk mice typically die within 4 weeks of age due to progressive kidney disease,6 which makes longitudinal in vivo imaging assessments of bpk kidneys challenging. Therefore, in this initial study, we evaluated the capability of multiple quantitative MRI techniques (i.e., diffusion MRI and T1, T2 relaxometry) to detect and stage kidney disease in ex vivo bpk mouse kidneys in comparison to age-matched wild type mice. It is hoped that these initial ex vivo MRI findings will enable a more refined approach for eventual in vivo imaging studies in both bpk mice and eventually in ARPKD patients.Methods
Bpk mouse pups were euthanized
at 8 (n=3), 14 (n=3), and 21 (n=2) days of age by exsanguination and the
kidneys were excised and fixed in methanol. High resolution, axial T2-weighted
images were acquired with a multi-echo spin echo acquisition MSME for
positioning the kidney sample at isocenter. Quantitative
T1, T2, and ADC maps were obtained for the excised kidneys from bpk mice (n=8)
and wild type (WT) control mice (n=8) on a Bruker Biospec 7.0T MRI scanner. T1 data were obtained using multiple spin
echo pulse sequences with variable repetition times (TR = 10000 ms, 5000 ms,
2000 ms, 1000 ms, 500 ms, and 200 ms). T2 data were acquired with a multi-echo spin-echo MRI sequence (12 echoes, TE = 52.2 ms, 62.6
ms, 73.1 ms, 83.5 ms, 93.9 ms, 104 ms, 115 ms, 125 ms, 136 ms, 146 ms, 157 ms,
and 167 ms). A diffusion-weighted spin echo MRI
scan was used to obtain the ADC maps (b = 2 s/mm 2, 108 s/mm 2, 210 s/mm 2, 312 s/mm 2, 413 s/mm 2, and 515 s/mm 2). All MRI data was exported for offline
analysis in Matlab (The Mathworks, Natick, MA).
Quantitative T1, T2, and ADC maps were obtained by voxelwise linear
least squares fits of the imaging data to established mono-exponential models
for magnetic relaxation and diffusion. A region-of-interest (ROI) analysis was used to calculate
mean kidney T1, T2, and ADC values for each animal’s kidney. Image analysis was
performed by two expert raters and averaged. Differences in the mean kidney T1, T2, and ADC values for
the bpk and control mice were compared with two-tailed unpaired Student’s
t-tests. Pearson correlations were used
to determine relationships between the mean T1, T2, and ADC values with both
kidney volume and age. A probability of
0.05 (a) was used to test for significance.Results
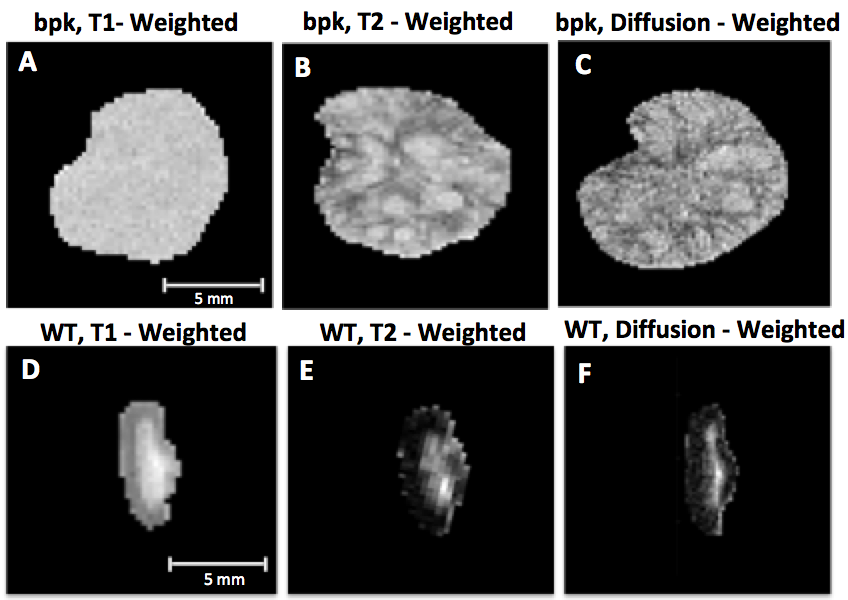
Representative T1-weighted, T2-weighted, and diffusion-weighted MRI images from a 21-day-old bpk mouse (A, B, C) and a corresponding 21-day-old WT control mouse (D, E, F) are shown in Figure 1. Quantitative MRI maps of T1 and T2 relaxation times and ADC for these same kidneys are shown in Figure 2. All three MRI metrics (i.e., mean kidney T1, T2, and ADC) showed a significant difference between the bpk mice and wild type control mice (Figure 3, p < 0.002). Further, the mean kidney T2 assessments showed significant correlations with both age and kidney volume (Figures 4 and 5, R > 0.83, p < 0.01). The corresponding correlations for T1 and ADC were not significant. These initial ex vivo MRI studies suggest that renal T2 relaxometry may be a viable marker for ARPKD kidney disease progression.Discussion & Conclusion
The results of this initial study suggest that mean kidney T2 values could be used as a sensitive measure of ARPKD kidney disease progression. Future longitudinal MRI studies in ARPKD patients will further evaluate the sensitivity of this MRI technique to detect and stage ARPKD kidney disease. If successful, this non-invasive and quantitative MRI technique could eventually be used as an outcome measure for clinical trials evaluating novel therapeutics aimed at limiting or preventing ARPKD kidney disease progression.Acknowledgements
We would like to thank the PKD foundation for their support for this study.References
1. Erokwu, B. O., Anderson, C. E., Flask, C. A. & Dell, K. M. Quantitative magnetic resonance imaging assessments of autosomal recessive polycystic kidney disease progression and response to therapy in an animal model. Pediatr. Res. 83, 1067–1074 (2018).
2. Macrae Dell, K. The Spectrum of Polycystic Kidney Disease in Children. Adv. Chronic Kidney Dis. 18, 339–347 (2011).
3. Nauta, J., Ozawa, Y., Sweeney, W. E., Rutledge, J. C. & Avner, E. D. Renal and biliary abnormalities in a new murine model of autosomal recessive polycystic kidney disease. Pediatr. Nephrol. 7, 163–72 (1993).
4. Veizis, E. I., Carlin, C. R. & Cotton, C. U. Decreased amiloride-sensitive Na absorption in collecting duct principal cells isolated from BPK ARPKD mice. Am J Physiol Ren. Physiol 286, 244–254 (2004).
5. Guay-Woodford, L. M. et al. Evidence that two phenotypically distinct mouse PKD mutations, bpk and jcpk, are allelic. Kidney Int. 50, 1158–1165 (1996).
6. Guay-Woodford, L. M., Wright, C. J., Walz, G. & Churchill, G. A. Quantitative trait loci modulate renal cystic disease severity in the mouse bpk model. J. Am. Soc. Nephrol. 11, 1253–60 (2000).
Figures