1902
A longitudinal study of lesion evolution in atheroembolic renal disease using BOLD MRI1Peking University, Beijing, China, 2Shanghai Jiao Tong University, Shanghai, China, 3Peking University First Hospital, Beijing, China
Synopsis
Atheroembolic renal disease (AERD) is part of a multisystemic disease caused by showers of cholesterol emboli from the atherosclerotic aorta to many organs and is usually associated with poor renal and patient survival. The specific evolution of renal tissue properties remains unclear because of the lack of sensitive imaging biomarkers to detect subtle AERD lesions. Once the embolus enters the blood circulation, it will cause tissue ischemia, endothelial inflammation and even renal function damage. Therefore, the level of blood oxygen is a perfect pointcut for AERD development. In this study, we aim to use blood oxygenation level dependent (BOLD) MRI to evaluate longitudinal changes in kidney properties before and after AERD appearance.
Introduction
Atheroembolic renal disease (AERD) is part of a multisystemic disease caused by showers of cholesterol emboli from the atherosclerotic aorta to many organs and is usually associated with poor renal and patient survival.1 The previous study showed that the cholesterol embolism affects kidney function within 2–4 weeks,2 however, the specific evolution of renal tissue properties remains unclear because the lack of sensitive imaging biomarkers to detect subtle AERD lesions. Once the embolus enters the blood circulation, it will stay in a small artery about 150-200 μm in diameter, causing tissue ischemia, endothelial inflammation, and even renal function damage. Therefore, the level of blood oxygen is a perfect pointcut for AERD development. And meanwhile, the noninvasive characteristic of MRI makes it suitable for longitudinal study. So, in this study, we aim to use blood oxygenation level dependent (BOLD) MRI to evaluate longitudinal changes in kidney properties before and after AERD appearance.Methods
Animal Study
The Institutional Animal Care and Use Committee approved all procedures and protocols in this study. Twenty New Zealand white rabbits (male, 3.09 ± 0.58 kg) underwent unilateral AERD surgery induced by the injection of microsphere through renal artery under the guidance of DSA. All the rabbits were given standard rabbit diet and tap water. The animals were raised separately under the same conditions.
MRI protocol
MR imaging was performed on a 3 Tesla Philips Achieva MR scanner (Philips Medical Systems, Best, Netherlands) by an 8-channel knee coil. Rabbits were anesthetized by injection with a dose of 0.5mg/kg of pentobarbital sodium through the ear vein before scanning. BOLD MR examination was performed before AERD surgery (Day 0) and at 1 hour (Day 1), 2 day (Day 2), 1 week (Week 1) and 4 weeks (Month 1) after injection of microspheres. A multi-echo gradient echo imaging sequence was used for BOLD imaging. Imaging parameters are: TEs = 4.6, 9.2, 13.8, 18.4, 23.0, 27.6, 32.2, 36.8ms, TR = 500ms, flip angle = 25°, FOV = 150 x 150 mm2, Matrix Size = 135 x 135, Slice Thickness = 5mm, Times of Repetition = 1.
Image Analysis
To calculate the T2* maps, mono-exponential fitting was performed through the multi-echo data according to the equation below:
S=S0exp(-TE/T2*)
In this study, T2* values were estimated and compared between scans. T2W images were utilized as a guide to lesion locations. Then, lesion contours were delineated on BOLD images by the radiologist and saved as binary masks. The delineated masks were loaded and multiplied with the corresponding T2* map, and the mean and standard deviation of T2* values were calculated. In addition, the changes in the size of the ischemic focus were also recorded, and the area of the mask delineated above was regarded as the lesion area. All the calculations were performed using Matlab (MathWorks, Natick, MA).
Results
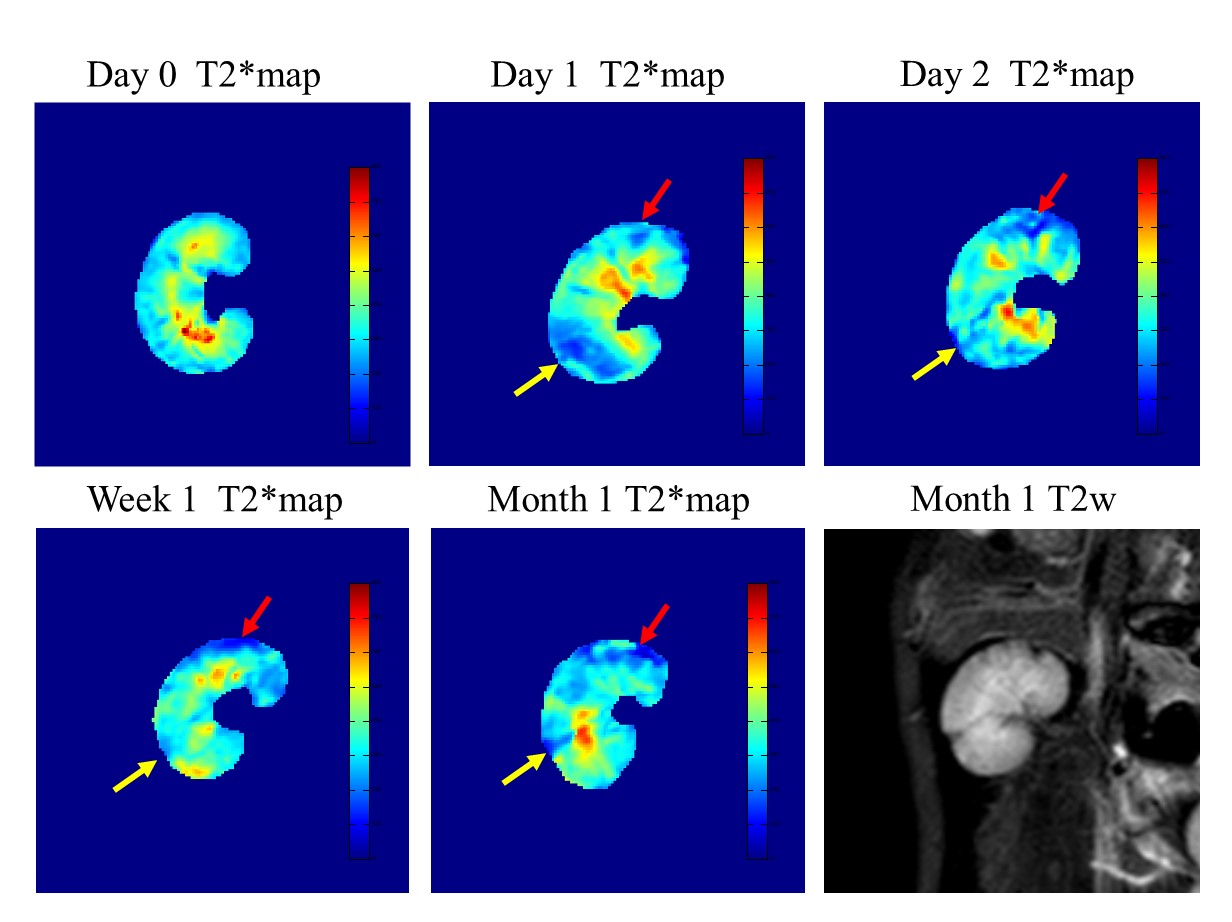
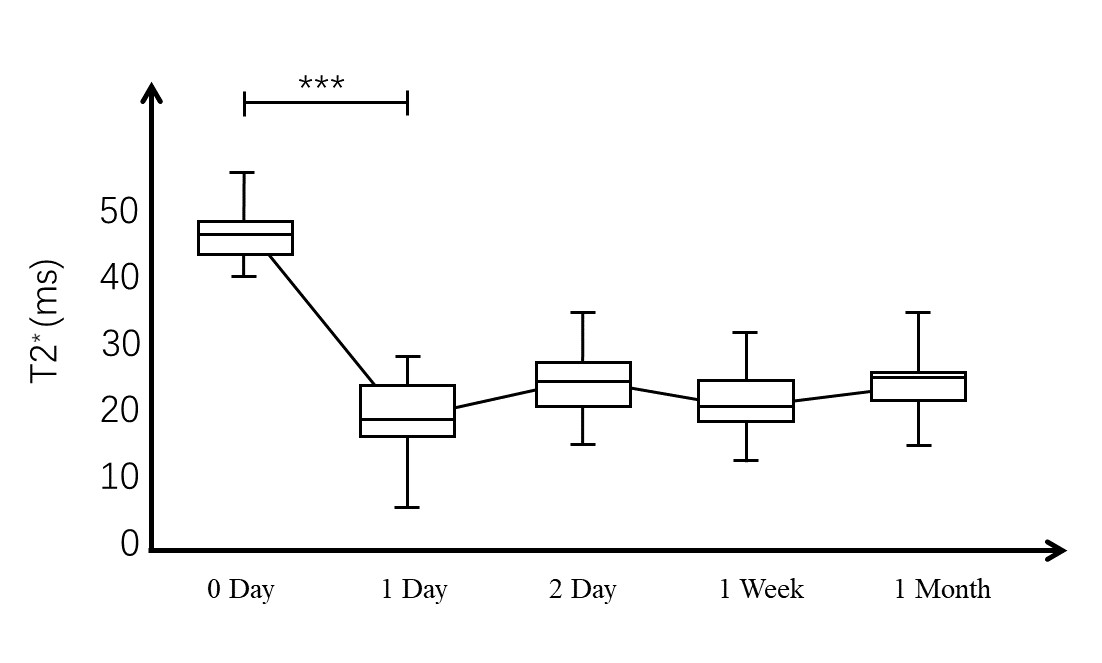
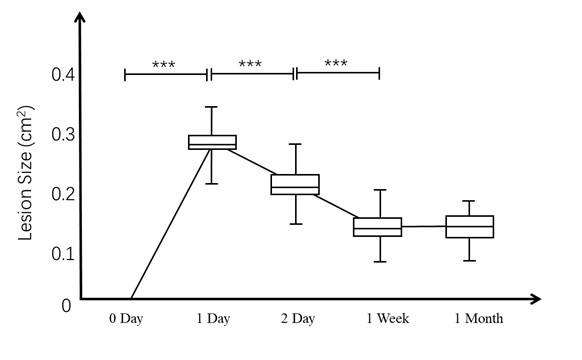
Typical T2* maps at five-time points are plotted in figure 1. Marked reduction of signal intensity in T2* map is observed an hour after emobilization (red and yellow arrows). During the next month, even though the area of the signal decreased changed, the ischemic areas were always present in T2* maps. The size of the lesion shown by the red arrow reaches its maximum 1 day after the embolization, and several scattered small lesions could be seen on the T2 image one month later. The size of the ischemic lesion shown by the yellow arrow reaches its maximum one hour after the embolization, then gradually decreases in one month. A focal lesion finally forms on T2 weighted image one month later. The change of T2* values in 20 lesions is shown in Figure 2. After the AERD operation, the T2* values decrease dramatically one hour after the embolization operation and maintains steady. The lesion area also reaches the highest level immediately after the model is made, then gradually decreases in the following one month.Discussion and Conclusion
The T2* values decreased dramatically immediately after the AERD model was induced because of the occlusion of the small artery. And since the emboli would stay once it entered the artery, the changes in T2* value occurred slowly and were constrained within relatively tight bounds in the following one month. The decrease of lesion size probably related to collateral development. In conclusion, we characterize early changes in T2* at 4weeks prior to the clinical appearance of lesions on T2 weighted images. Repeated BOLD imaging can successfully and noninvasively track the formation of renal ischemia lesion in AERD model.Acknowledgements
No acknowledgement found.References
1. Scolari F, Ravani P, Maffei C. Predictors of renal and patient outcomes in atheroembolic renal disease: A prospective study. J Am Soc Nephrol. 2003;14:510a-510a.
2. Scolari F, Ravani P. Atheroembolic renal disease. The Lancet. 2010;375(9726):1650-1660.
Figures