1901
Noninvasive Assessment of Tubulointerstitial Fibrosis in a Murine Fibrosis Model by Quantitative Magnetization Transfer MRI1Vanderbilt University Institute of Imaging Science, Vanderbilt University Medical Center, Nashville, TN, United States, 2Division of Nephrology and Hypertension, Vanderbilt University Medical Center, Nashville, TN, United States
Synopsis
Renal fibrosis is a hallmark of chronic kidney disease, which drives further kidney injury and leads to renal failure. It is critical to assess the spatiotemporal extent of fibrosis in kidney. However, currently there are no reliable non-invasive means for assessing the severity and progression of fibrosis in individual kidney. Therefore, here we evaluate the utility of MT imaging for measuring renal fibrosis in kidney using hHB-EGFTg/Tg mouse model, in which progressive fibrosis is the predominant event. In this study, we compare and assess the utility of MTR and PSR for detecting tubulointerstitial fibrosis in OSOM of kidney.
Purpose
Excessive tissue scarring, or fibrosis is a critical contributor to chronic kidney disease; however, current clinical tests are insufficient for assessing renal fibrosis. Quantitative magnetization transfer (qMT) MRI provides indirect information about the macromolecular component in tissues. In this study, we evaluated the utility of pool size ratio (PSR) from qMT for detecting tubulointerstitial fibrosis in a murine renal fibrosis model with selective activation of epidermal growth factor receptor in renal proximal tubule.1Methods
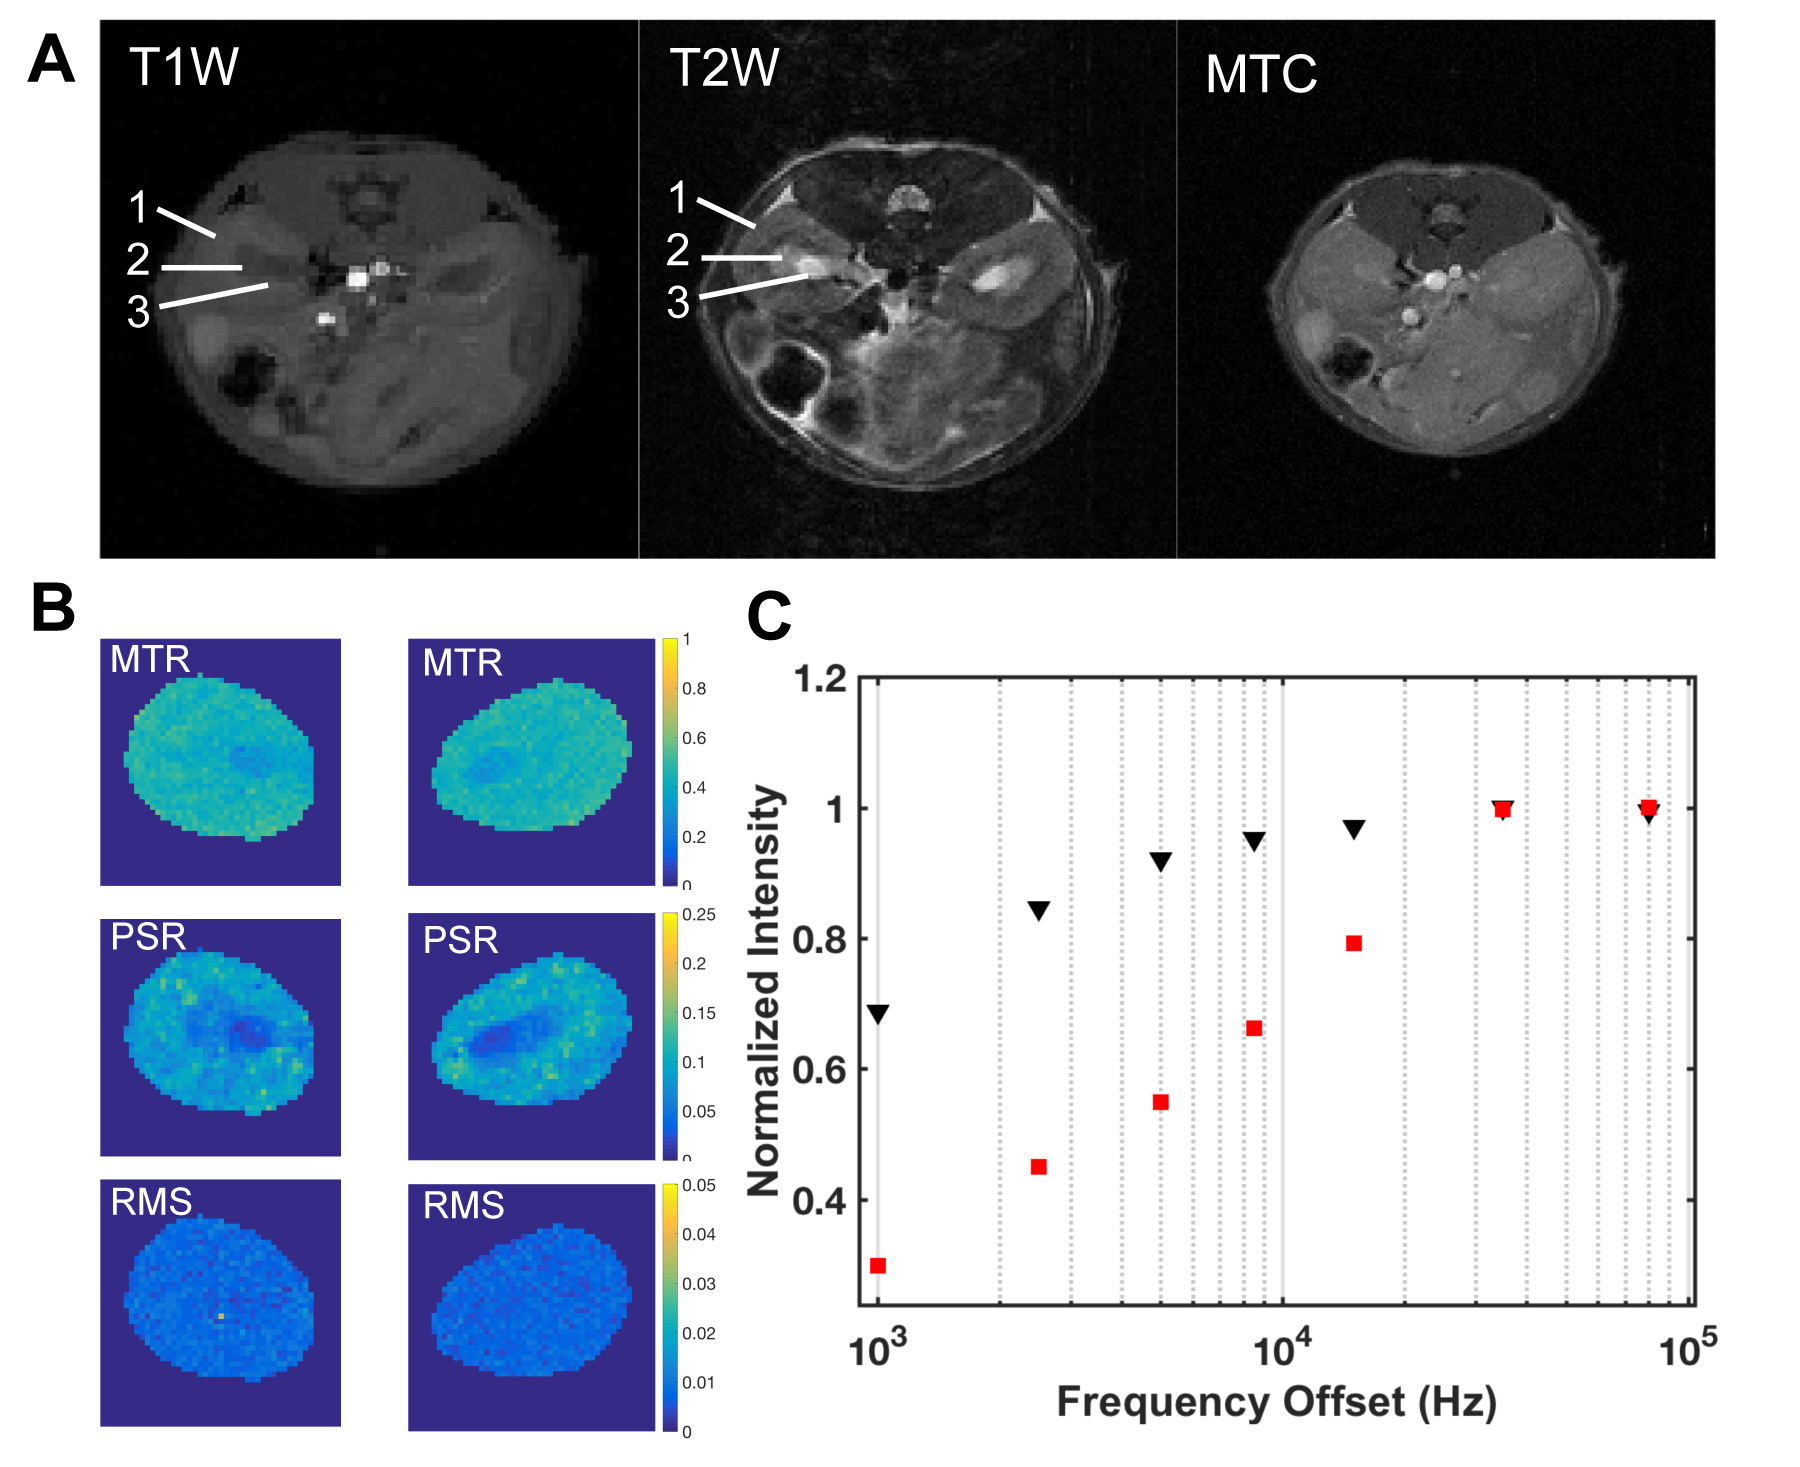
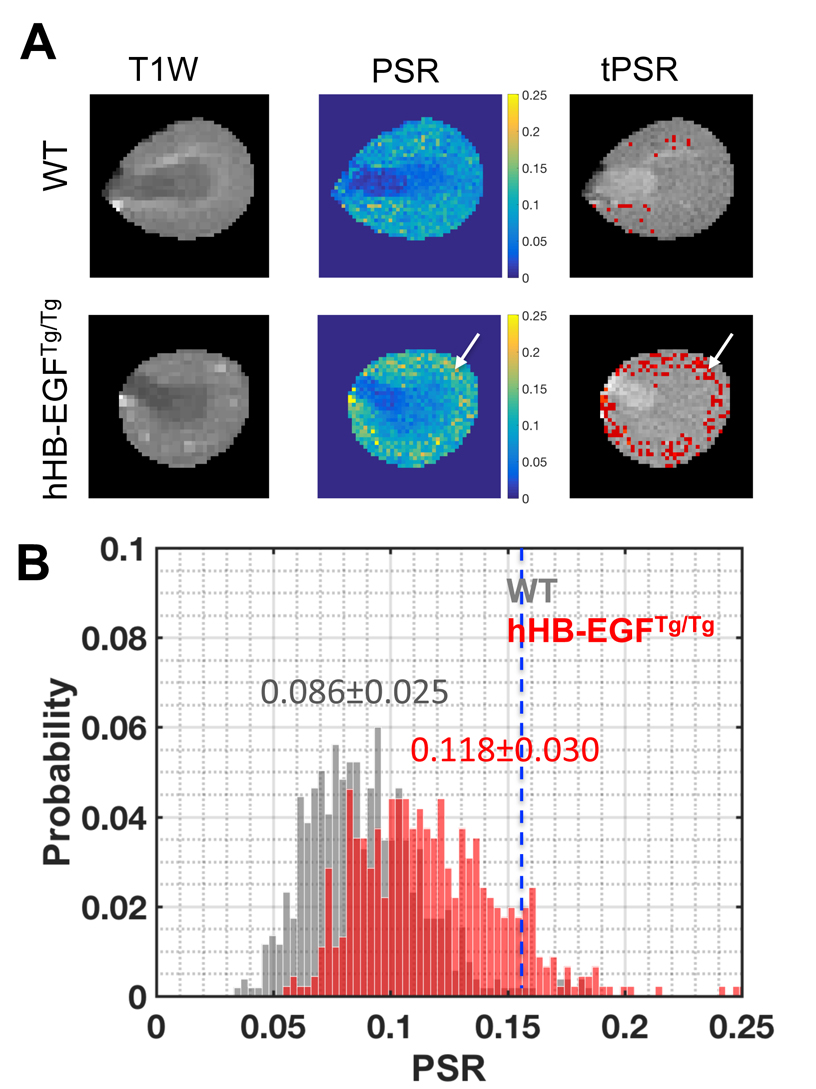
The 16-week-old hHB-EGFTg/Tg mice, a well-established model of progressive fibrosis1, and normal control wild type (WT) mice were imaged at 7T. The qMT data were collected in transverse plane (Fig. 1) using a 2D MT prepared spoiled gradient echo sequence with a Gaussian-shaped presaturation pulse. QMT parameters were derived using a two-pool fitting model.2 Magnetization transfer ratio (MTR) was also quantified with MT saturation Ssat at θsat = 820° and RF offset 5000 Hz for comparison.2 A normal range of PSR was defined as Mean ± 2SD of WT kidneys (N=12). The regions whose PSR values exceeded this threshold (threshold PSR, tPSR) were assessed.2 The spatial correlations between the PSR-based and histological fibrosis were evaluated. The significance of differences between groups was evaluated using Student’s t-tests. It was considered as statistically significant when p < 0.05. Paraffin tissue sections were stained with Masson trichrome using standard procedures.Results
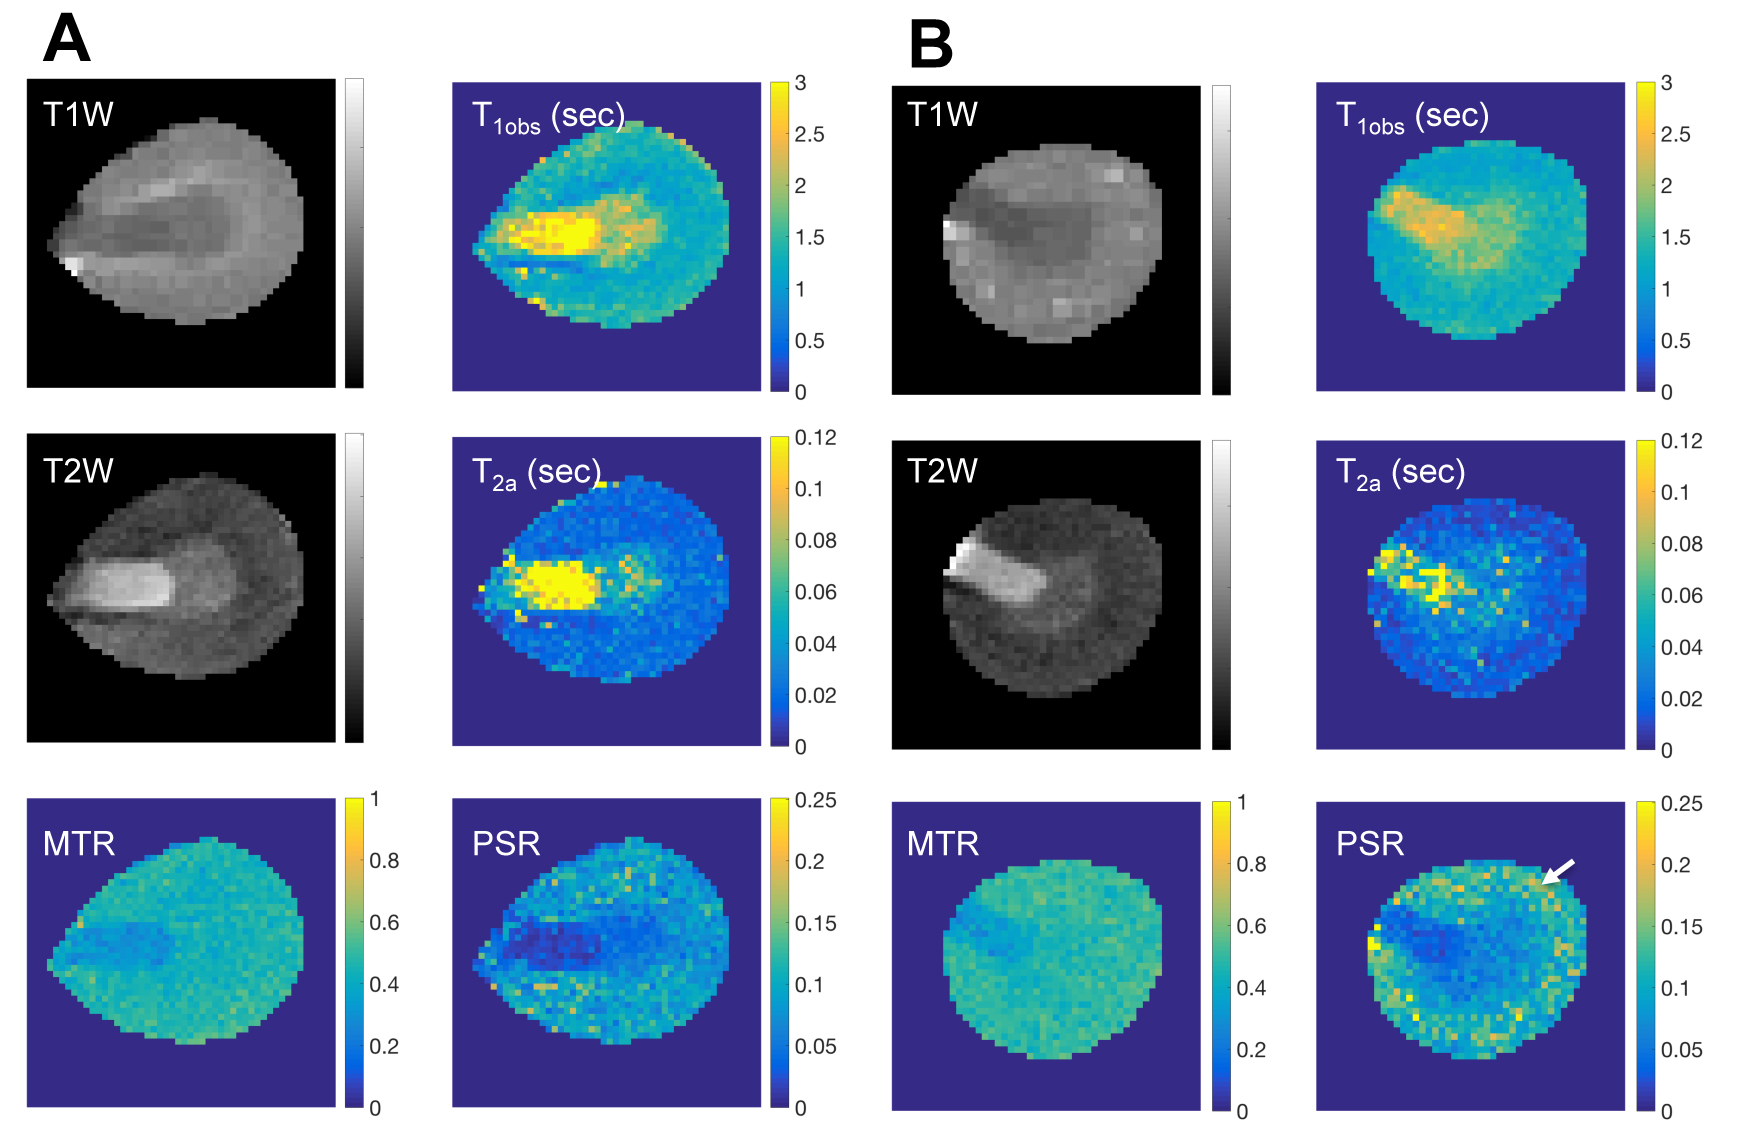
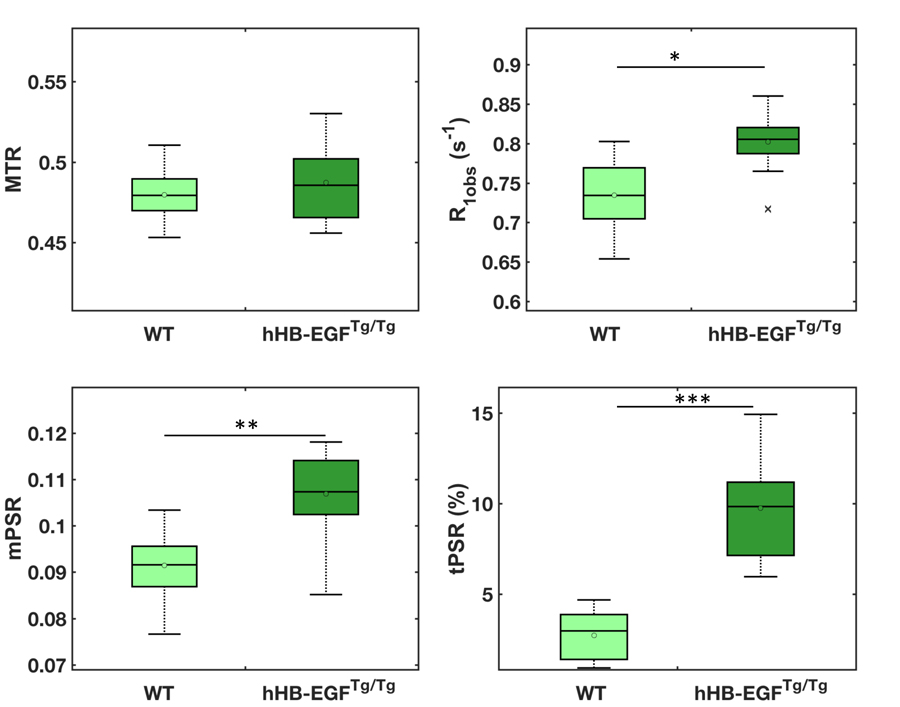
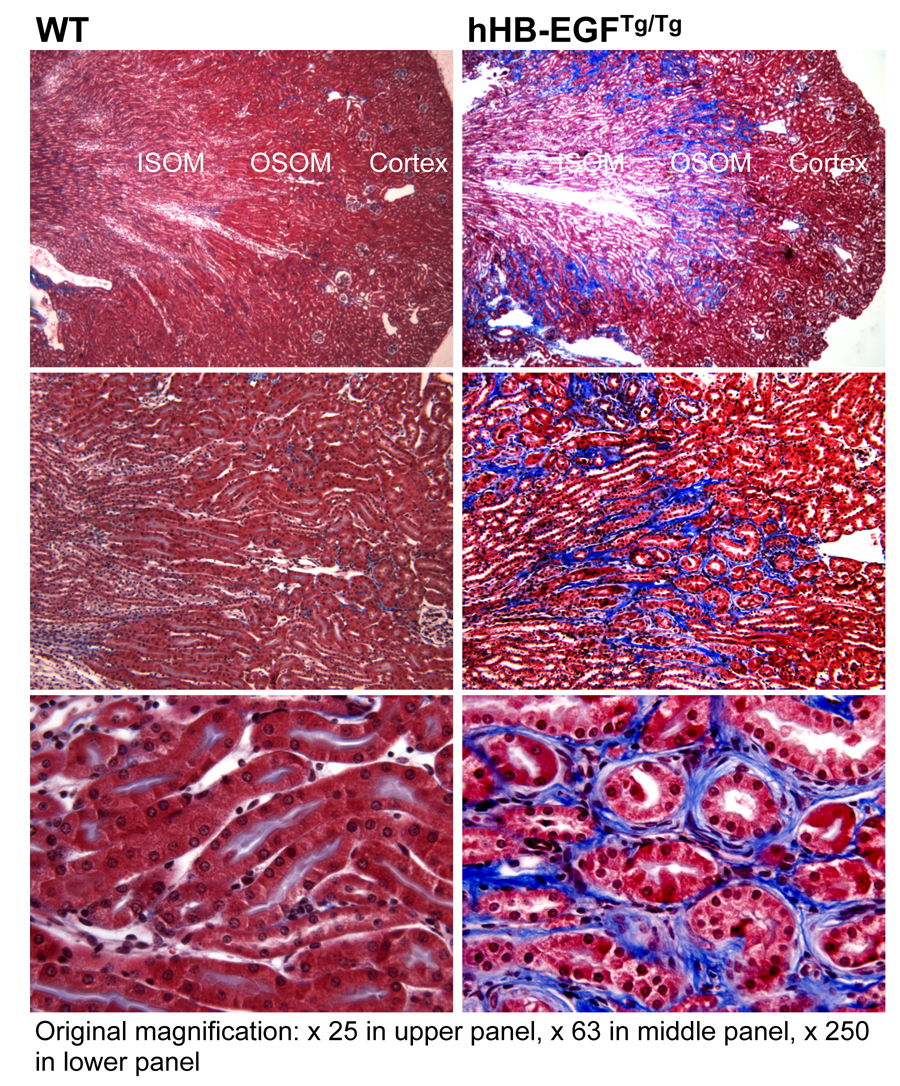
Compared with normal WT mice, moderate increases in mean PSR (mPSR) values and scattered clusters of high PSR region were observed in the outer stripe of outer medulla (OSOM) of hHB-EGFTg/Tg mouse kidneys (Fig. 2). However, no significant difference of MTR was observed between WT and hHB-EGFTg/Tg kidneys (Fig. 2). Spatially, MTR map of hHB-EGFTg/Tg kidney did not show elevated values for OSOM, compared to adjacent cortical and OM regions (Fig. 2B). The abnormal high PSR regions (% area) detected by the tPSR were significantly increased in renal OSOM of hHB-EGFTg/Tg mice (Fig. 3). The cortical differences between hHB-EGFTg/Tg and WT kidneys (N = 12) are compared in Figure 4. Across models, no significant differences in cortical MTR were observed between 16-week-old WT and hHB-EGFTg/Tg mice (Fig. 4). The mean mPSR and R1obs (1/T1obs) showed significant increases, and the tPSR increased drastically in hHB-EGFTg/Tg kidney. These observations were highly related to histological detected fibrosis regions observed in this model (Fig. 5).Conclusion
Renal tubulointerstitial fibrosis in OSOM can be assessed by the qMT MRI and threshold PSR analysis. This technique may be used as a novel imaging biomarker for chronic renal diseases.Acknowledgements
We thank Mr. Fuxue Xin, Mr. Ken Wilkens, Dr. Daniel C. Colvin, Mr. Jarrod True, and Dr. Mark D. Does in the Center for Small Animal Imaging at Vanderbilt University Institute of Imaging Science. This work was supported by National Institutes of Health grants DK114809, DK95785, DK51265, DK62794, DK103067, and EB024525. This work was also supported by grant 1S10OD019993-01 for the Advance III HD Console, housed in the Vanderbilt Center for Small Animal Imaging.References
1. Overstreet JM, Wang YQ, Wang X, et al. Selective activation of epidermal growth factor receptor in renal proximal tubule induces tubulointerstitial fibrosis. Faseb J. 2017;31:4407-4421.
2. Wang F, Katagiri D, Li K, et al. Assessment of renal fibrosis in murine diabetic nephropathy using quantitative magnetization transfer MRI. Magn Reson Med. 2018;80:2655-2669.
Figures