1900
Any Correlation between Pulmonary Function Test and Lung UTE-MRI?1Department of Biomedical Engineering, Sungkyunkwan University, Suwon, Korea, Republic of, 2Department of Radiology and Center for Imaging Science, Samsung Medical Center,Sungkyunkwan University School of Medicine, Seoul, Korea, Republic of, 3Center for Neuroscience Imaging Research, Institute for Basic Science, Suwon, Korea, Republic of
Synopsis
Although PFT is widely used for diagnosis pulmonary disease, there has been continuing interest in the possibility of using MRI to detect the pulmonary function value such as FEV1, FVC and FEV/FVC. However, previous works acquired distribution of lung lesions and ventilation defect region. Here, we proposed a new method to evaluate lung function by MRI. We demonstrated its feasibility with six healthy subjects. Despite the number of subject was too small, the results show a correlation with the results of the PFT.
Introduction
Pulmonary Function Test(PFT) is simple but effective diagnostic way of testing pulmonary function. PFT provides measurements related to pulmonary function such as FEV1, FVC, and FEV1/FVC1. However, PFT is not able to give any information about the distribution of defect regions and ventilation function. In contrast, an alternative to CT without radiation exposure, lung MRI using ultra-short echo-time(UTE) has also been tried to overcome the challenges in lung MRI such as a paucity of protons, respiratory motion, and large magnetic susceptibility difference at the air-tissue interface2. In terms of evaluating pulmonary function, it was recently reported that difference in the signal intensity between inspiration and expiration images could present the defect regions3 or ventilation map4 through registration of the images from respiratory phases. In this study, we tried to provide some quantitative values that can represent the degree of pulmonary function and explored any correlation between the MR values we defined and PFT measurements. We tried not to rely on image registration which usually has a few millimeter error ranges5 and calculated the quantitative values at the inspiration and expiration stages.Methods
PFT: PFT was performed with six healthy subjects. Three parameters of interest were measured including FEV1, FVC, and FEV1/FVC. All PFTs were performed in accordance with American Thoracic Society/European Respiratory Societies(ATS/ERS) recommendations for acceptability and repeatability.
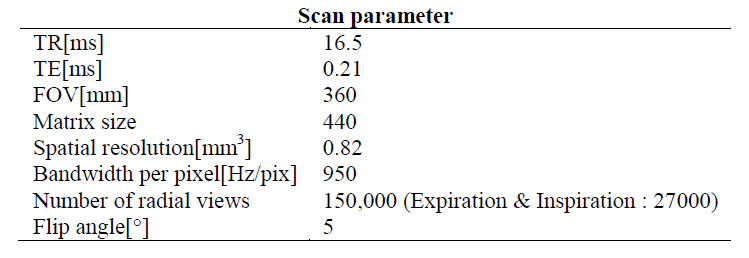
Lung imaging: This study was approved by the Institutional Review Board of Sungkyunkwan University,and performed in full accordance with guidelines. The six subjects were scanned for lung imaging in free breathing at 3T(Prisma,Siemens) using a 30-channel receive coil. For all experiments, a recently developed gradient-echo-based 3D-UTE sequence, called CODE(Concurrent-Dephasing-and-Excitation), was used with fat suppression6,7. Scan parameters were given in Table 1. A self-navigation method developed by our own group was used to trace the respiratory signal, where two consecutive posterior-interior projections are repeatedly acquired to reduce the background fluctuations of the respiratory signal by minimizing the pseudo steady states8.
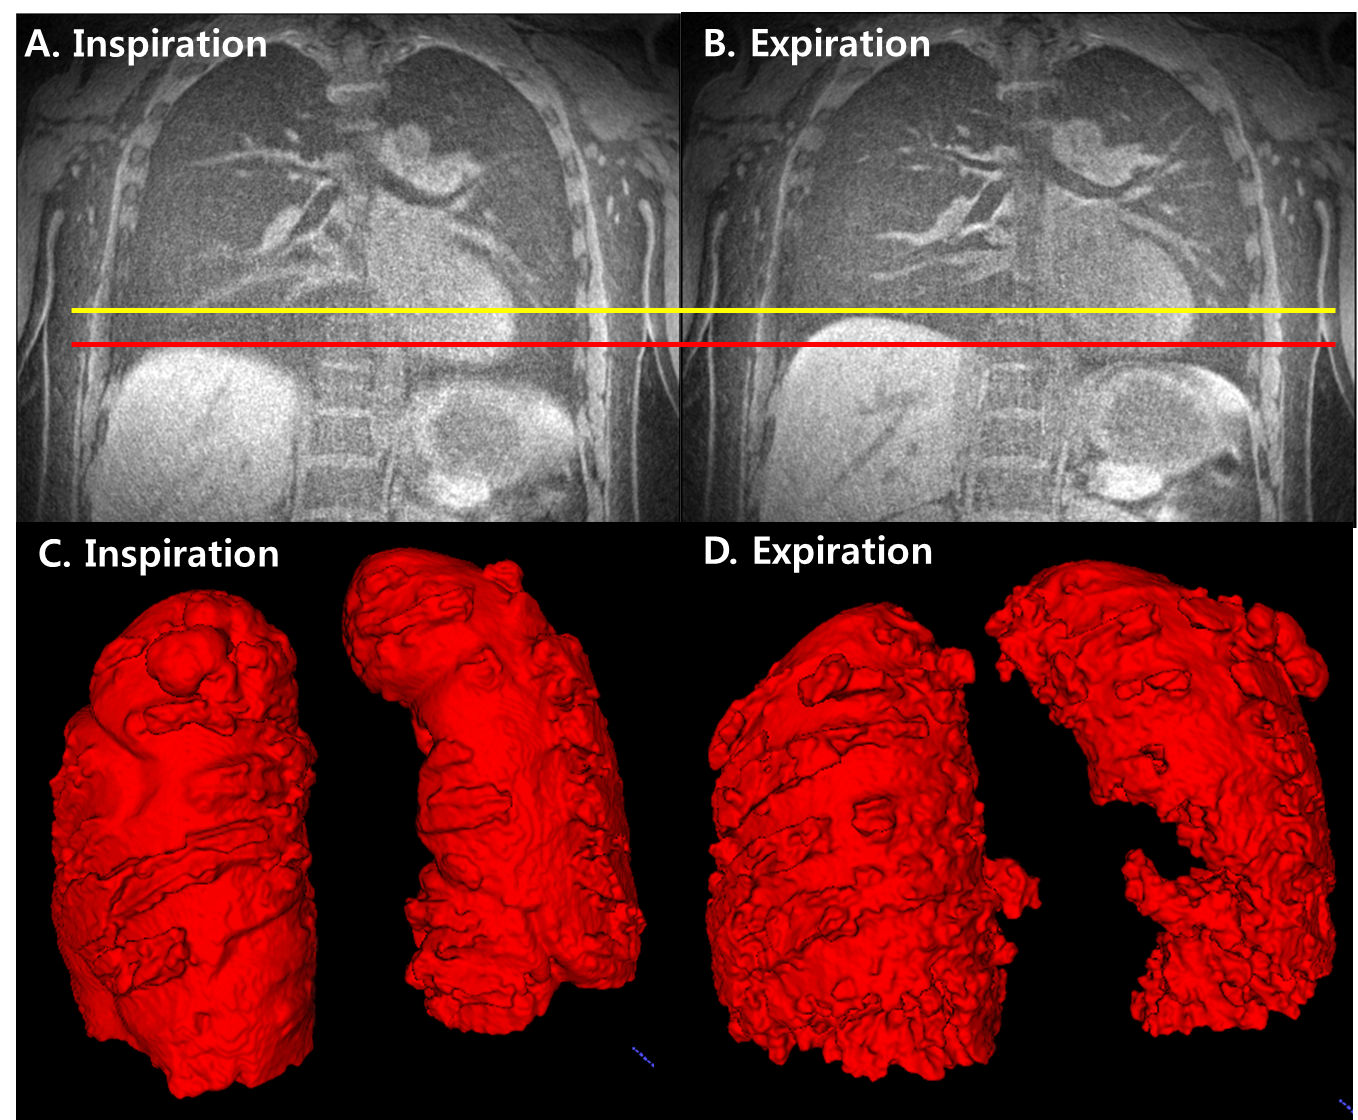
Data Processing and Analysis: Images were reconstructed with a home-built MATLAB program using fast-Fourier-transform(FFT) via gridding(Fig.1A,B). Lung was segmented for volume calculation using ITK-SNAP(Fig.1C,D). In order to evaluate the pulmonary function, we defined some quantitative parameters such as mean lung signal(LS), ventilation1(VE1), and ventilation2(VE2) as follows:
$$LS=(\text{sum of all voxel volume})/(\text{lung volume}), \quad\quad\quad\quad\quad\quad[Eq.1]$$
$$VE_1=(\text{LS}_\text{ins})/(\text{LS}_\text{exp})\times100,\quad\quad\quad\quad\quad\quad\quad\quad\quad\quad\quad\quad\quad\quad[Eq.2]$$
$$VE_2=(\text{LS}_\text{exp}-\text{LS}_\text{ins})/(\text{LS}_\text{ins})\times100,\quad\quad\quad\quad\quad\quad\quad\quad\quad\quad\quad[Eq.3]$$
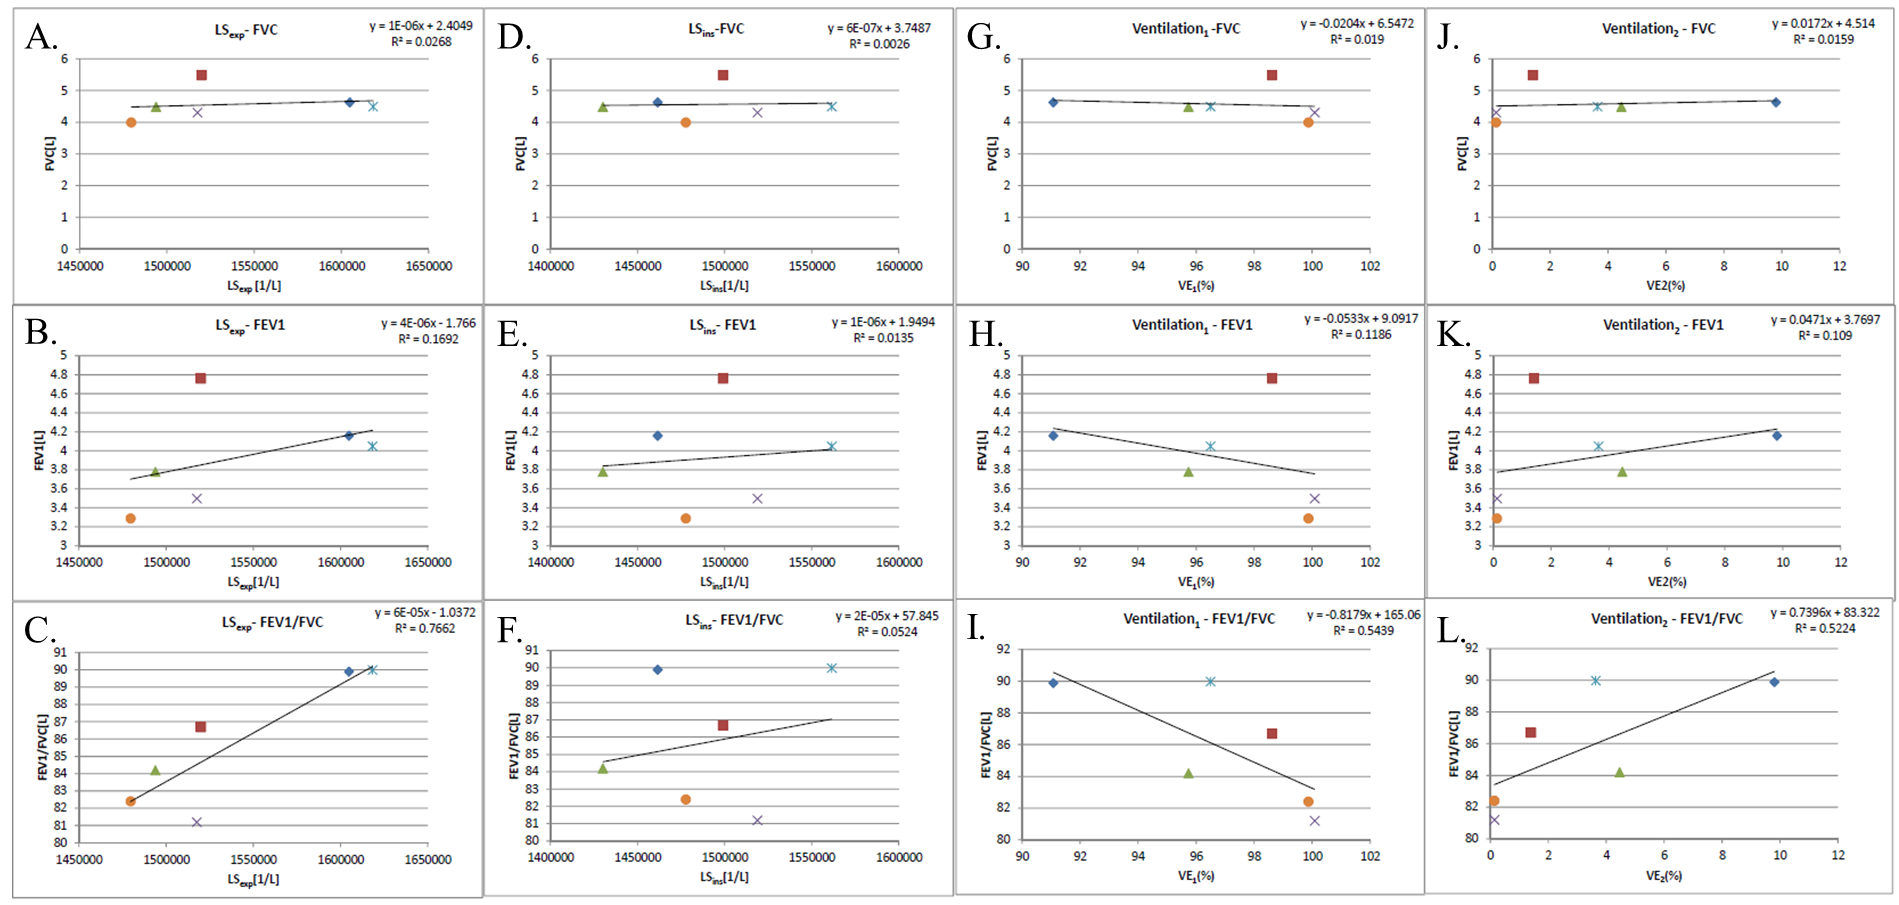
The values of LS at expiration and inspiration(LSexp and LSins)[Eq.1], VE1, and VE2 were calculated using Eqs.[1~3] and were plotted versus the values of FEV1, FVC, and FEV1/FVC from PFT measurements.
Results
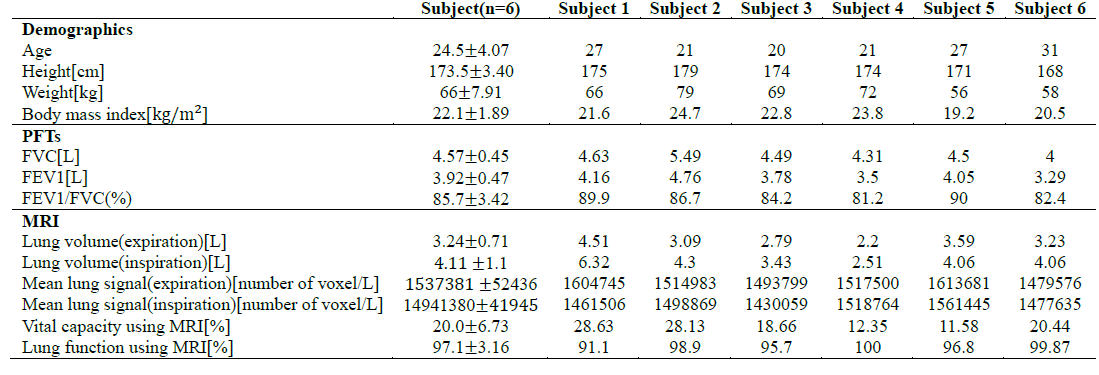
Table 2 presents the results of PFT measurements with demographic information as well as the quantitative values defined by Eqs.[1~3]. Figure 2 shows the 12 plots obtained from a possible combination of MR values and PFT values. Among them, only three plots(C,I,L) showed a linear correlation of statistical significance (R2>0.5). LSexp and FEV1/FVC showed a strong linear correlation(R2=0.7662). VE2 also showed a linear correlation with FEV1/FVC, but relatively weak one(R2=0.5224). In contrast, VE1 showed a weak inverse linear relationship with FEV1/FVC(R2=0.5439). It is interesting to note that only FEV1/FVC in PFT measurements seems to correlate with the MR values of LSexp,VE1,and VE2. While, considering the contrast of UTE imaging as a combination of T1 and proton-density weighting, LSexp relates to the density of alveoli in the lung parenchyma at expiration, FEV1/FVC represents the proportion of the vital capacity and is reduced due to the obstruction of air escaping from the lung. When we reasonably assume that the higher density of alveoli implies the higher pulmonary function especially in terms of ventilation function, the strong linear correlation between LSexp and FEV1/FVC can be explained.Discussion and Conclusion
In this study, we defined some quantitative values from lung MR images to probe the feasibility of evaluating pulmonary function by investigating the correlation with the PFT measurements. We found that the mean lung signal density at expiration(LSexp) has a strong linear correlation with the FEV1/FVC9,implying that it can be used as an alternative to FEV1/FVC when we evaluate the pulmonary function without any PFT data. In addition, we acquired 3D lung image for distribution of defect region and ventilation map. From a diagnostic standpoint, for example, it is expected that LSexp can be used to differentiate between obstructive pulmonary disease and restrictive pulmonary disease since FEV1/FVC decreases in the obstructive disease like COPD but barely changes in the restrictive disease. Despite some interesting results, the limitation of this preliminary study is clear: The number of subjects was too small for the statistically meaningful conclusion. A further study is warranted for a large cohort of subjects including the patients with obstructive and restrictive pulmonary diseases.Acknowledgements
This study was supported by National Research Foundation of Korea, NRF-2017R1A2B2004944, and NRF-2018-Global Ph.D. Fellowship Program.References
1. M. R. Miller, R. Crapo, J. Hankinson et al. General considerations for lung function testing. European Respiratory Journal 2005 26:153-161.
2. Bergin CJ, Pauly JM, Macovski A. Lung parenchyma : projection reconstruction MR imaging. Radiology. 1991;179(3):777-781.
3. Zapke M et al. Magnetic resonance lung function--a breakthrough for lung imaging and functional assessment? A phantom study and clinical trial. Respir Res. 2006 Aug 6;7:106.
4. L.Mendes Pereira et al. UTE‐SENCEFUL: first results for 3D high‐resolution lung ventilation imaging. Magn Reson Med. 2018;1–10.
5. J.Cai, J.C. Chu et al, CT and PET lung image registration and fusion in radiotherapy treatment planning using the chamfer-matching method. Int. J. Radiat. Oncol. Biol. Phys., 1999, vol. 43, no. 4, pp. 883–891,.
6. Park JY et al. Short echo-time 3D radial gradient-echo MRI using concurrent dephasing and excitation. Magn. Reson. Med. 2012; 67 (2): 428–436.
7. Jinil Park et al. A radial sampling strategy for uniform k-space coverage with retrospective respiratory gating in 3D ultrashort-echo-time lung imaging. NMR Biomed. 2016; 29: 576–587.
8. Jinil Park et al. A Robust Self-navigation for Respiratory Gating in 3D Radial Ultrashort Echo-time Lung MRI using Concurrent Dephasing and Excitation. Journal of the Korean Physical Society, Vol. 73, No. 1, July 2018, pp. 138∼144.
9. Ochs, Nyengaard, Jung, et al. The Number of Alveoli in the Human Lung. Am J Respir Crit Care Med. 2004 Jan 1;169(1):120-4.
Figures