1896
Feasibility of 3D PREFUL: 3D dynamic lung ventilation imaging, initial comparison to 2D PREFUL in healthy volunteers1Institute of Diagnostic and Interventional Radiology, Hannover Medical School, Hannover, Germany, 2Biomedical Research in Endstage and Obstructive Lung Disease Hannover (BREATH), German Centre for Lung Research (DZL), Hannover, Germany, 3Department of Radiology, University of Basel Hospital, Basel, Switzerland, 4Department of Biomedical Engineerings, University of Basel, Basel, Switzerland, 5Siemens Healthcare GmbH, Erlangen, Germany
Synopsis
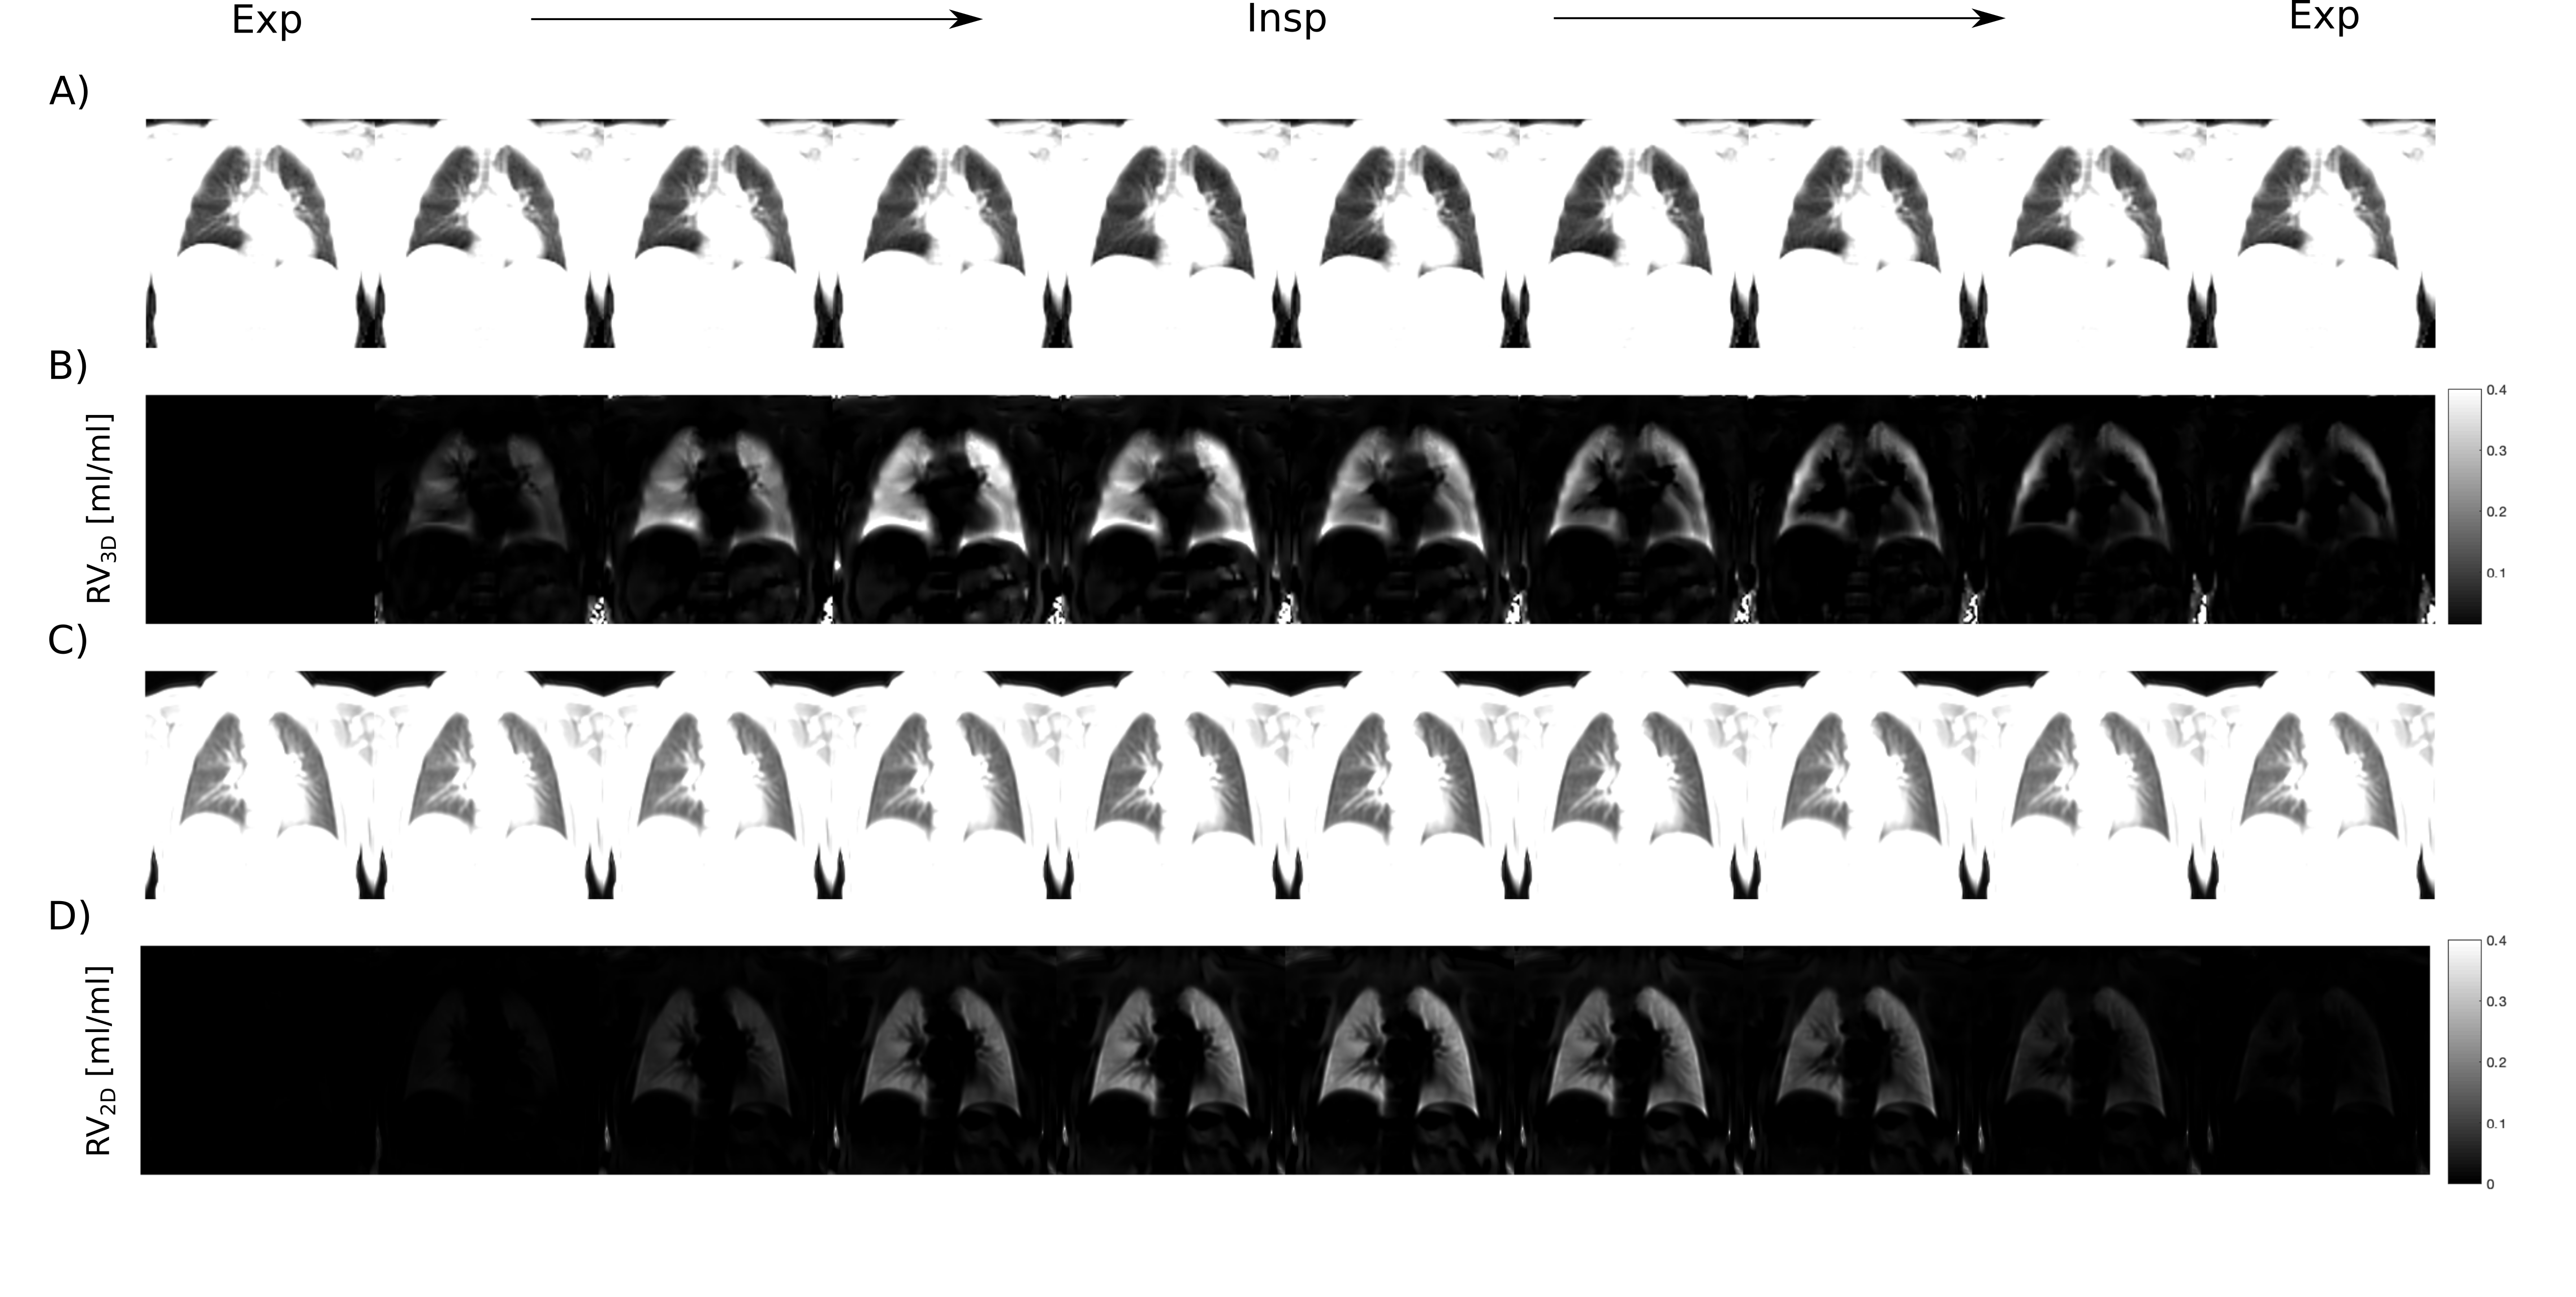
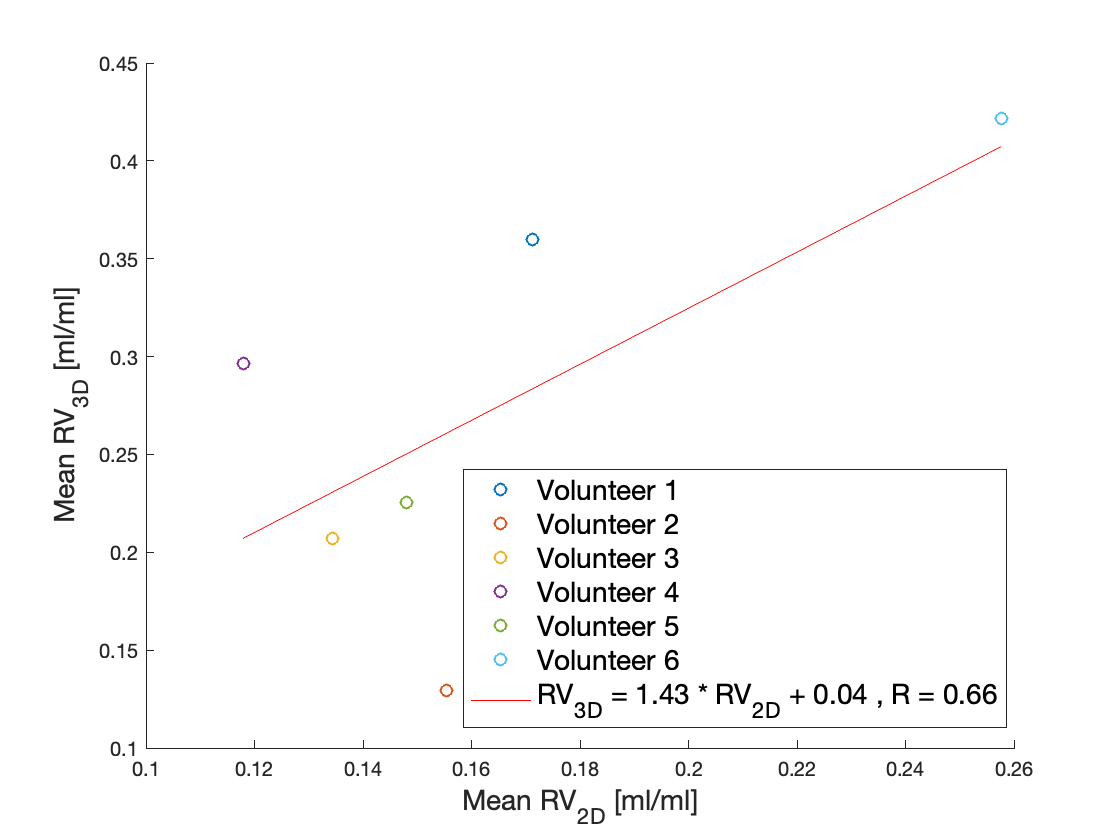
Pulmonary ventilation assessed by Fourier Decomposition (FD) is limited by its 2D acquisition and does not consider dynamics of ventilation. In this work, a method to assess dynamic lung ventilation in 3D using self-gating and phase-resolved functional lung imaging (PREFUL) is presented. The full respiratory cycle was reconstructed and dynamic regional ventilation (RV) maps were generated. Mean slice correlation and anterior-posterior gradient of ventilation values were compared between the 3D and the 2D PREFUL approaches. 3D PREFUL imaging was able to reconstruct dynamic imaging of the respiratory cycle, generate dynamic RV maps and provide good agreement with the 2D approach.
Introduction
Fourier Decomposition (FD)1 has been demonstrated to deliver quantitative measurement of pulmonary ventilation2,3. Recently, a 2D post-processing approach, phase-resolved functional lung imaging (PREFUL) was introduced in order to increase temporal resolution and gain quantitative regional information about perfusion and ventilation dynamics4. One limitation of PREFUL is its 2D acquisition, which is time demanding if the coverage of the whole lung volume is required. 3D self-navigated approaches were previously developed to decrease measurement times and to allow for quantification of lung ventilation5,6 however, ventilation dynamics was not assessed. The purpose of this work was to demonstrate the feasibility of 3D PREFUL measurement, to quantify dynamics of ventilation and to compare 3D PREFUL to 2D PREFUL.Methods
Results
Discussion
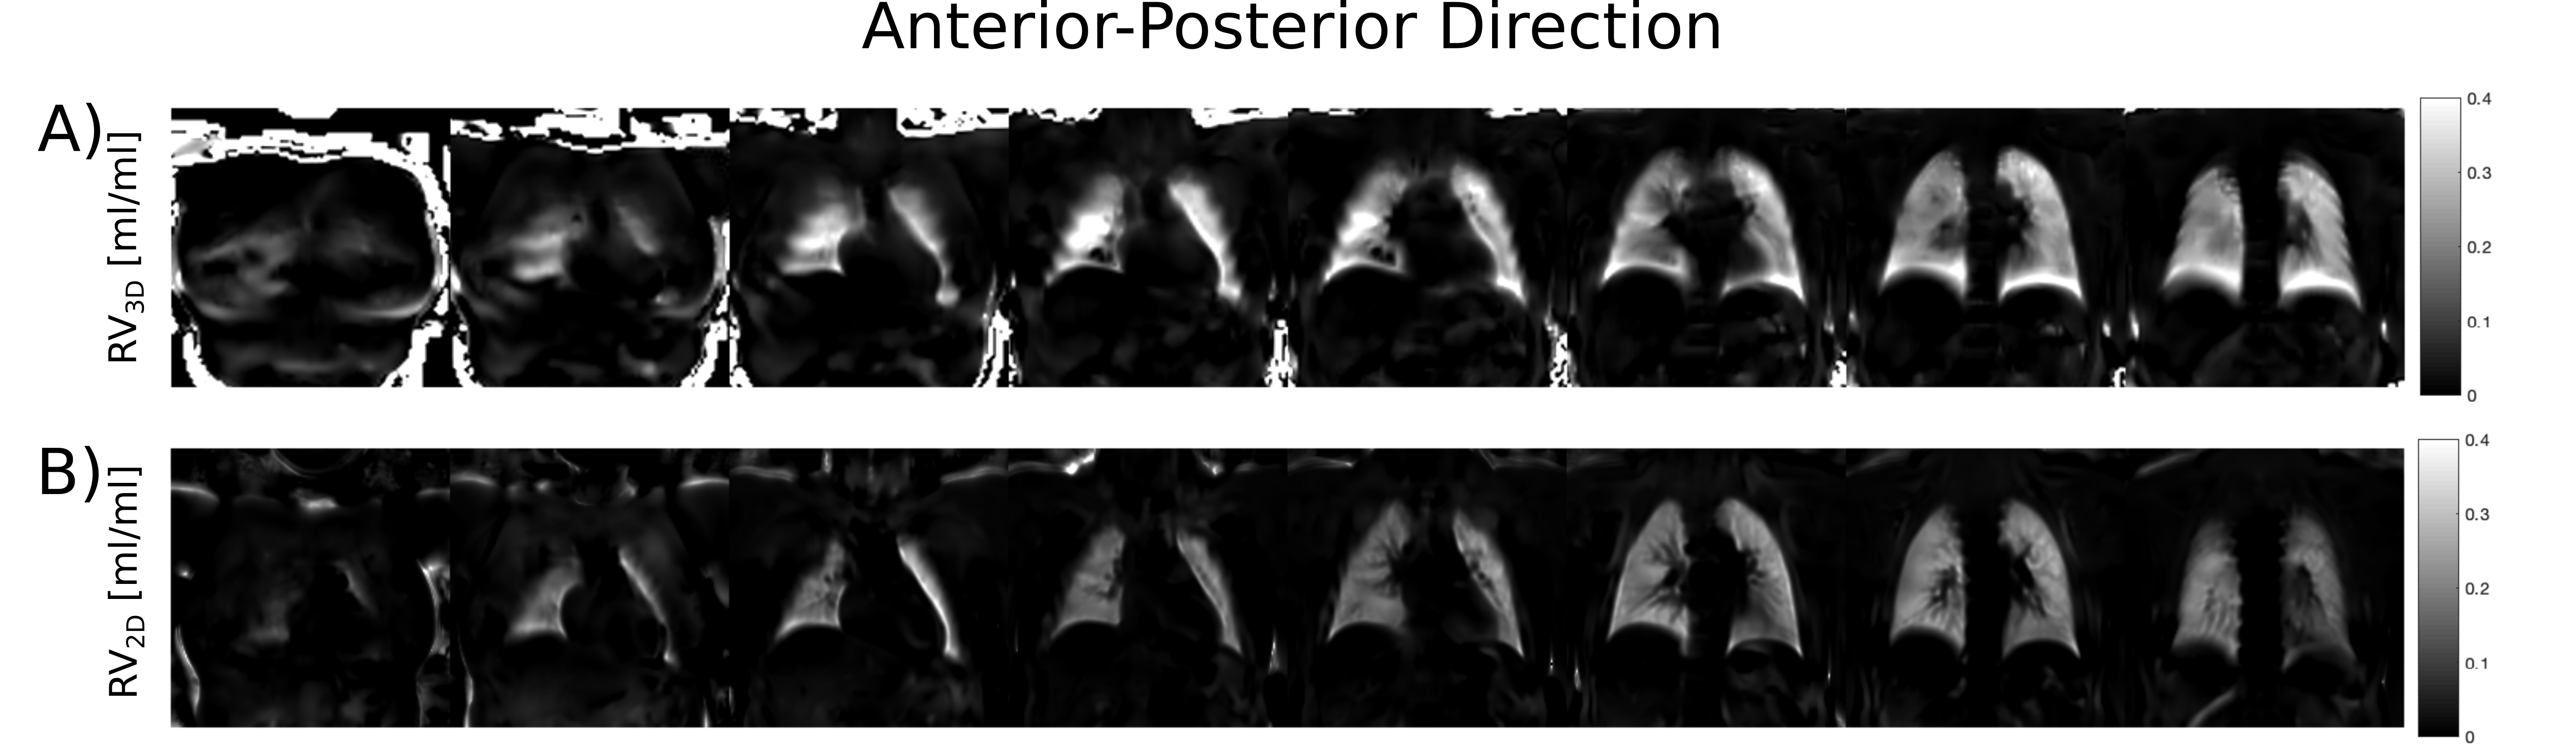
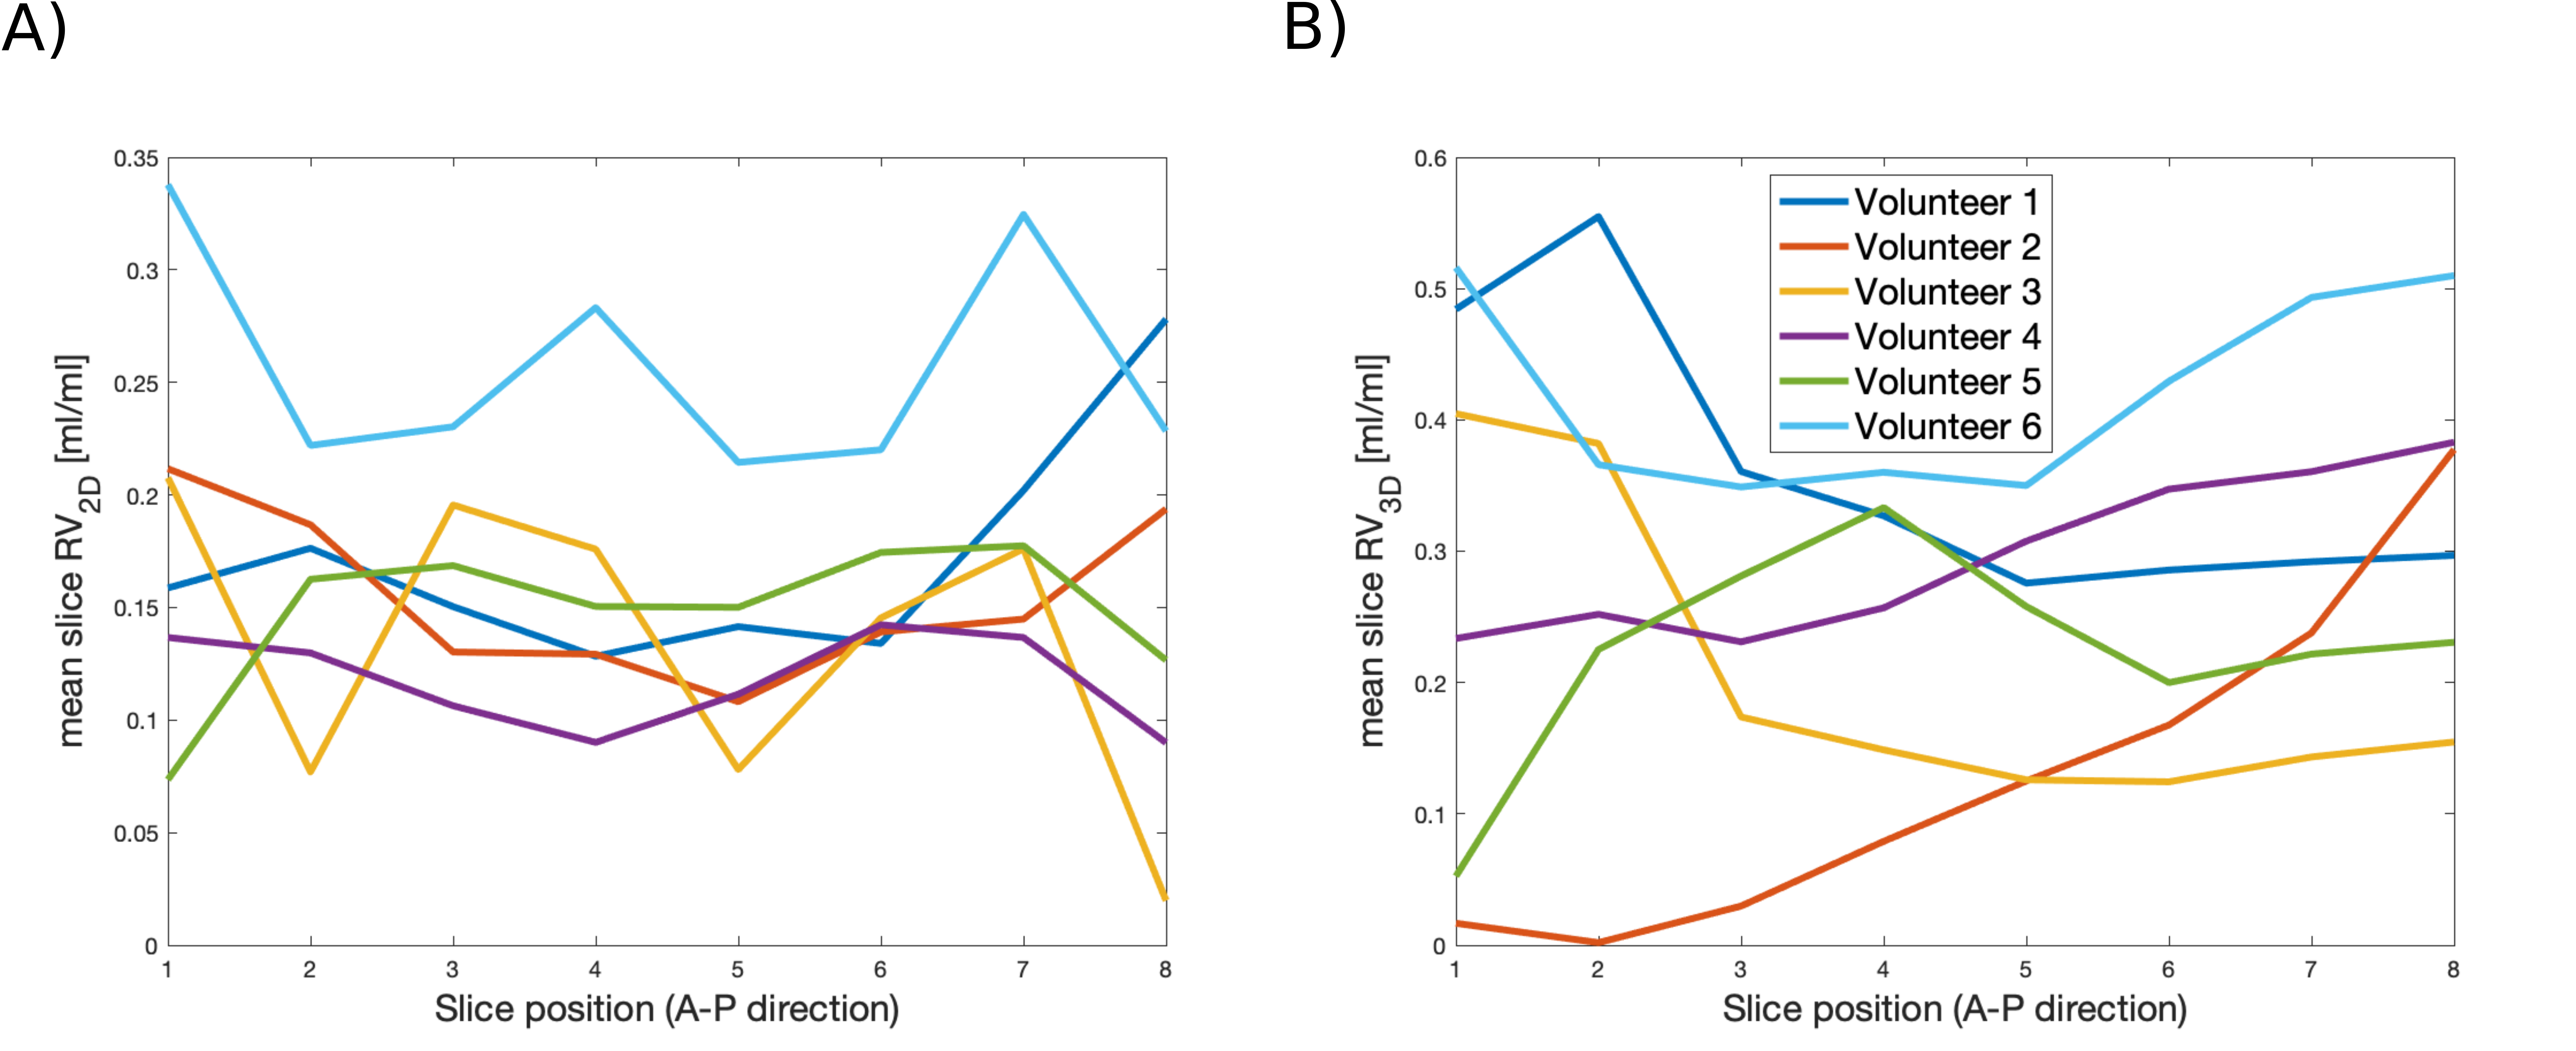
The novel 3D PREFUL technique was able to deliver quantitative information about lung ventilation with good agreement with the 2D PREFUL approach in six healthy volunteers. Increased RV values calculated using 3D PREFUL may be explained by lung motion, which is likely better captured with the 3D technique, and by the selection of spokes/images used for RV quantification. Variability of respiration during the 2D slice scans and partial-volume effects at the most anterior and posterior slices are probably the reason for the lack of a pronounced A-P ventilation gradient in 2D imaging. On the contrary, a smoother trend of ventilation distribution and a physiological A-P ventilation gradient was seen in three healthy volunteers with the 3D approach. However, image artifacts suggest that improvements in 3D registration and reduction of echo time are required to increase the image quality and to achieve a more accurate RV quantification of the 3D PREFUL approach.Conclusion
The 3D PREFUL approach represents an alternative technique to asses lung ventilation dynamics and may reduce the measurement time to three and a half minutes, which might be beneficial in clinical routine.Acknowledgements
This work was funded by the German Center for Lung Research (DZL) and supported by Siemens Healthcare GmbH. Furthermore, the authors would like to thank Agilo Kern, Arnd Obert and Lea Behrendt for postprocessing support and useful discussions.
References
1. Bauman G, Puderbach M, Deimling M, et al. Non-contrast-enhanced perfusion and ventilation assessment of the human lung by means of fourier decomposition in proton MRI. Magn Reson Med. 2009;62(3):656-664. doi:10.1002/mrm.22031.
2. Zapke M, Topf H-G, Zenker M, et al. Magnetic resonance lung function – a breakthrough for lung imaging and functional assessment? A phantom study and clinical trial. Respir Res. 2006;7(1):106. doi:10.1186/1465-9921-7-106.
3. Kjørstad Å, Corteville DMR, Henzler T, et al. Quantitative lung ventilation using Fourier decomposition MRI; comparison and initial study. Magn Reson Mater Physics, Biol Med. 2014;27(6):467-476. doi:10.1007/s10334-014-0432-9.
4. Voskrebenzev A, Gutberlet M, Klimeš F, et al. Feasibility of quantitative regional ventilation and perfusion mapping with phase-resolved functional lung (PREFUL) MRI in healthy volunteers and COPD, CTEPH, and CF patients. Magn Reson Med. 2017;00(May):1-9. doi:10.1002/mrm.26893.
5. Voskrebenzev A, Gutberlet M, Wacker F, et al. 3D Lung Ventilation 1H Imaging Using a Respiratory Self-Navigated Stack-of-Stars Sequence in Comparison to 2D Fourier Decomposition. Proc Intl Soc Mag Reson Med 24. 2016:2913.
6. Pereira LM, Weng AM, Wech T, et al. UTE-SENCEFUL: high resolution 3D ventilation weighted maps. Proc Intl Soc Mag Reson Med 26. 2018:2466.
7. Bauman G, Pusterla O, Bieri O. Ultra-fast Steady-State Free Precession Pulse Sequence for Fourier Decomposition Pulmonary MRI. Magn Reson Med. 2016;75(4):1647-1653. doi:10.1002/mrm.25697.
8. Feng L, Axel L, Chandarana H, Block KT, et al. XD-GRASP: Golden-angle radial MRI with reconstruction of extra motion-state dimensions using compressed sensing. Magn Reson Med. 2016;75(2):775-788. doi:10.1002/mrm.25665.
9. Uecker M, Ong F, Tamir J, et al. Berkeley Advanced Reconstruction Toolbox. Proc Intl Soc Mag Reson Med 23. 2015:2486.
10. Voskrebenzev A, Gutberlet M, Kaireit TF, et al. Low-pass imaging of dynamic acquisitions (LIDA) with a group-oriented registration (GOREG) for proton MR imaging of lung ventilation. Magn Reson Med. 2017;78(4):1496-1505. doi:10.1002/mrm.26526.
11. Avants BB, Tustison NJ, Song G, et al. A reproducible evaluation of ANTs similarity metric performance in brain image registration. Neuroimage. 2011;54(3):2033-2044. doi:10.1016/j.neuroimage.2010.09.025.
12. Klimes F, Voskrebenzev A, Gutberlet M, et al. Correction for Ventilation Quantification Errors due to Registration in Pulmonary Lung MRI Fourier Decomposition. Proc Intl Soc Mag Reson Med 26. 2018:4358.
Figures