1892
Comparison of Capabilities for Pulmonary Functional Loss Evaluation and Clinical Stage Classification between 3D Oxygen-Enhanced MRI at 3T System and Thin-Section CT in Smokers1Division of Functional and Diagnostic Imaging Research, Department of Radiology, Kobe University Graduate School of Medicine, Kobe, Japan, 2Advanced Biomedical Imaging Research Center, Kobe University Graduate School of Medicine, Kobe, Japan, 3Canon Medical Systems Corporation, Otawara, Japan, 4Center for Radiology and Radiation Oncology, Kobe University Hospital, Kobe, Japan, 5Division of Radiology, Department of Radiology, Kobe University Graduate School of Medicine, Kobe, Japan
Synopsis
Recently, 3D O2-enhanced MRI at 3T system is recently developed by Cannon Medical Systems Corporation. On the other hands, no one directly compare this technique with quantitatively assessed CT for smoking-related COPD assessment. We hypothesized that 3D O2-enhanced MRI has a potential for quantitative assessment of morphological changes due to smoking-related COPD as well as quantitatively assessed thin-section CT. The purpose of this study was to prospectively and directly compare the quantitative capability for pulmonary functional loss assessment and clinical stage classification between 3D O2-enhanced MRI and thin-section CT in smokers.
Introduction
CT and nuclear medicine ventilation and/or perfusion studies are useful for the evaluation of morphological changes or regional pulmonary functional changes in smoking-related chronic obstructive pulmonary diseases. Since early 2000s, oxygen-enhanced MR imaging (O2-enhanced MRI) as well as hyperpolarized noble gas MR imaging have been suggested as useful for assessing COPD based on academic and clinical purposes. Based on past reports (1-3), it has been reported that O2-enhanced MRI has been suggested as having the potential for not only ventilation, but also oxygen diffusion at alveoli, and useful for regional ventilation assessment in smoking-related COPD. However, the one of the drawbacks on O2-enhanced MRI was 2D acquisition at 3 different planes, time consuming and no appropriate sequences at 3T system. Recently, 3D O2-enhanced MRI at 3T system is recently developed by Cannon Medical Systems Corporation. On the other hands, no one directly compare this technique with quantitatively assessed CT for smoking-related COPD assessment.
We hypothesized that 3D O2-enhanced MRI has a potential for quantitative assessment of morphological changes due to smoking-related COPD as well as quantitatively assessed thin-section CT. The purpose of this study was to prospectively and directly compare the quantitative capability for pulmonary functional loss assessment and clinical stage classification between 3D O2-enhanced MRI and thin-section CT in smokers.
Materials and Methods
20 consecutive smokers (12 men and 8 women; mean age 72 years <age rang 56-85 years>) underwent pulmonary thin-section MRI with ultra-short TE, 3D O2-enhanced MRI, thin-section CT and pulmonary function test (FEV1/FVC%, %FEV1, %VC and %DLCO/VA). According to the GOLD guideline, all smokers were classified into four stages as follows: ‘Without COPD’ (n=3), ‘Mild COPD’ (n=3), ‘Moderate COPD’ (n=10) and ‘Severe or very severe COPD’ (n=4). All radiological examination and pulmonary function test were performed within 7 days (mean duration: 1.3±0.6 days). In each smoker, 3D O2-enhanced MRI was obtained by 3D Fast Field Echo pulse sequence with multiple flip angle technique (TR 3.0 ms/ TE 1.1 ms, flip angle 2, 6, 10 and 14 degrees, SPEEDER factor= 2.0, section thickness 7.5 mm×18 slices or 10 mm×24 slices) with breath holding at end-inspiration at each flip angle acquisition. All O2-enhanced MRI data were fused with pulmonary thin-section MRI with ultra-short TE and analyzed by our proprietary software provided by Canon Medical. With non-rigged registration software, regional T1 value change map was generated between room air and 100% oxygen inhalation after 3 minutes from O2-enhanced MR data by pixel by pixel analyses. Then, ROIs were placed over the lung on all slices, and averaged to determine mean T1 value change (ΔT1) in each subject. On quantitatively assessed CT, percentage of low attenuation area within entire lung (LAA%) was also measured by commercially available software.
To compare the capability for pulmonary functional loss assessment, mean ΔT1 change from 3D O2-enhanced MRI and %LAA were correlated with pulmonary function parameters (FEV1/FVC%, %FEV1, %VC and %DLCO/VA). For evaluation of capability for clinical stage classification, each index was compared within clinical stages by Tukey’s HSD test. To determine the capability for distinguishing each GOLD stage, discrimination analyses were performed, and accuracy was compared among all methods by McNemar’s test.
Results
Representative case is shown in Figure 1. Correlations between each pulmonary functional parameter and both indexes (mean ΔT1: -0.85<r<-0.68, %LAA: -0.76<r<-0.62). Result of comparison of each index among GOLD classifications is shown in Figure 2. Mean ΔT1 had significant difference between “Severe or very severe COPD” and other groups (p<0.05), although %LAA had significant difference between “Severe or very severe COPD” and “Without COPD” (p<0.05) and between “Severe or very severe COPD” and “Mild COPD” (p<0.05). Results of discrimination analysis for GOLD stage classification is shown in Figure 3. Accuracy of %LAA (40 [8/20]%) was significantly lower than that of mean ΔT1 (70 [14/20]%, p=0.03) and %LAA (70 [14/20]%, p=0.03).Conclusion
3D O2-enhanced MRI at 3T system has a potential for pulmonary functional loss assessment and clinical stage evaluation in smokers, and can be applicable in routine clinical practice, although further improvement and evaluation are warranted.Acknowledgements
No acknowledgement found.References
1. Ohno Y, Hatabu H, Takenaka D, et al. Magn Reson Med. 2002 ; 47(6):1139-1144.
2. Ohno Y, Iwasawa T, Seo JB, et al. Am J Respir Crit Care Med. 2008; 177(10): 1095-1102.
3. Fuseya Y, Muro S, Sato S, et al. PLoS One. 2018; 13(8): e0203273.
Figures
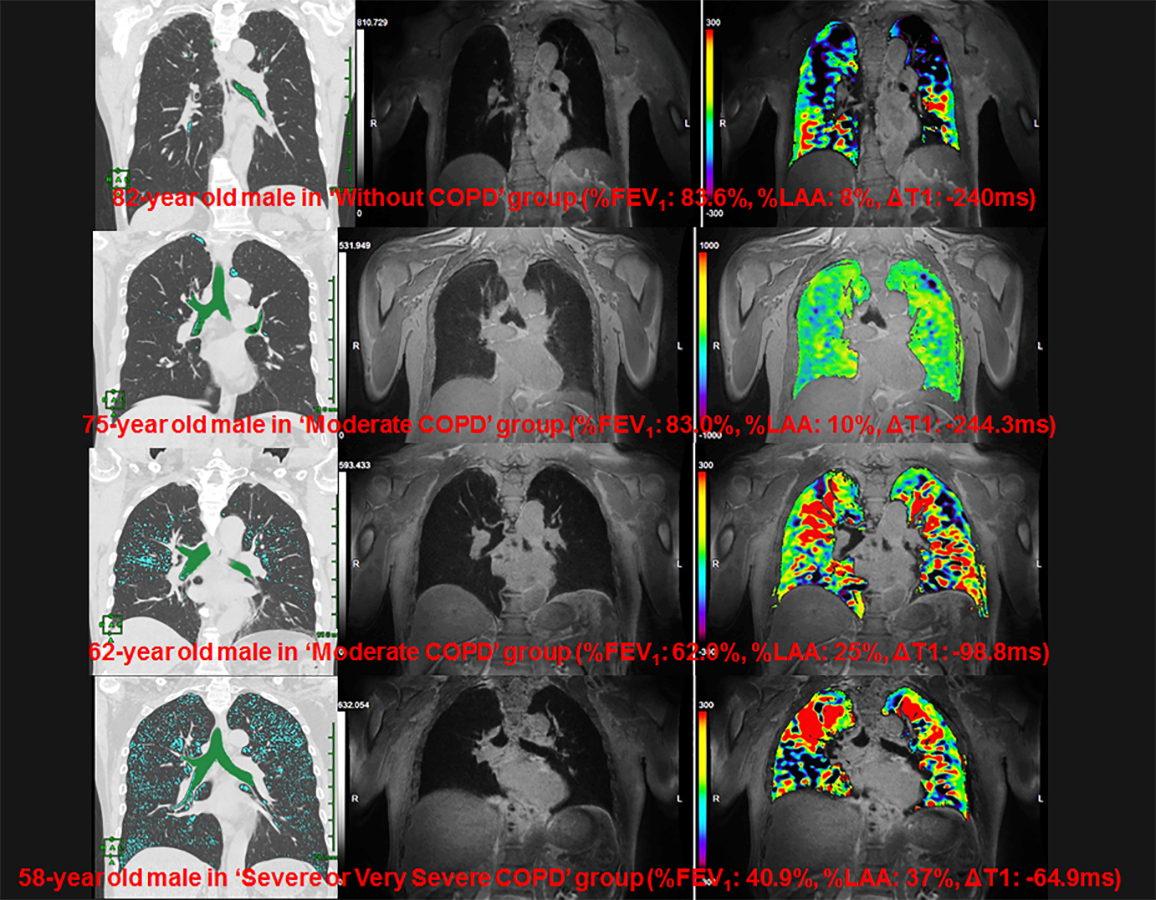
Figure 1. Representative cases of 3D O2-enhanced MRI
From top to low lines (L to R : quantitative CT, pulmonary MRI with ultra-short TE and ΔT1 map fused with MRI with ultra-short TE) show “Without COPD”, “Mild COPD”, “Moderate COPD” and “Severe or very severe COPD”. ΔT1 is prolonged according to severity of COPD.
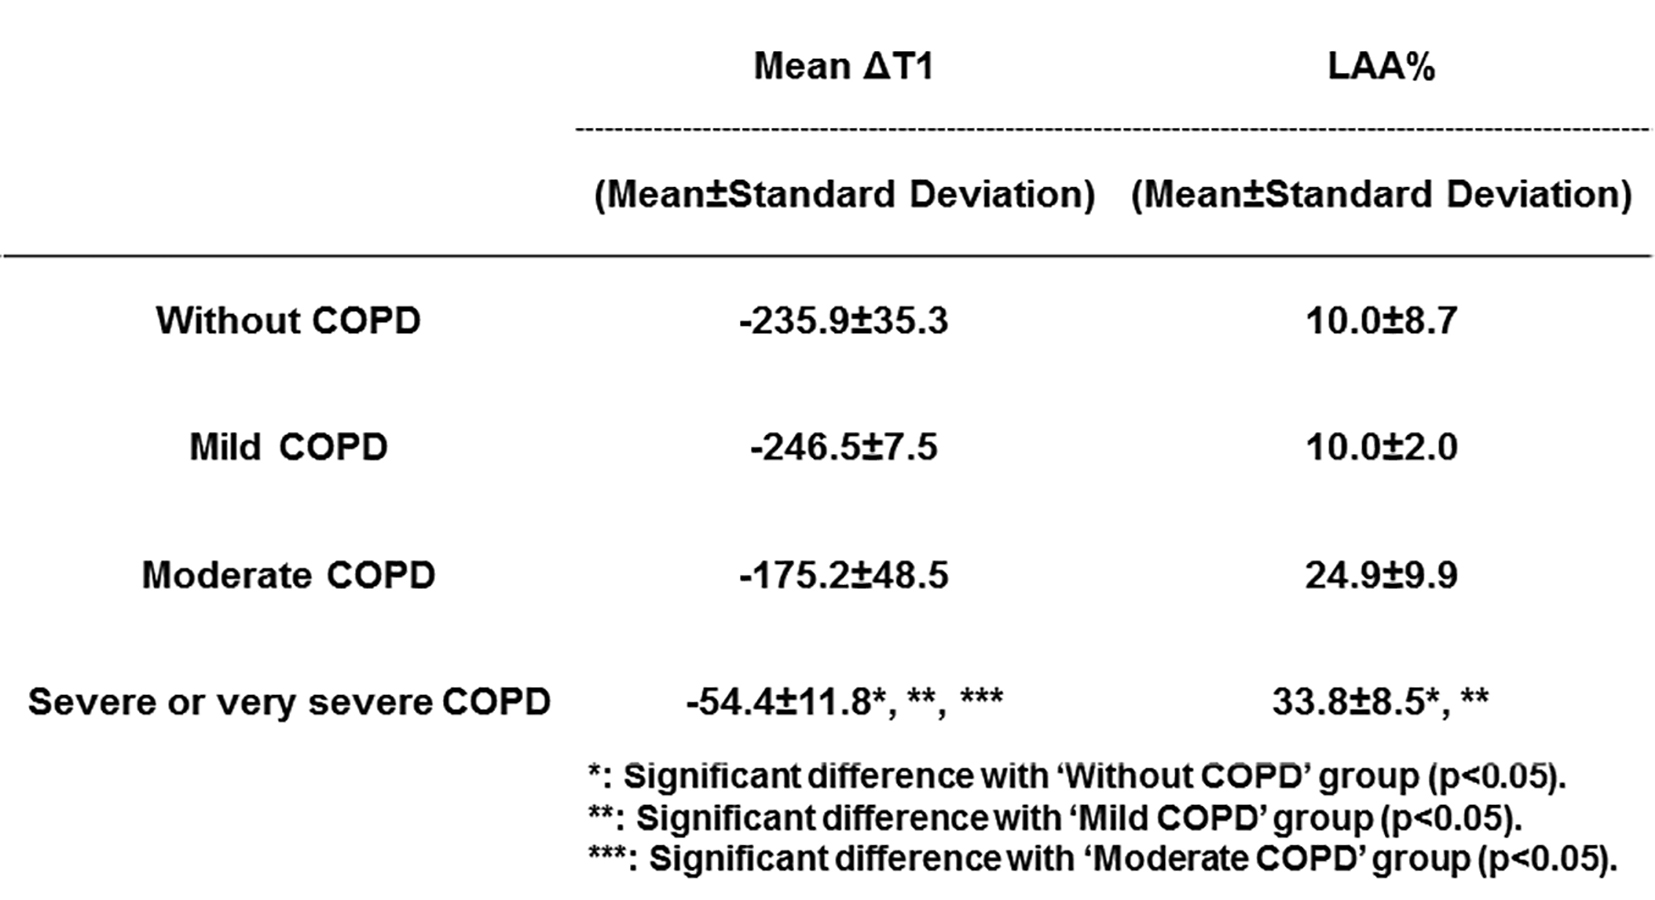
Figure 2. Result of comparison of each index among GOLD classification. Mean ΔT1 had significant difference between “Severe or very severe COPD” and other groups (p<0.05). However, %LAA had significant difference between “Severe or very severe COPD” and “Without COPD” (p<0.05) and between “Severe or very severe COPD” and “Mild COPD” (p<0.05).
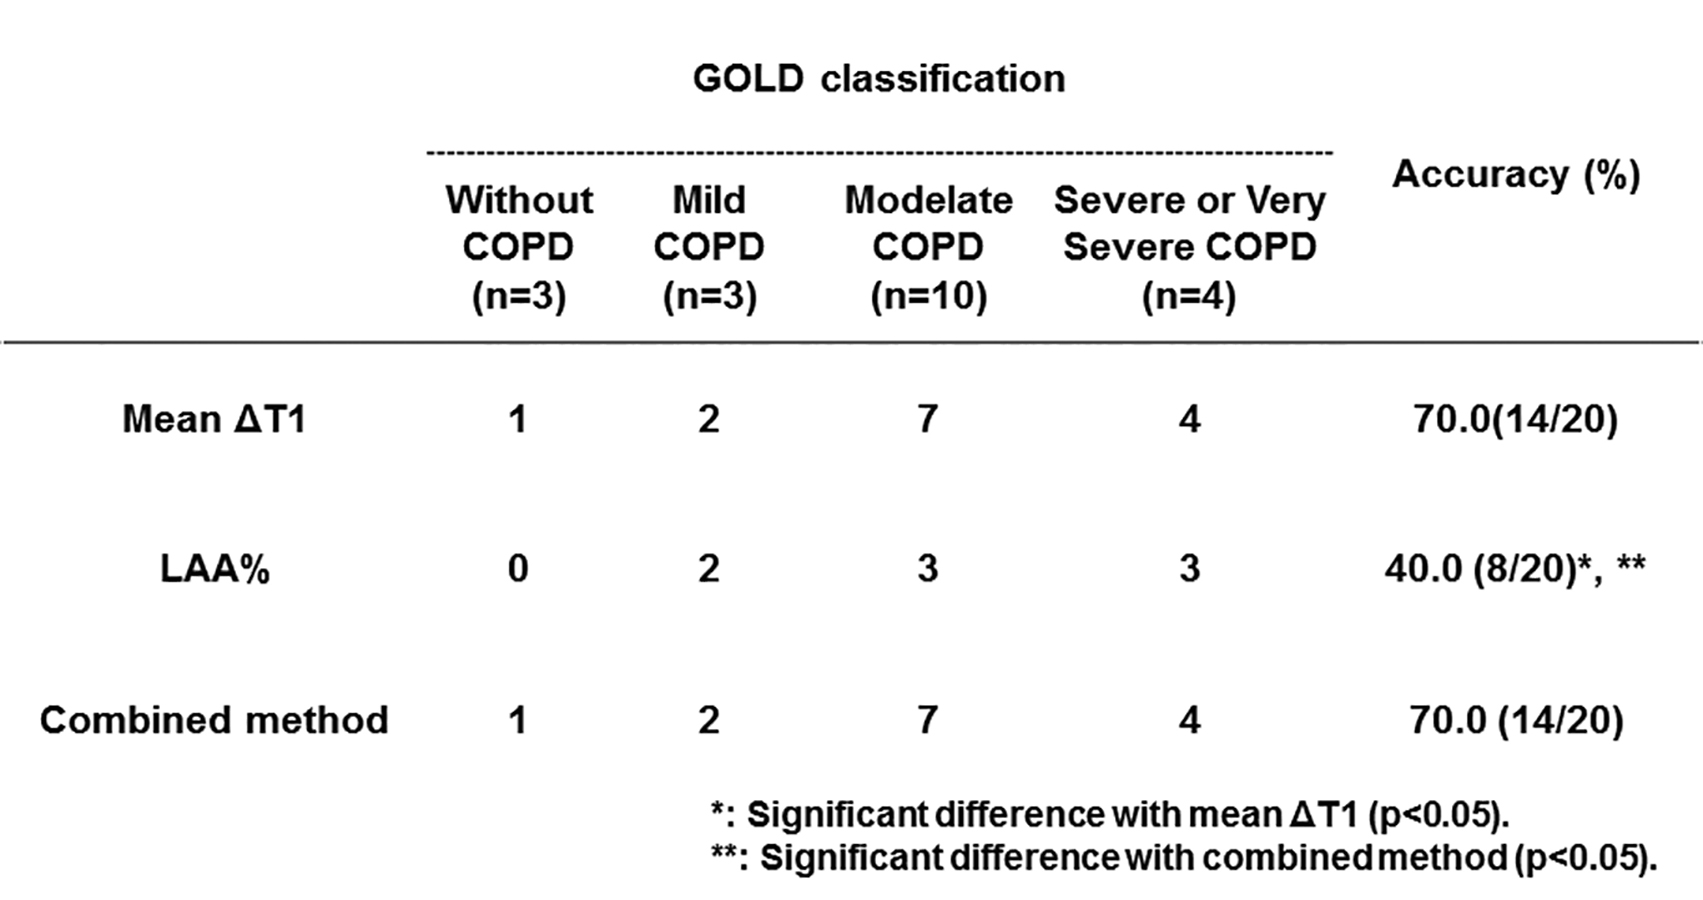
Figure 3. Results of discrimination analysis for GOLD stage classification.
Accuracy of %LAA (40 [8/20]%) was significantly lower than that of mean ΔT1 (70 [14/20]%, p=0.03) and %LAA (70 [14/20]%, p=0.03).