1891
Joint Reconstruction of 1H and 19F gas MRI in the Human Lung1Institute for Diagnostic and Interventional Radiology, Hannover Medical School, Hannover, Germany, 2Biomedical Research in Endstage and Obstructive Lung Disease Hannover (BREATH), German Center for Lung Research (DZL), Hannover, Germany, 3Siemens Healthcare, Erlangen, Germany
Synopsis
Due to its low costs, high inertness and applicability at thermal polarization, fluorinated gases are promising tracers for imaging lung ventilation using fluorine magnetic resonance imaging. In this work, the joint reconstruction of proton density and 19F ventilation images in the human lung is shown. To exploit the structural similarity of both imaging modalities, a regularized reconstruction is used, minimizing the parallel level sets. Quantitative analysis of the reconstruction performance could be achieved by retrospective undersampling of data collected during a 2.5-minute breath hold. Furthermore, computation of VDP maps has been analyzed using joint reconstruction in three COPD patients.
Background
Due to the low spin density of gaseous perfluoropropane (C3F8) and the limited acquisition time of one breath hold, 19F magnetic resonance (MR) lung imaging naturally lacks high signal-to-noise ratio (SNR). However, additional anatomical information of the examined subject can be gained by 1H MR imaging during another breath hold. Therefore, the purpose of this work was to reduce the acquisition time of pulmonary 19F gas MRI by joint reconstruction of 19F and 1H MRI of the lung while maintaining an acceptable image quality. The basic concepts used in this reconstruction have been presented by Ehrhardt et al.1 on the basis of theoretical PET-MRI images. Here, Ehrhardt’s fundamentals were applied to ventilation 19F MRI.Method
In this study, one healthy volunteer and three COPD patients were examined on a 1.5 T scanner (MAGNETOM Avanto, Siemens Healthcare, Erlangen, Germany). Each participant inhaled a mixture of 79% fluorinated gas (C3F8) and 21% oxygen. Within one inspiratory breath hold, 19F pulmonary gas MRI and 1H low-resolution (LR) morphologic imaging were performed using a transmit and receive coil dedicated to the 19F frequency. For the 19F image, a prototype 3D gradient echo sequence with golden-angle stack-of-stars k-space encoding was utilized, while 1H images were obtained using cartesian 3D gradient echo imaging. Short scan time and the usage of the 19F coil for 1H imaging led to low SNR in the 1H image. Thus, high-resolution (HR) 1H imaging was performed in a separate breath hold with a coil dedicated for the 1H frequency. Imaging parameters can be found in table 1. The HR 1H images were registered to the LR 1H images using ANTS2.
To improve the image quality of 19F MRI, the structural similarity between 1H and 19F imaging was exploited in the reconstruction. Parallel level sets (PLS) $$\textrm{PLS}(u,v) = \int_{\Omega} d_{\varphi, \psi}\left(\nabla u, \nabla v\right)$$ were used as a measure for parallelism of the gradients of 19F and 1H images $$$u$$$ and $$$v$$$ in the image domain $$$\Omega$$$ using the distance measure1: $$ d_{\varphi, \psi}(x,y) = \varphi\left(\psi \left( |x| |y| \right) - \psi \left( | \langle x, y \rangle |\right) \right)$$ In the case of quadratic parallel level sets used in this work, the arbitrary functions $$$\varphi$$$ and $$$\psi$$$ are defined by $$$\varphi(x) = \sqrt{1+x}$$$ and $$$\psi(x) = x^2$$$.3
Firstly, 19F images were computed using a generalized parallel imaging and compressed sensing (PICS) reconstruction from the BART toolbox, regularized by the total variation (TV) in two spatial dimensions4. Then, the joint reconstruction using PLS as penalty term was applied to these images and the HR 1H images using a quasi-Newton method1.
To examine the performance of the joint reconstruction, an additional 19F data set of 104 radial spokes and 20 averages was acquired using the radial stack-of-stars sequence in a single breath hold of approximately 2.5 minutes in an endurance athlete. The discrepancy between images of retrospectively undersampled data, computed with joint reconstruction and fully sampled data, computed with PICS reconstruction, was measured using the root mean square error (RMSE).
To verify the reconstruction performance in three COPD patients, volume defect percentage (VDP) maps were computed from 19F ventilation images using Otsu’s method5. Maps of retrospectively undersampled data, computed with joint reconstruction and fully sampled data, computed with PICS reconstruction, were compared. The accordance of the maps was measured using the Sørensen-Dice coefficient6.
Results
For the 2.5-minute breath hold, reconstructions using the full data, only the first 12 seconds (32 spokes, 6 NEX) and only the first 3 seconds (12 spokes, 4 NEX) are shown in figure 1. The dependence of the RMSE on the number of spokes and averages when using joint reconstruction is shown in figure 2. Using 12 spokes and 4 NEX, corresponding to an acquisition time of 3 seconds, leads to an acceptable image quality.
For the three COPD patients, the dependence of the Sørensen-Dice coefficient on the number of spokes and averages of the joint reconstruction is shown in figure 3. Data containing 8 spokes and 4 NEX, corresponding to an acquisition time of 2 seconds, provide Sørensen-Dice coefficients between 0.81 and 0.83. As an example, the good agreement of ventilation images and VDP maps using PICS reconstruction and joint reconstruction is shown in figure 4.
Discussion and Conclusion
One major drawback of 19F ventilation MR imaging is the low SNR resulting in low resolution. The presented joint reconstruction may help reduce the scan time by a factor of 4 to 6 without a significant loss of image quality. Alternatively, this reconstruction may be used to increase the spatial resolution at identical scan time, which may allow the detection of even small ventilation defects without the need of hyperpolarized gases or ionizing radiation.Acknowledgements
This work was funded by the German Center for Lung Research (DZL). Furthermore, the authors thank Matthias Ehrhardt for providing his code, Martin Uecker for BART hints, Agilo Kern and Filip Klimeš for support in postprocessing, as well as Frank Schröder and Lars Kähler for experimental assistance.References
1. Ehrhardt MJ, Thielemans K, Pizarro L, et al. Joint reconstruction of PET-MRI by exploiting structural similarity. Inverse Probl. 2015;31(1).
2. Avants BB, Tustison N, Song G. Advanced normalization tools (ANTS). Insight j 2. 2009:1-35.
3. Ehrhardt MJ, Arridge SR. Vector-valued image processing by parallel level sets. IEEE Trans Image Process. 2014;23(1):9-18.
4. Uecker M, Ong F, Tamir JI, et al. Berkeley advanced reconstruction toolbox. Proc Intl Soc Mag Reson Med. 2015;23:2486.
5. Otsu N. A threshold selection method from gray-level histograms. IEEE Trans Syst Man Cybern. 1979;9(1):62-66.
6. Sørensen T. A method of establishing groups of equal amplitude in plant sociology based on similarity of species and its application to analyses of the vegetation on Danish commons. Biol Skr. 1948;5:1-34.
Figures

Figure 1: Tracheal slice of 19F ventilation imaging of an endurance athlete;
(a) PICS reconstruction of a 2.5-minute breath hold used as ground truth
(b) PICS reconstruction of a 12-second breath hold (32 spokes, 6 NEX)
(c) Joint reconstruction of a 12-second breath hold (32 spokes, 6 NEX)
(d) Joint reconstruction of a 3-second breath hold (12 spokes, 4 NEX)
(e-g) RMSE of reconstructions (b-c) vs. the ground truth (a)
Note the decrease of noise and the increase of image sharpness for the joint reconstructions.


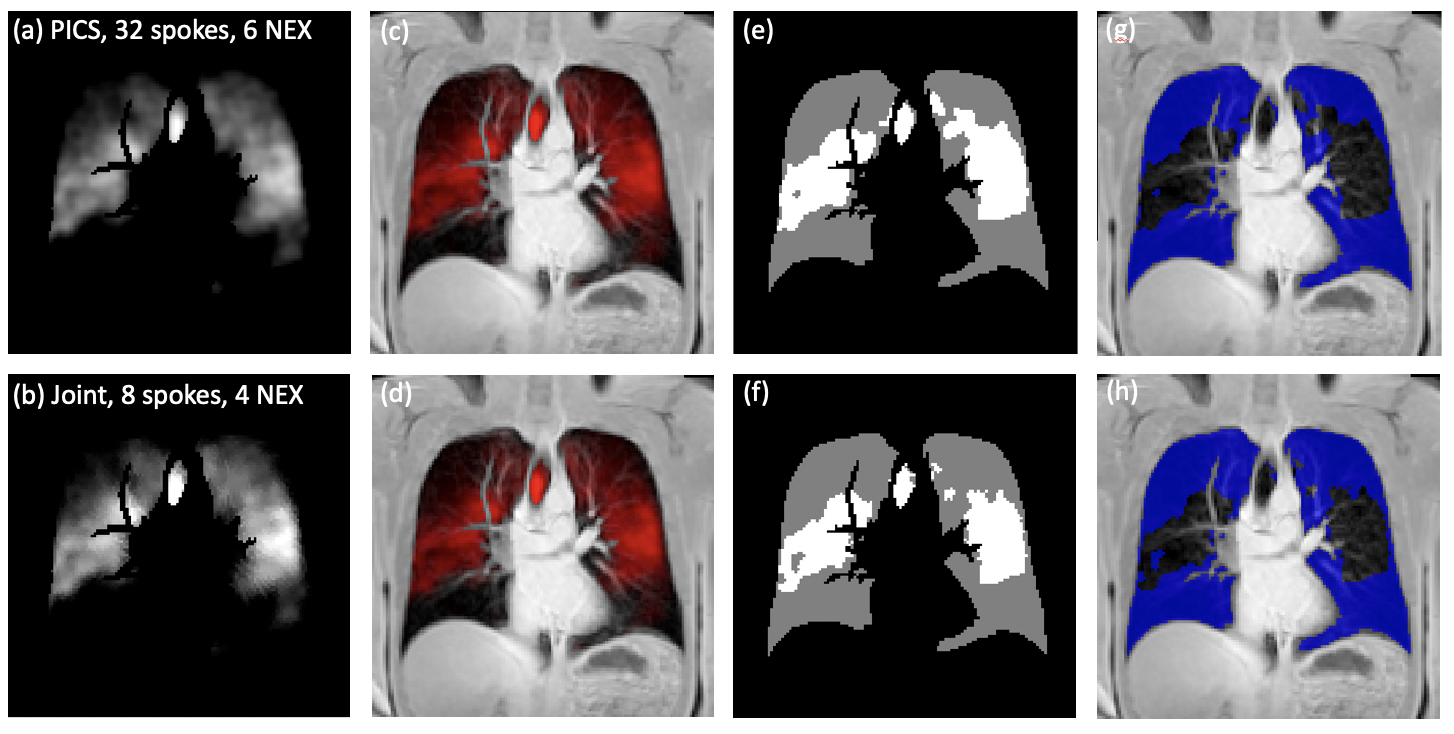
Figure 4: Tracheal slice of a 19F ventilation image and VDP maps of a COPD patient;
(a) PICS reconstruction of full data set (32 spokes, 6 NEX, 12 s acquisition time)
(b) Joint reconstruction of undersampled data (8 spokes, 4 NEX, 2 s acquisition time)
(c + d) Superposition of 19F and 1H image
(e + f) VDP maps with defects in gray and ventilated areas in white, created with Otsu’s method5. The Sørensen-Dice coefficient between (e) and (f) is 0.81
(g + h) Superposition of lung morphology and ventilation defects in blue.
