1889
Common misconceptions about pulmonary oxygen enhanced MRI1Medical radiation physics, Translational Medicine, Malmö, Sweden
Synopsis
There are several common misconceptions about pulmonary oxygen enhanced MRI. Most importantly, the relaxivity of molecular oxygen is, like other contrast agents, macromolecule dependent and not static. Moreover, the signal from the lung results from both oxygenated and non-oxygenated blood, where the oxygen enhancement effect will work to both shorten and elongate blood T1. The resultant relaxation enhancement primarily reflect blood partitioning. Finally, oxygen enhanced MRI has been shown to correlate with diffusing capacity in the lung, but this is only in severe disease. Rather, pulmonary shunt is the main determinant of arterial oxygenation and will affect the relaxation enhancement.
Introduction
Pulmonary oxygen enhanced (OE-) MRI utilizes the paramagnetic effects of dissolved oxygen to generate contrast enhanced ventilation images. An early report established that OE-MRI reflect the diffusing capacity of the lung for CO (DL,CO) [1],but this was later shown to not apply to a healthy population [2]. Despite being liberally employed in various cohorts, the interpretation and understanding of the OE-effect seem to be severely hampered in several respects. This abstract aims to clarify some very basic physiological and physical determinants of the oxygen enhancement effect as quantified by ΔR1.
Oxygen paramagnetic relaxivity varies with macromolecule content
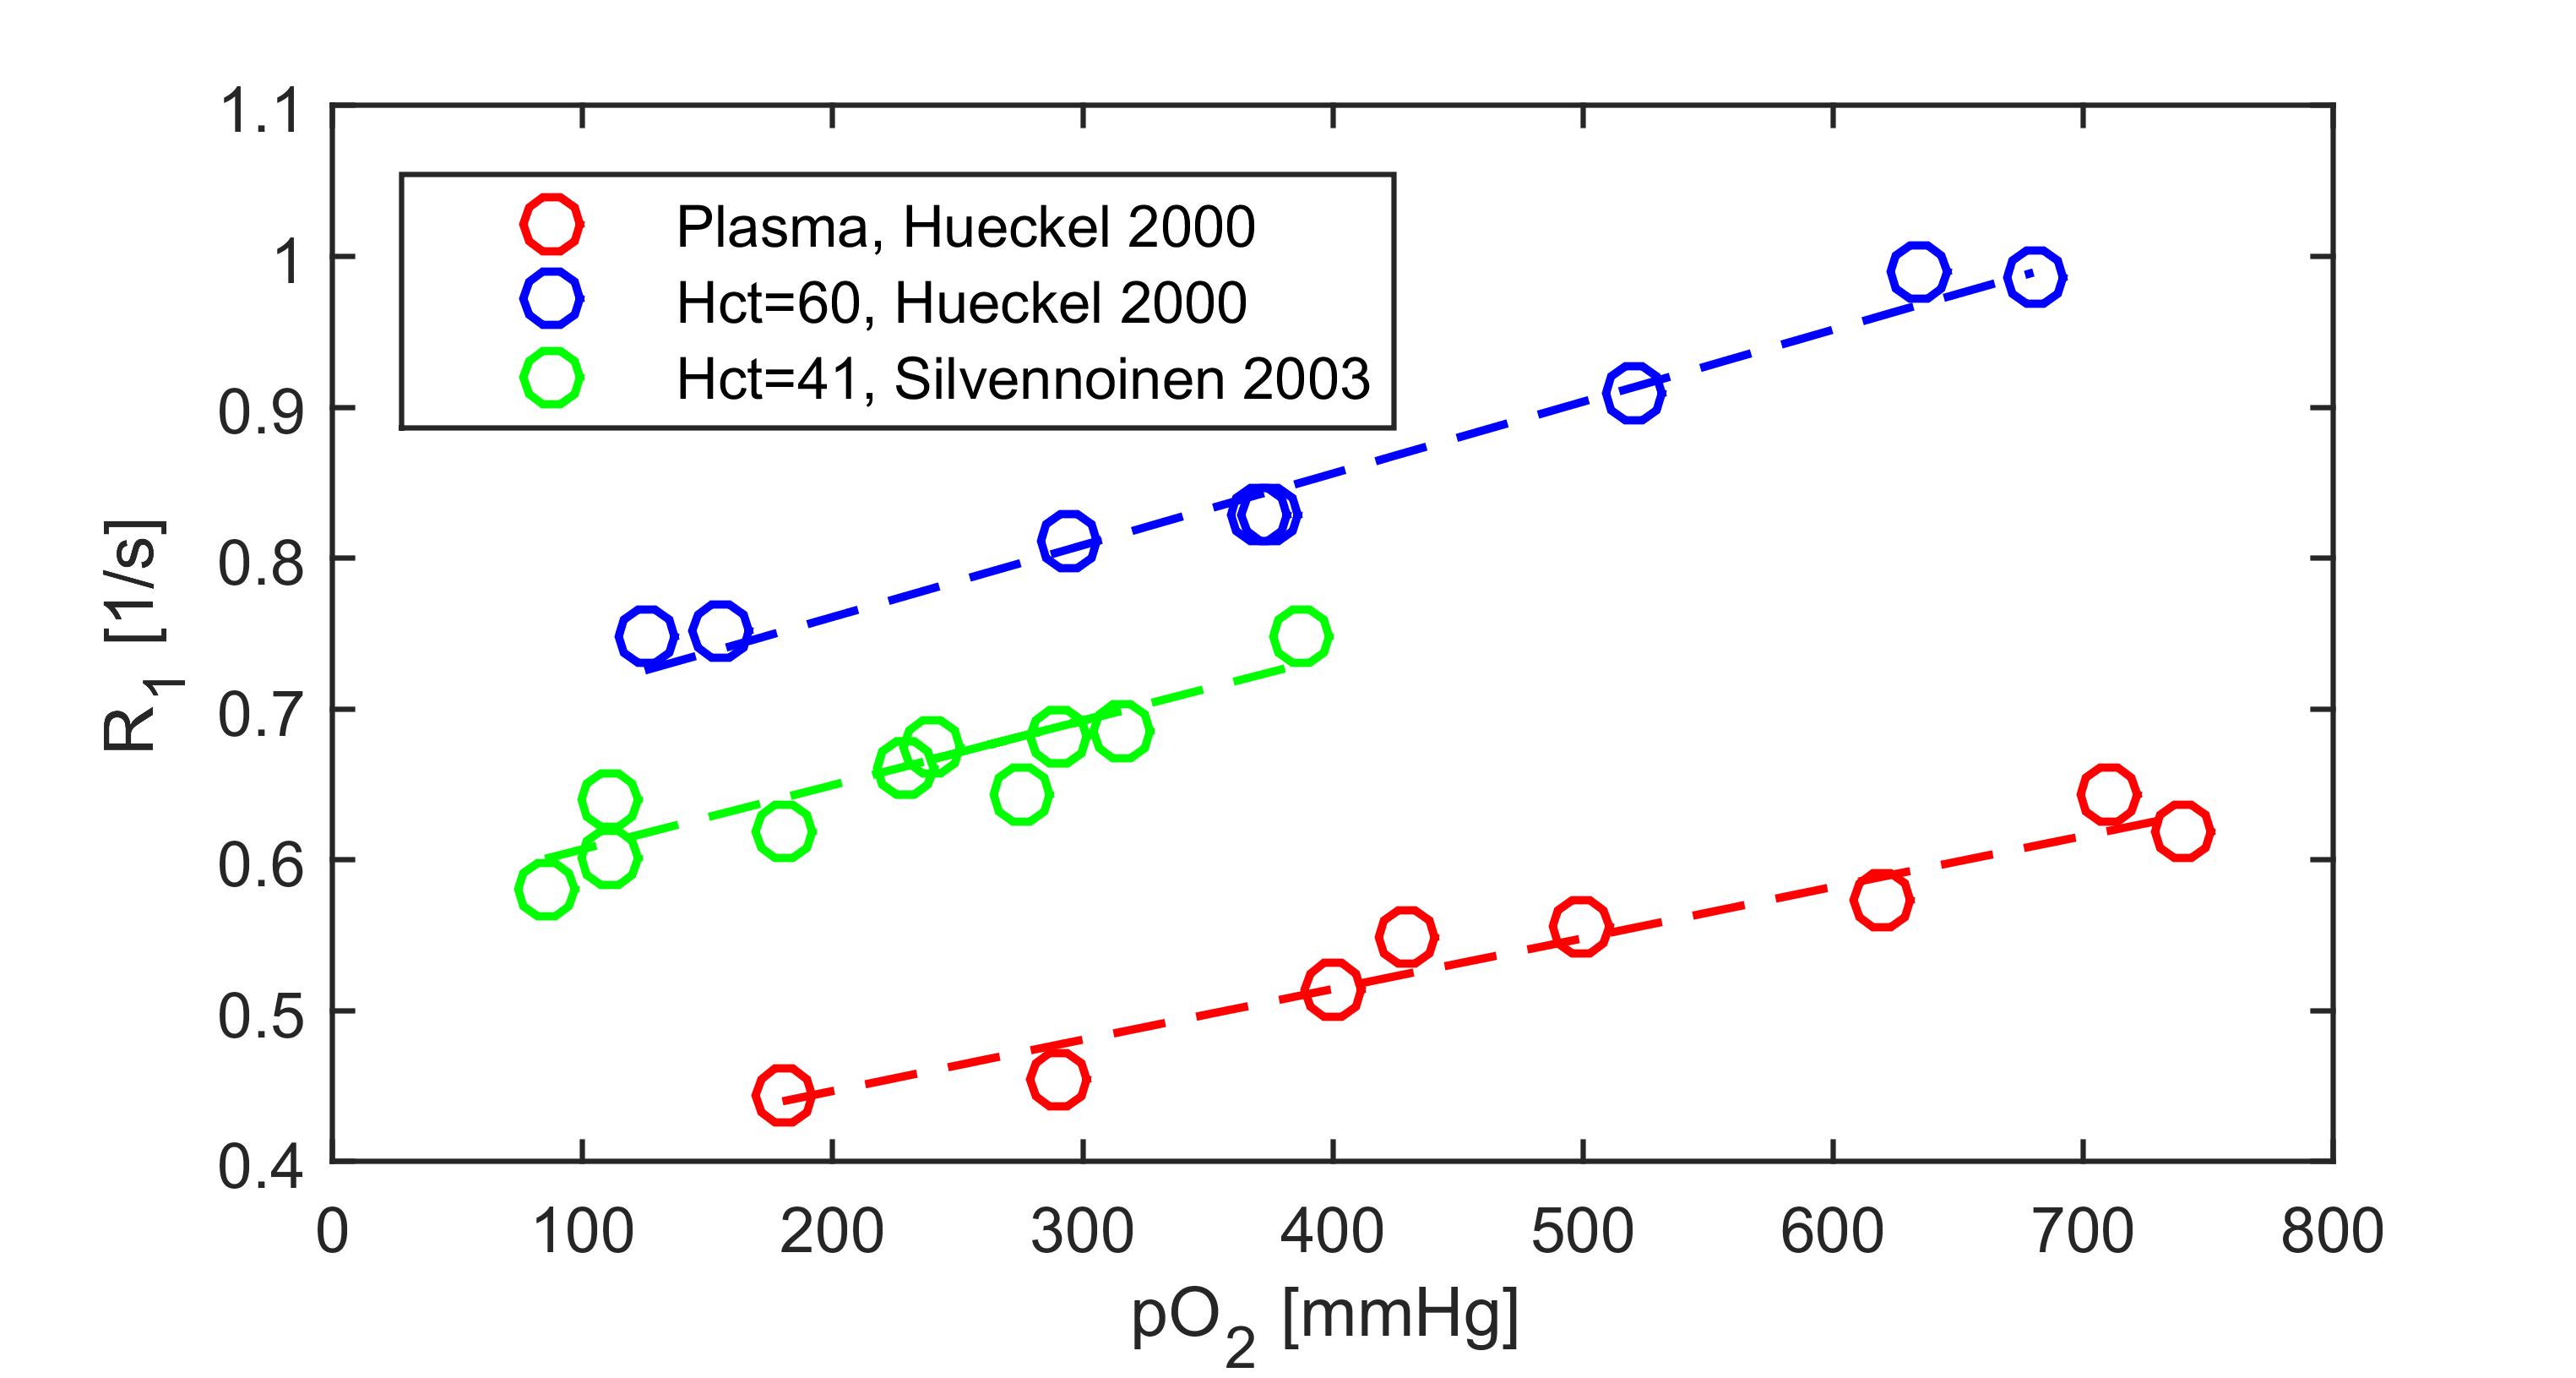
The relaxivity of oxygen is often cited to be 2.49·10-4 s-1 mmHg-1 [3] which applies to distilled water or cerebrospinal fluid [4]. A more correct value of 4·10-4 s-1 mmHg-1 was suggested back in 2004 [5]. Indeed, the oxygen relaxivity varies between 3.38·10-4 s-1 mmHs-1 in plasma [6], 4.1·10-4 s-1 mmHs-1 in whole blood [7], to 4.38·10-4 s-1 mmHs-1 in erythrocyte enriched (hematocrit 60%) blood [6], suggesting that oxygen, just like other paramagnetic contrast agents, acts synergistically with macromolecules [8]. Oxygen interacts very favorably with hydrophobic parts of proteins [9] and induce very efficient relaxation at certain residues. Thus considering blood as a two compartment fast-exchange model [10], assuming a constant plasma oxygen relaxivity of 3.38·10-4 s-1 mmHs-1, the intra-erythrocyte relaxivity of oxygen is approximated to 5.76·10-4 s-1 mmHs-1 (Figure 1), using previous data [6,7].The relaxation enhancement ΔR1 does not reflect oxygen concentration
The relaxation enhancement due to pure oxygen breathing should theoretically be 0.2 s-1 in fully oxygenated blood [7], moreover, the relaxation enhancement is known to be on the order of 0.2 s-1 in blood-less lung tissue[11]. However, the negative oxygen enhancement in pulmonary arterial blood may be on the order of -0.05 s-1[7] assuming a change in venous oxygenation from 75% to 90%. The three compartments (lung tissue, pulmonary venous and pulmonary arterial blood) may contribute roughly equally to the signal [12], and therefore a ΔR1 close to (0.2+0.2-0.05)/3 = 0.125 s-1 is expected. This is slightly higher that what was reported in a recent meta-analysis(0.096 s-1) [13], likely due to non-perfect oxygenation (less than 600 mmHg) or a larger pulmonary arterial (non-oxygenated) contribution.
It is unfortunate that the quotient of the maximal arterial ΔR1 (0.2 s-1) versus the resultant ΔR1.(0.12 s-1), is exactly the same as the whole blood oxygen relaxivity of 4.1·10-4 s-1 mmHs-1 versus the oxygen relaxivity in distilled water 2.49·10-4 s-1 mmHs-1. (0.2/0.12 ≈4.1/2.49)
This may lead to the great misconception that the relaxation enhancement directly reflects oxygen concentration, according to the following formula:
$$ ΔR1=r_{1,blood} ΔP_{O2}=2.49·10^{-4} s^{-1} mmHg^{-1} ·500 mmHg=0.125 s^{-1} $$
However, as already stated, this equation applies to distilled water, and is not valid in any part of the lung.
Oxygen enhancement reflect pulmonary shunt rather than diffusing capacity
The original contribution by Ohno et al. established that oxygen enhanced MRI could potentially measure the diffusing capacity of the lung [1]. However, in a larger cohort of healthy volunteers there was no correlation between ΔR1 and DL,CO [2]. Instead BMI and age were primary determinants of ΔR1, indicating that pulmonary shunt is the underlying quantity measured. Indeed, arterial oxygenation is determined largely by shunt in a healthy lung [14,15]. Asthma is characterized by severe ventilation/perfusion inequality and often an elevated DL,CO [16]. Thus, the apparent reduction of ΔR1 in asthma [17] should be attributed to the perfusion/ventilation inequality, and not the diffusing capacity. Only in interstitial disease will the correlation between ΔR1 and DL,CO perchance be causal [18].Conclusion
Oxygen enhanced MRI has been used to successfully study various diseases. However, a thorough physiological understanding of the lung is necessary before interpreting those measurements. The MRI community must take responsibility and discontinue the naïve interpretation that pulmonary OE-MRI directly reflects oxygen concentration, or diffusion of oxygen, in the lung, especially with reference to the oxygen relaxivity determined in distilled water. Instead, pulmonary OE-MRI may directly reflect ventilation/perfusion defects, shunt and abnormal blood partitioning between pre- and post-capillary compartments, which is important and valuable information in lung disease phenotyping.Acknowledgements
No acknowledgement found.References
1. Ohno Y, Hatabu H, Takenaka D, Van Cauteren M, Fujii M, Sugimura K. Dynamic oxygen-enhanced MRI reflects diffusing capacity of the lung. Magn Reson Med. 2002;47: 1139–44. doi:10.1002/mrm.10168 2. Kindvall SSISSI, Diaz S, Svensson J, Wollmer P, Olsson LELE. The change of longitudinal relaxation rate in oxygen enhanced pulmonary MRI depends on age and BMI but not diffusing capacity of carbon monoxide in healthy never-smokers. PLoS One. 2017;12: e0177670. doi:10.1371/journal.pone.0177670
3. Morgan AR, Parker GJM, Roberts C, Buonaccorsi GA, Maguire NC, Hubbard Cristinacce PL, et al. Feasibility assessment of using oxygen-enhanced magnetic resonance imaging for evaluating the effect of pharmacological treatment in COPD. Eur J Radiol. 2014;83: 2093–101. doi:10.1016/j.ejrad.2014.08.004
4. Zaharchuk G, Busse RF, Rosenthal G, Manley GT, Glenn O a., Dillon WP. Noninvasive Oxygen Partial Pressure Measurement of Human Body Fluids In Vivo Using Magnetic Resonance Imaging. Acad Radiol. 2006;13: 1016–1024. doi:10.1016/j.acra.2006.04.016
5. Jakob PM, Wang T, Schultz G, Hebestreit H, Hebestreit A, Hahn D. Assessment of human pulmonary function using oxygen-enhanced T(1) imaging in patients with cystic fibrosis. Magn Reson Med. 2004;51: 1009–16. doi:10.1002/mrm.20051
6. Hueckel P, Schreiber W, Markstaller K, Bellemann M, Kauczor H-U, Thelen M. Effect of Partial Oxygen Pressure and Hematocrit on T1 Relaxation in Human Blood. Proceedings of the International Society for Magnetic Resonance in Medicine. 2000. p. 1586.
7. Silvennoinen MJ, Kettunen MI, Kauppinen R a. Effects of hematocrit and oxygen saturation level on blood spin-lattice relaxation. Magn Reson Med. 2003;49: 568–571. doi:10.1002/mrm.10370
8. Stanisz GJ, Henkelman RM. Gd-DTPA relaxivity depends on macromolecular content. Magn Reson Med. 2000;44: 665–667. doi:10.1002/1522-2594(200011)44:5<665::AID-MRM1>3.0.CO;2-M
9. Teng CL, Bryant RG. Mapping Oxygen Accessibility to Ribonuclease A Using High-Resolution NMR Relaxation Spectroscopy. Biophys J. Elsevier; 2004;86: 1713–1725. doi:10.1016/S0006-3495(04)74240-X
10. Li W, Grgac K, Huang A, Yadav N, Qin Q, van Zijl PCMM. Quantitative theory for the longitudinal relaxation time of blood water. Magn Reson Med. 2015;00: n/a-n/a. doi:10.1002/mrm.25875
11. Triphan SMF, Jobst BJ, Flechsig P, Breuer FA, Jakob PM, Biederer J. Oxygen-dependence of T1 in lung tissue as observed in isolated, ventilated porcine lung phantoms. Proceedings of the International Society for Magnetic Resonance in Medicine 22. 2014. p. 2311.
12. Triphan SMF, Jobst BJ, Breuer FA, Wielpütz MO, Kauczor H-U, Biederer J, et al. Echo time dependence of observed T 1 in the human lung. J Magn Reson Imaging. 2015;42: 610–616. doi:10.1002/jmri.24840
13. Dietrich O, Gaass T, Reiser MF. T1 relaxation time constants, influence of oxygen, and the oxygen transfer function of the human lung at 1.5 T—A meta-analysis. Eur J Radiol. Elsevier Ireland Ltd; 2017;86: 252–260. doi:10.1016/j.ejrad.2016.11.027
14. Harris EA, Seelye ER, Whitlock RM. Revised standards for normal resting dead-space volume and venous admixture in men and women. Clin Sci Mol Med. 1978;55: 125–8. Available: http://www.ncbi.nlm.nih.gov/pubmed/668265
15. Jensen RL, Crapo RO. Prediction of normal arterial oxygen levels. J Investig Med. 1996;44. Available: http://www.scopus.com/inward/record.url?eid=2-s2.0-33749579700&partnerID=tZOtx3y1
16. Saydain G, Beck KC, Decker PA, Cowl CT, Scanlon PD. Clinical significance of elevated diffusing capacity. Chest. 2004;125: 446–52. Available: http://www.ncbi.nlm.nih.gov/pubmed/14769723
17. Ohno Y, Koyama H, Matsumoto K, Onishi Y, Nogami M, Takenaka D, et al. Oxygen-enhanced MRI vs. quantitatively assessed thin-section CT: pulmonary functional loss assessment and clinical stage classification of asthmatics. Eur J Radiol. Elsevier Ireland Ltd; 2011;77: 85–91. doi:10.1016/j.ejrad.2009.06.027
18. Ohno Y, Nishio M, Koyama H, Yoshikawa T, Matsumoto S, Seki S, et al. Oxygen-enhanced MRI for patients with connective tissue diseases: comparison with thin-section CT of capability for pulmonary functional and disease severity assessment. Eur J Radiol. Elsevier Ireland Ltd; 2014;83: 391–7. doi:10.1016/j.ejrad.2013.11.001
Figures