1888
Hyperpolarized Gas MR Imaging of Regional Ventilation; Dissimilarities of Single- and Multi-breath ImagingHooman Hamedani1, Francisca Bermudez1, Ryan Baron1, Stephen Kadlecek1, Kai Ruppert1, Ian Duncan1, Yi Xin1, Sarmad Siddiqui1, Mehrdad Pourfathi1, Faraz Amzajerdian1, Luis Loza1, Tahmina Achekzai1, Federico Sertic1, and Rahim R. Rizi1
1Radiology, University of Pennsylvania, Philadelphia, PA, United States
Synopsis
Single and Multi-breath Hyperpolarized Gas MR Imaging Provides Different Measures of Lung Ventilation
Introduction:
Hyperpolarized (HP) gas distribution in the lungs can be imaged at end-inspiration during a single, short breath-hold. The absence or inhomogeneity of gas signal/intensity in the parenchyma is linked to functional respiratory deterioration, and has been shown to correlate with global markers of clinical lung function assessments such as pulmonary function tests, six-minute walk test and respiratory questionnaires. It is therefore a useful marker for the diagnosis, treatment and monitoring of lung disorders. Spin-density at each voxel is proportional to the amount of imaging gas present in that voxel and the level of gas polarization; despite being skewed by partial volume effects, B1 inhomogeneity and gas diffusion, it is therefore largely proportional to the voxels’ aeration. In the case of diseased lung, it has also been shown that certain regions of the lung take longer to fill with sufficient imaging gas to provide measurable signal1,2. Multi-breath imaging, on the other hand, although more complicated to perform, is capable of assessing Fractional Ventilation (FV), a comprehensive and physiologically-defined measure of lung ventilation which is not prone to the abovementioned shortcomings. In this work, we compared HP gas markers derived from single-breath imaging with fractional ventilation measured via multi-breath wash-in.Material and Methods:
Imaging was performed on 5 smokers and 5 COPDers in a 1.5-T MRI Siemens system using an 8-channel 3He coil (Stark, Germany). A 2D multi-slice GRE sequence (TR/TE = 6.9/3.2 ms) was employed, with six coronal slices (20% slice gap) and a resolution of ~8x8x25 mm3, covering the whole-lung (matrix size: 48x36). The FV image-series consisted of 6 wash-in breaths of HP 3He polarized to ~35%, followed by a final long breath-hold for T1 correction1. Ventilation defects (VDP)3—the percent of the total lung with no gas signal—were computed at each of the six HP gas wash-in breaths and compared with the B1-corrected regional signal intensities and regional FV to assess whether they provide the same ventilation information. FV can be derived from a fit to the signal-build up measured from the series of back-to-back wash-ins of HP 3He, as previously described1. To measure FV, a gas delivery device that administers a normoxic mixture of imaging gas and controls tidal volume is required.Results:
Table 1 shows the subjects’ demographics and imaging results. As the representative subject in Figure 1A shows, VDP significantly decreased with each breath—by an average of 59.7±28.3% (absolute: ∆=8.1±4.8; P=0.022) in all smokers and an average of 45.1±18.1% (absolute: ∆=9.7±6.1; P=0.043) in all COPDers—indicating that VDP is a function of the number of breaths (Figure 1B). While smokers in this study present a linear trend, with regions being filled up to 95% after six breaths, this trend shows heterogonous characteristics specific to each COPD subject, with most of them still having unfilled regions at the last breath (actual ventilation defects). A B1-corrected map of normalized image-intensity at each breath was compared with regional FV for all subjects in Figure 2. A Spearman correlation of 0.56±0.26 was observed between FV and signal intensity at the first breath, but decreased linearly with each breath, down to 0.06±0.26 at the sixth breath. The relationship between regional FV and B1-corrected image-intensity at each breath for lungs with compromised function shows that spin density is not the same as physiological ventilation, or Specific Ventilation, which relates to FV as: FV = SV/(1+SV), and provides information on regional gas mixing efficiency.Conclusion:
Our data suggests that ventilation defect is a function of lung time constants—i. e., that imaging gas cannot mix properly at some regions of air trapping, emphysema or small airway disease during the short time constants of single-breath imaging. While aeration (image intensity) correlates moderately with regional ventilation in early breaths, it is not a comprehensive measure of physiologically-defined lung ventilation. Nevertheless, since the highest correlation with FV occurred at the first breath, it is safe to claim that single-breath imaging provides a sensitive regional diagnostic tool while multi-breath imaging provides more information about regions of functional deterioration and gas mixing efficiency. Compared to the setup time and complexity of doing any human HP gas imaging study, the additional ~1 minute of imaging time and equipment needed to precisely administer imaging gas over multiple breaths is not onerous. In fact, all gas MR imaging studies would benefit from precise knowledge of gas administration volume, timing, flow rate, FiO2 and ETO2/CO2, and the additional information obtained observing the wash-in of gas contrast is now well establishedAcknowledgements
This work was funded by NIH R01-HL127969 04.References
1- Hamedani H, et al. Radiology 279 (3), 917-924
2- Marshall H J, et al, Thorax 2012;67:613-617.
3- Mu He, et al. Acad Radiol. 2014 Dec; 21(12): 1530–1541.
Figures
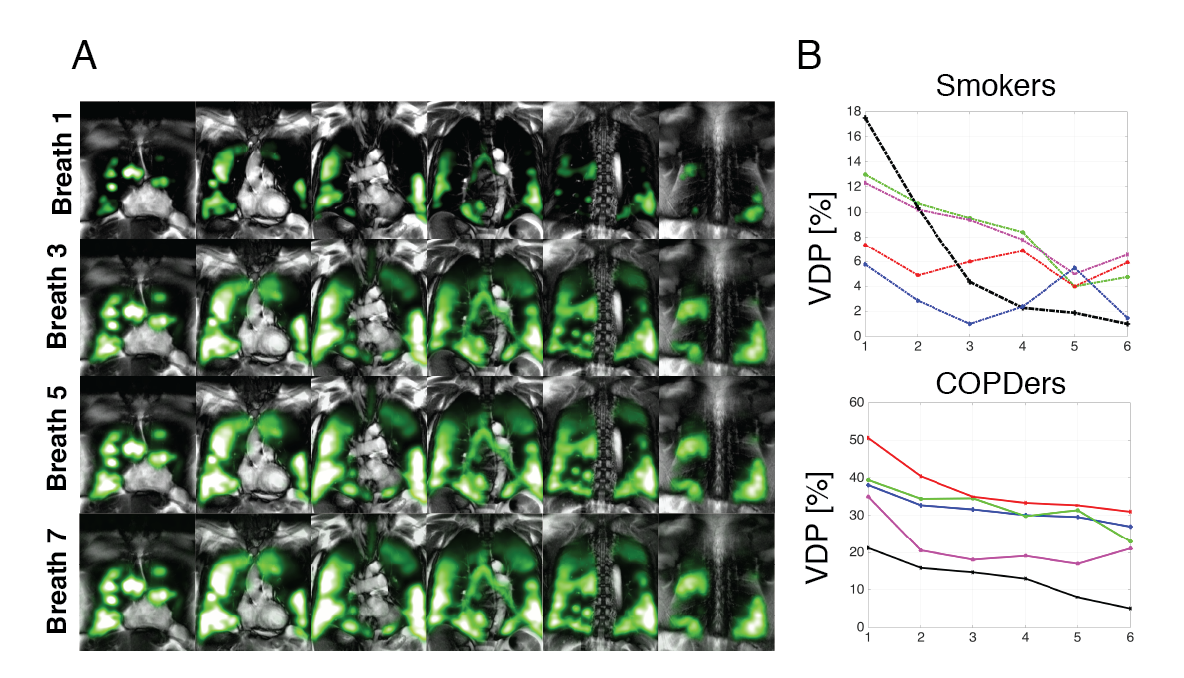
Figure 1- A) Spin-density maps of a series of back-to-back inhalation of HP gas gradually filling the lungs in a COPD subject (%FEV1=0.39). B) The Ventilation Defect Percentage plotted for each breath of the HP gas wash-in for smokers and COPDs.
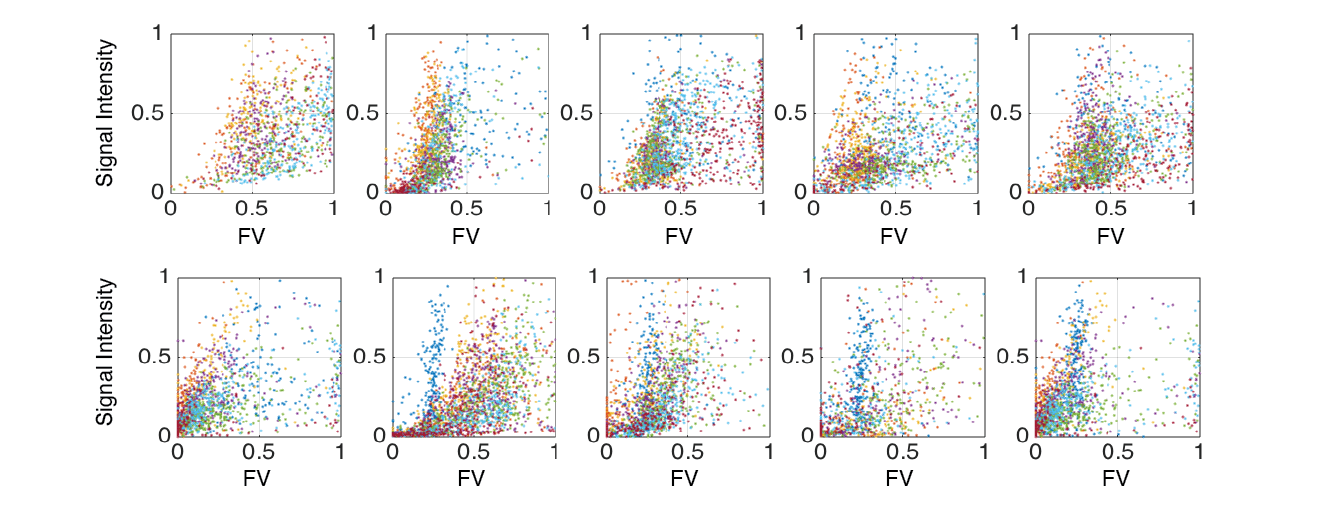
Pixel-by-pixelcorrelation of FV with normalized signal-intensity of the first breath for both cohorts.

Table 1- Demographics and Ventilation Defect Percentages for each breath