1884
Hyperpolarized Ventilation MRI and Ensemble Machine Learning Predict Airflow Limitation Worsening in Ex-smokers1Robarts Research Institute, London, ON, Canada, 2Medical Biophysics, Western University, London, ON, Canada, 3Division of Respirology, Department of Medicine, Western University, London, ON, Canada, 4Physics, Ryerson University, Toronto, ON, Canada
Synopsis
Hyperpolarized noble-gas pulmonary imaging provides a way to measure ventilation and perfusion in patients. The potential of highly sensitive MRI biomarkers of lung function has not yet been exploited using machine-learning. Ensemble machine-learning merges diverse classifiers to improve classification accuracy and reduce the potential for misclassification. Our aim was to evaluate the performance of ensemble machine-learning algorithms and hyperpolarized gas MRI features for predicting worsening airflow measured using spirometry. This proof-of-concept study revealed that MRI ventilation combined with ensemble machine-learning predicted small changes in airflow limitation (∆FEV1%pred=5%) over relatively short time period (2.5 yr) in ex-smokers with and without COPD.
INTRODUCTION:
Hyperpolarized noble gas pulmonary imaging provides a way to measure ventilation sensitively and perfusion abnormalities with high spatial resolution in patients. Predictive models of chronic obstructive pulmonary disease (COPD) progression use clinical characteristics such as age, race, smoking history, etc.1-3 as predictors, or use quantitative information from computed tomography4, while few include MRI-derived measurements.5 Ensemble machine learning combines multiple machine learning algorithms to improve the performance of classifiers at predicting outcomes. Our objective was to evaluate progressive airflow limitation based on the minimal clinically important difference (MCID) for the forced expiratory flow in 1s (FEV1) in ex-smokers with and without COPD using MRI measurements only. Our second objective was to compare the performance of single classifiers with ensemble classifiers, which are designed to improve accuracy by combining multiple weak classifiers. We hypothesized that ensemble machine-learning algorithms and hyperpolarized noble gas MRI parameters would accurately predict 5% and 10% FEV1 worsening that occurred in patients and at-risk ex-smokers during a 2-3 year period of time.METHODS:
Subjects and Image Acquisition:
We retrospectively evaluated hyperpolarized 3He static-ventilation MRI and spirometry in ex-smokers with and without COPD who provided written informed consent to approved research protocols (NCT02723474 and NCT0228220) and underwent MRI whole body 3.0T(Discovery 750MR; GE Healthcare, Milwaukee, Wisconsin), spirometry and CT at baseline and 3 years later as previously described.6 3He ventilation images were acquired using a single channel rigid elliptical transmit-receive chest coil (RAPID Biomedical, Wuerzburg, Germany) and an FGRE sequence with a partial echo and the following parameters: total acquisition time=10s; TR/TE/flip angle=3.8ms/1.0ms/7°; FOV=40×40cm2, BW=48.8kHz; matrix=128×80 (zero-padded to 128×128); partial echo percent=62.5%; number of slices=15-17; slice thickness=15mm, 0-gap.
Image Analysis
Ventilation-defect-percent (VDP) was generated as previously described.7 Ventilation-defect-cluster-percent (VDCP), cluster defect diameter voxel size one (CDD1) and low ventilation clusters (LVC) measurements were measured using a custom-built algorithm. VDCP is the sum of ventilation-defect cluster volume normalized to the volume of the thoracic cavity. CDD1 is the cumulative number of defect clusters of one voxel (5x5x5mm3). We also evaluated first-order texture features, run length matrix (RLM), and gray level co-occurrence matrix (GLCM) mean, standard deviation, and skewness. Run length matrix features included short run emphasis (SRE), long run emphasis (LRE), gray level non-uniformity (GLN), run length non-uniformity (RLN), and run percentage (RP). Gray level co-occurrence matrix (GLCM) features included entropy, contrast and homogeneity.
Machine Learning
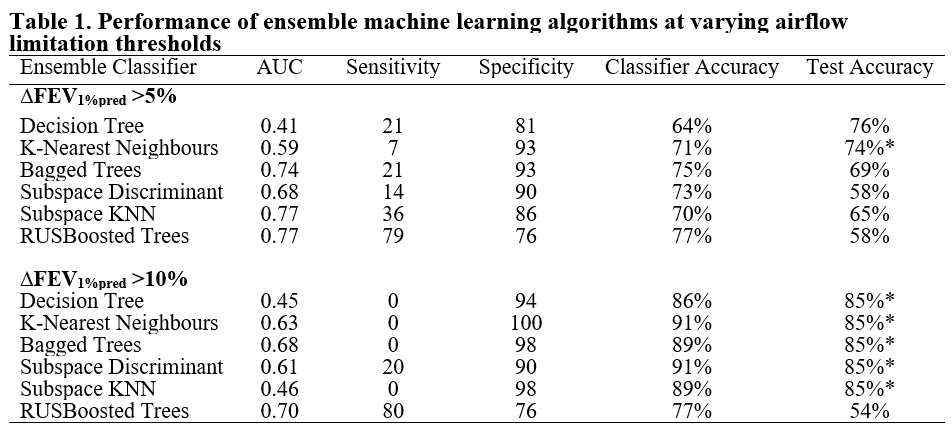
We evaluated the performance of a number of machine learning algorithms (n=6) including two single classifiers: decision trees,8 K-nearest neighbours,9 and four ensemble-classifiers: bagged trees,10 subspace discriminant,11 subspace K-nearest-neighbours (subspace KNN),11 and Random Under-Sampling Boosted Trees (RUSBoosted).12 These classifiers were used to predict progression based on ∆FEV1%pred >5%, and ∆FEV1 >10%. Participants were dichotomized as stable or progressive airflow limitation based on the minimal clinically important difference for FEV1 of 5% or based on a change in FEV1 of 10% and randomly assigned to a training (70% of subjects) or validation (30% of subjects) dataset. Five-fold cross validation was implemented in the training data. Accuracy of machine-learning model predictions were estimated using Receiver-Operator-Characteristic (ROC) curves that provided sensitivity, specificity and area-under-the-curve (AUC) values.
RESULTS:
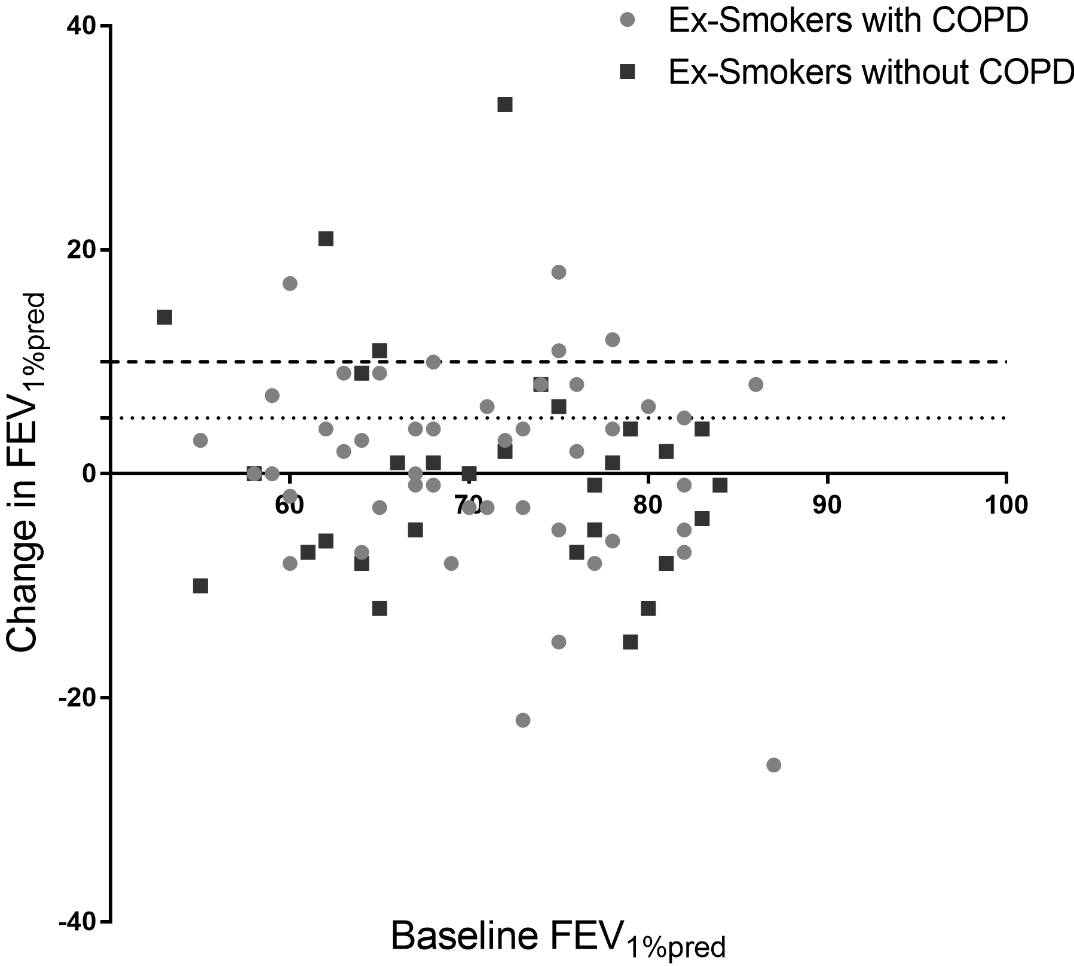
We evaluated 81 participants including 31 ex-smokers without COPD and 50 patients with COPD at baseline (70±8-years) and follow-up (73±8-years), which was 30±7-months later. Table 1 demonstrates the performance of the ensemble algorithms relative to single machine-learning algorithms. Figure 1 illustrates the distribution of participants with changes in FEV1. Ensemble-classifiers outperformed single-classifiers at correctly predicting worsening of airflow (sensitivity). RUSBoosted performed best out of the classifiers when evaluating AUC, sensitivity and specificity all together, especially at ∆FEV1%pred>5%.DISCUSSION:
In this proof-of-concept study we evaluated 15 parameters and features derived from hyperpolarized noble gas MRI acquired in 81 ex-smokers and applied four ensemble machine-learning algorithms. Our findings suggest that quantitative feature analysis of pulmonary ventilation based only on MRI data provides valuable information that could forecast airflow limitation. While the test accuracy for our ensemble models was modest, this highlights the potential of information that can be extracted from hyperpolarized MR. Classification and test accuracy was greater for ∆FEV1%pred>10%, but sample size remains relatively small, which is a common limitation in classification techniques. For predicting ∆FEV1%pred>10%, 5/6 classifiers had a high-test accuracy, but the result was biased towards favoring the majority class and incorrectly classified all test subjects as stable, except for the RUSBoosted ensemble algorithm.CONCLUSIONS:
Hyperpolarized noble gas MRI provides highly sensitive ventilation signal intensity information that may be exploited using ensemble machine-learning algorithms to predict progressive disease measured using FEV1.Acknowledgements
No acknowledgement found.References
1. Matheson MC, et al. Int J Chron Obstruct Pulmon Dis 13,1927 (2018).
2. Amalakuhan B, et al. J Community Hosp Intern Med Perspect 2, 9915 (2012).
3. Shah SA, et al. J Med Internet Res 19, (2017).
4. González G, et al. Am J Respir Crit Care Med 197, 193-203 (2018).
5. Kirby M, et al. Radiology 273, 887-896 (2014).
6. Kirby M, et al. Radiology 256, 280-289 (2010).
7. Kirby M, et al. Acad Radiol 19, 141-152 (2012).
8. Quinlan JR. Mach Learn 1, 81-106 (1986).
9. Cover T, et al. IEEE Trans Inf Theory 13, 21-27 (1967).
10. Breiman L. Mach Learn 24, 123-140 (1996).
11. Hastie T, et al. Adv Neural Inf Process Syst; 409-415 (1996).
12. Seiffert C, et al. IEEE Trans Syst Man Cybern A Syst Hum 40, 185-197 (2010).
Figures