1883
Integration of HP 3He MRI with In Silico Models to Predict Gas Flows in Severe Asthma Subjects1Mechanical and Industrial Engineering, Northeastern University, Boston, MA, United States, 2Biomedical Engineering, University of Wisconsin-Madison, Madison, WI, United States, 3BioEngineering, Northeastern University, Boston, MA, United States, 4Medical Physics, University of Wisconsin-Madison, Madison, WI, United States, 5Radiology, University of Wisconsin-Madison, Madison, WI, United States
Synopsis
Hyperpolarized 3He MRI, CT data, and patient-specific computational modeling methods are combined to predict airflow distributions, pressure maps, and central and peripheral resistances in three severe asthma subjects. Simulation results indicate variations in gas flows between the subjects and show a correlation between SVDP and peripheral respiratory resistances.
Purpose:
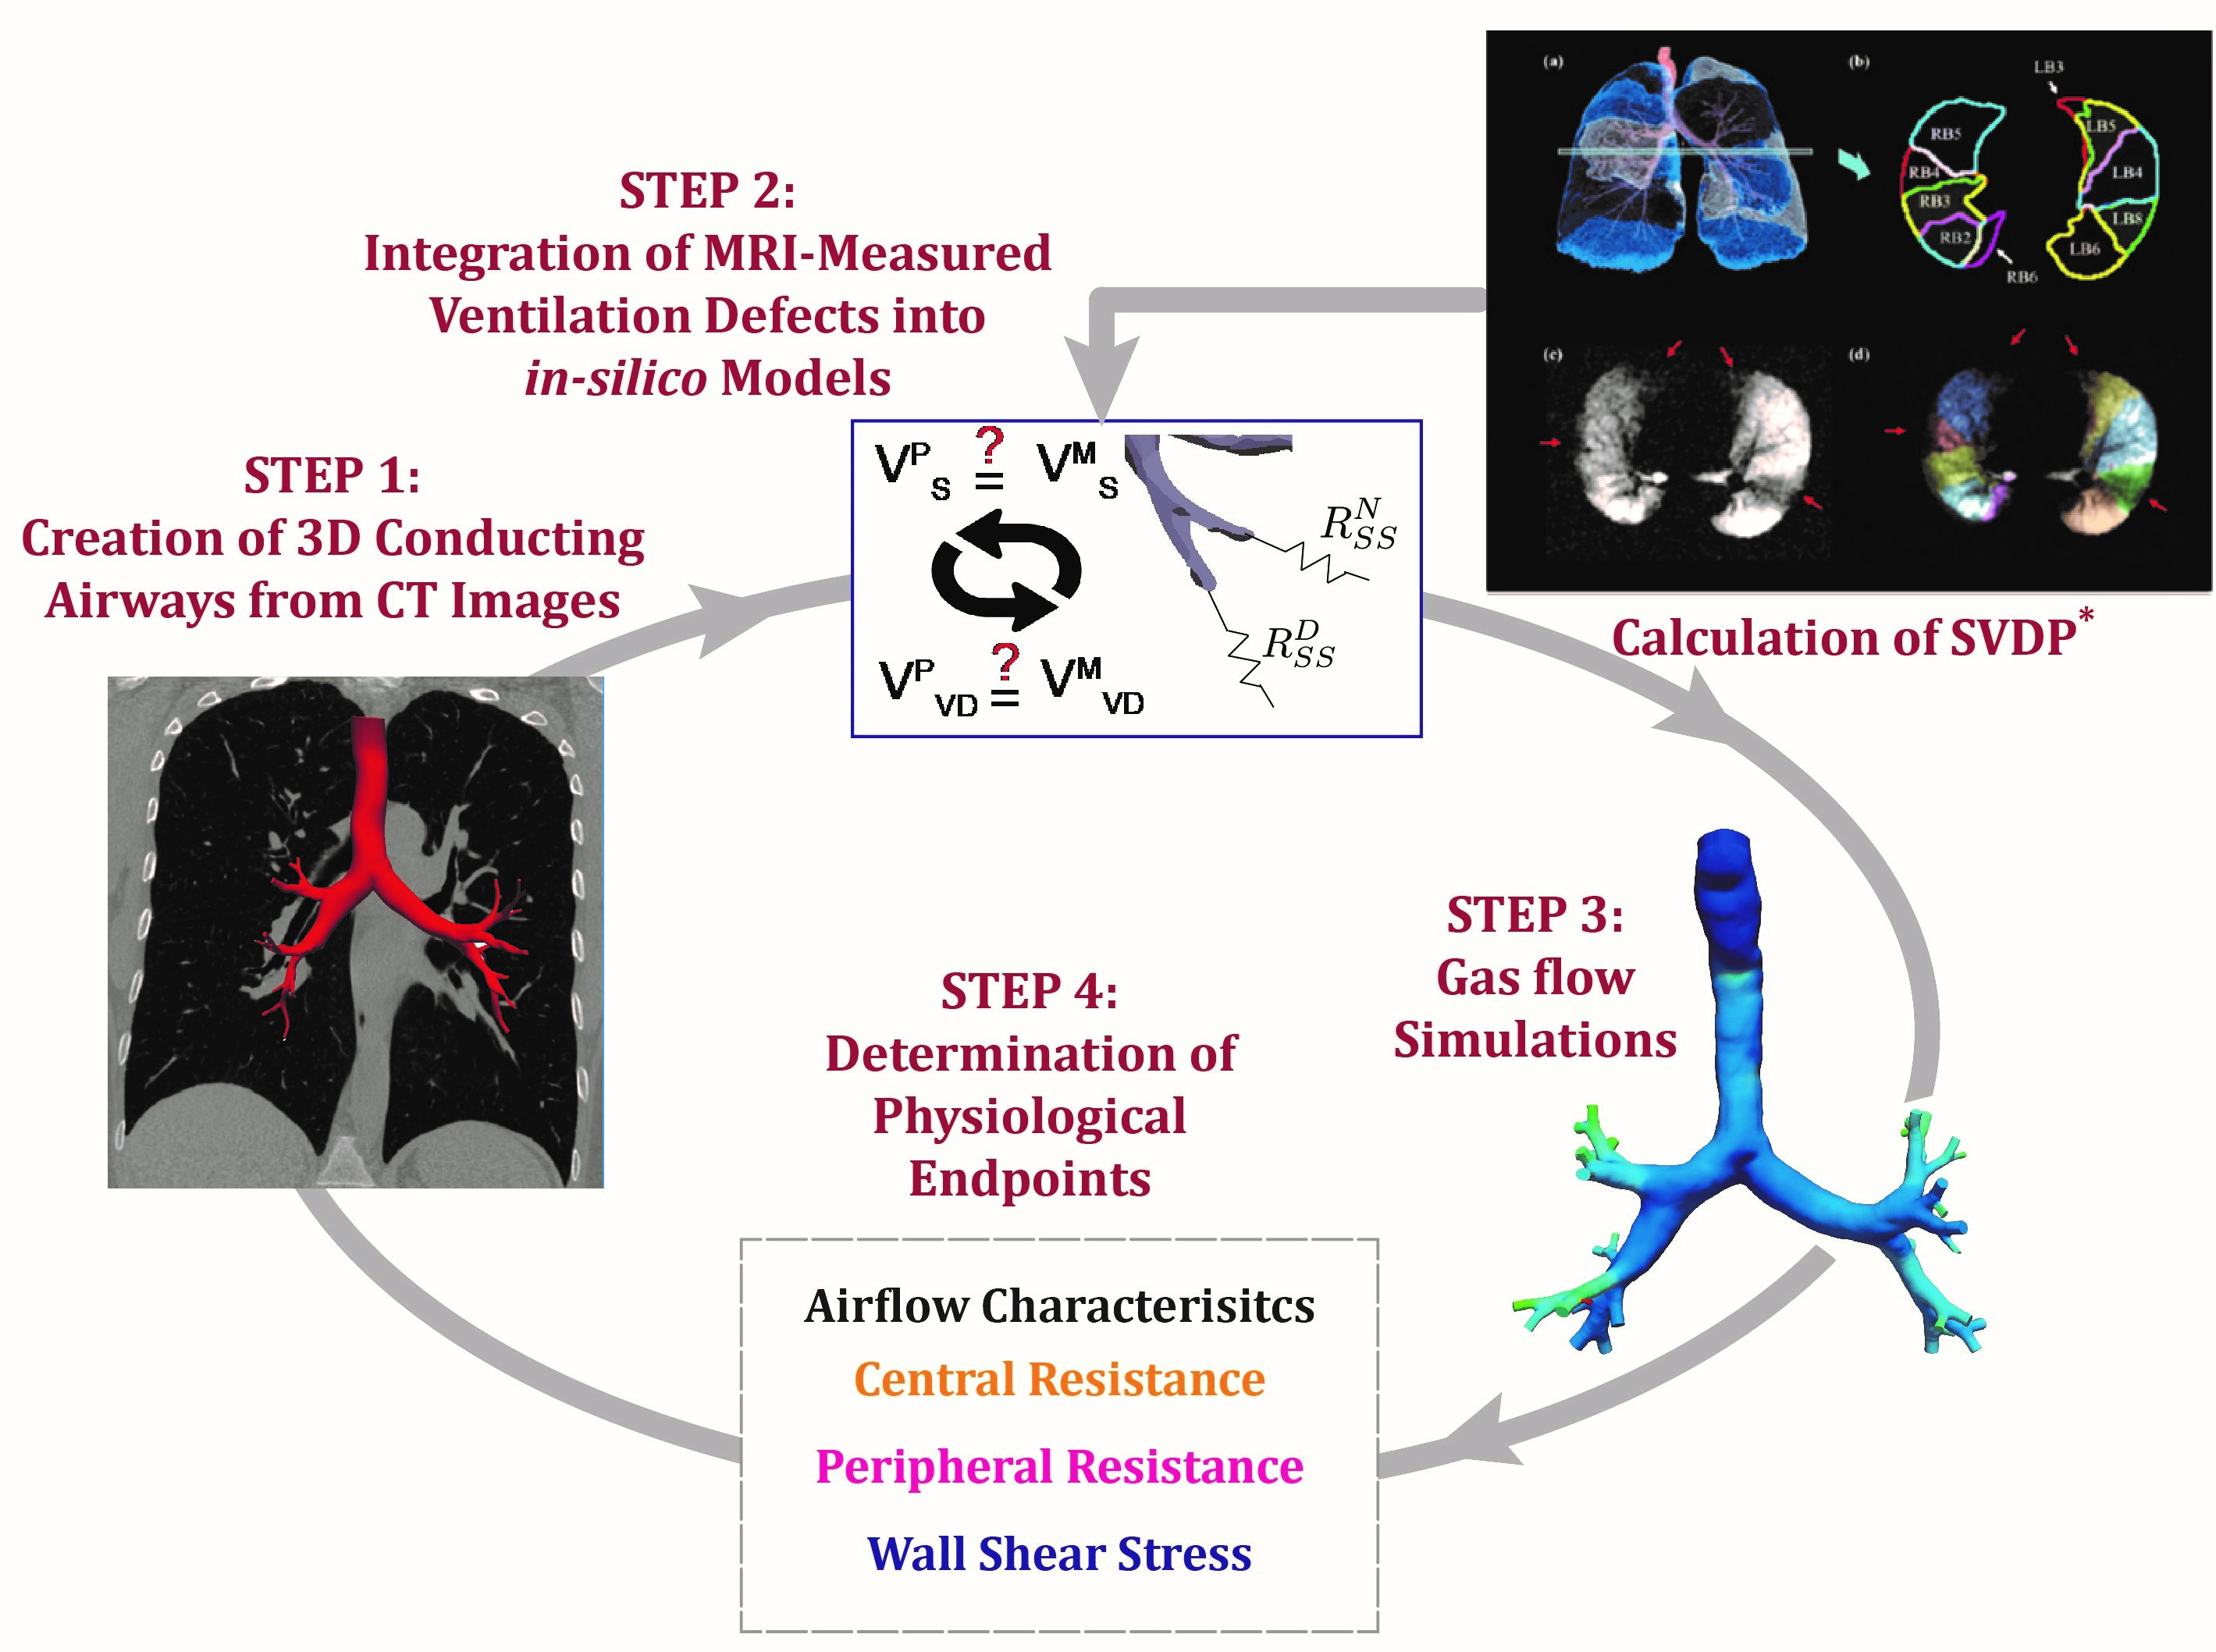
Hyperpolarized (HP) gas MRI can provide detailed insights into abnormal inhaled gas distributions in the lung; these ventilation defects are associated with severe outcomes in asthma.1 However, HP gas MRI has yet to provide a quantitative measure of regional gas behaviors or resistances. Physiological computer simulations, when parameterized with CT and MR images, may provide detailed insights into regional flow behavior. Indeed, HP 3He MRI may be used to parametrize boundary conditions for computational fluid dynamics (CFD) simulations by incorporating regions of ventilation defects as the fluid boundary conditions.2 Here, we apply this framework (Figure 1) to predict central versus peripheral resistances by simulating gas flow in three severe asthmatic subjects.Methods:
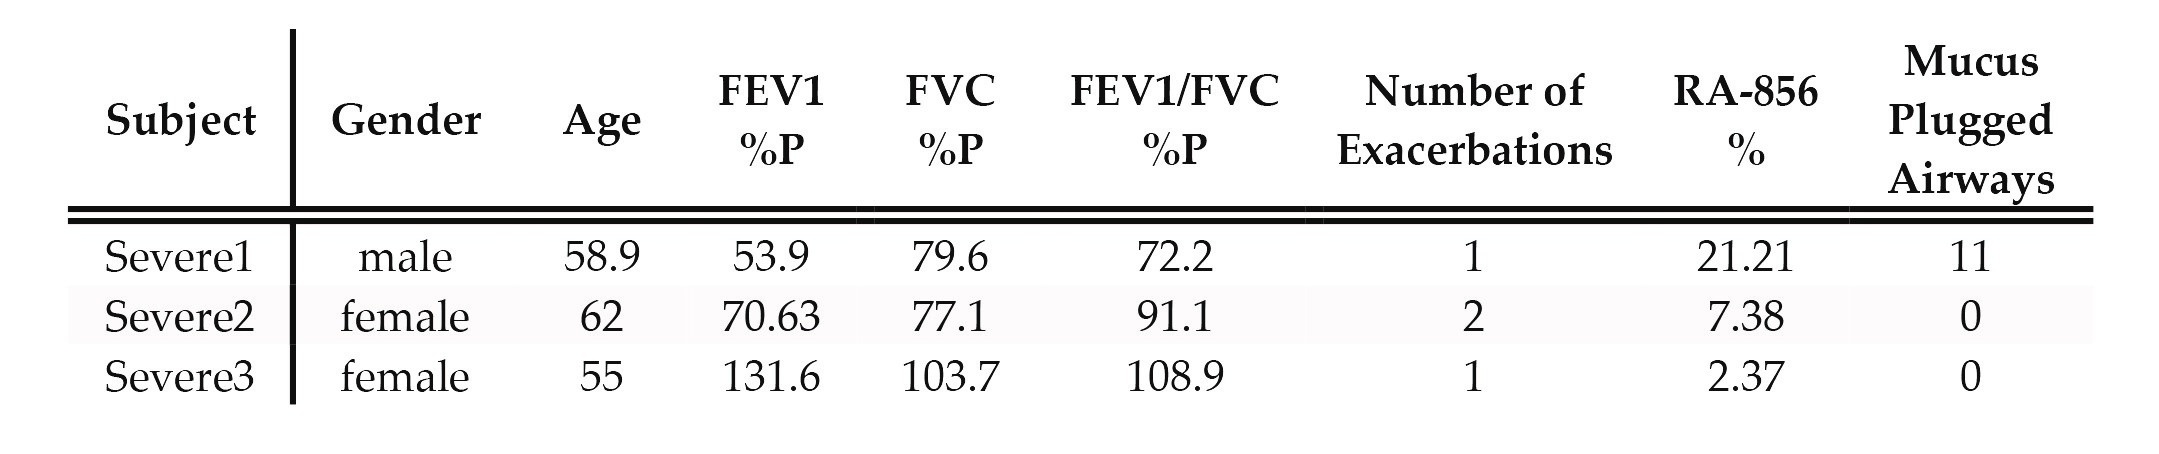
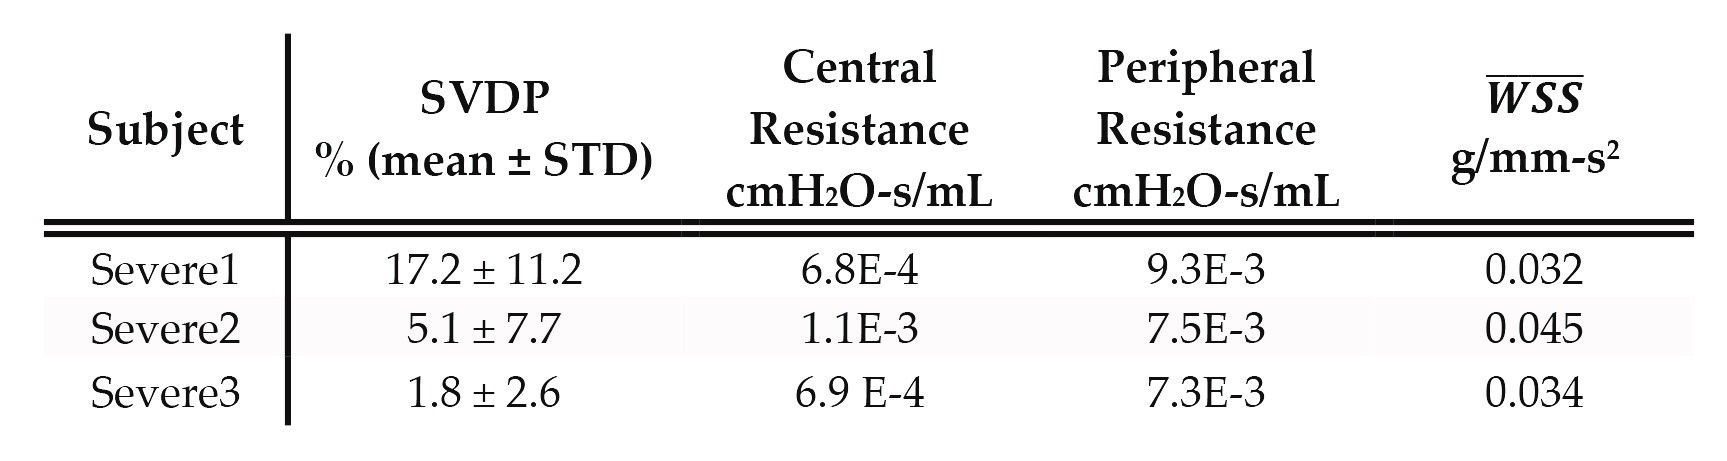
HP 3He MRI and high-resolution CT images of 3 severe asthmatic subjects (classified based on the American Thoracic Society Workshop on Refractory Asthma,3 Table 1) are retrospectively collected from the UW Madison Severe Asthmatic Research Program (SARP) 3 cohort. Anatomically-accurate 3D conductive airways geometries are created from the CT images by using a semi-automated region-growing algorithm with the open-source software SimVascular4 (Figure 1). To best represent conditions during the MR acquisition, each subject “inhaled” a simulated 1L of a helium-air mixture (density: 8.55E-7 g/mm3 and viscosity: 1.99E-5 g/mm-s) over 3 seconds. Segmental ventilation defect percentages (SVDPs) are calculated from the HP 3He MR images and are defined as the percentage of defected volume with respect to the total segmental volume (19 segmental volumes for each subject), providing a quantitative measure of regional ventilation defect extent. We then couple each SVDP to the corresponding distal branch of the 3D airway tree by prescribing the segmental resistance (Rss) as the flow boundary condition. This is completed by first defining the total respiratory resistance (Rres) for a normal lung (7E-3 cmH2O-s/ml)5 and distributing Rres to each distal branch, then iterating on Rss until the proportion of simulated gas delivery matches the measured peripheral gas/tissue volume fractions. To incorporate SVDPs, we further iterate on the Rss of the airway branches feeding the defected regions until the volumes are the same. Following the simulations, central airway resistances are calculated by dividing average pressure gradients by the inhaled flow rate. Peripheral resistance is calculated by adding all segmental resistances in series form. In addition, we calculate mean wall shear stress ($$$\overline{WSS}$$$) for each subject over the entire surface area. $$$\overline{WSS}$$$ is a measure of velocity magnitude gradients near the airway wall, which is typically larger in irregularly shaped and smaller airway geometries.Results:
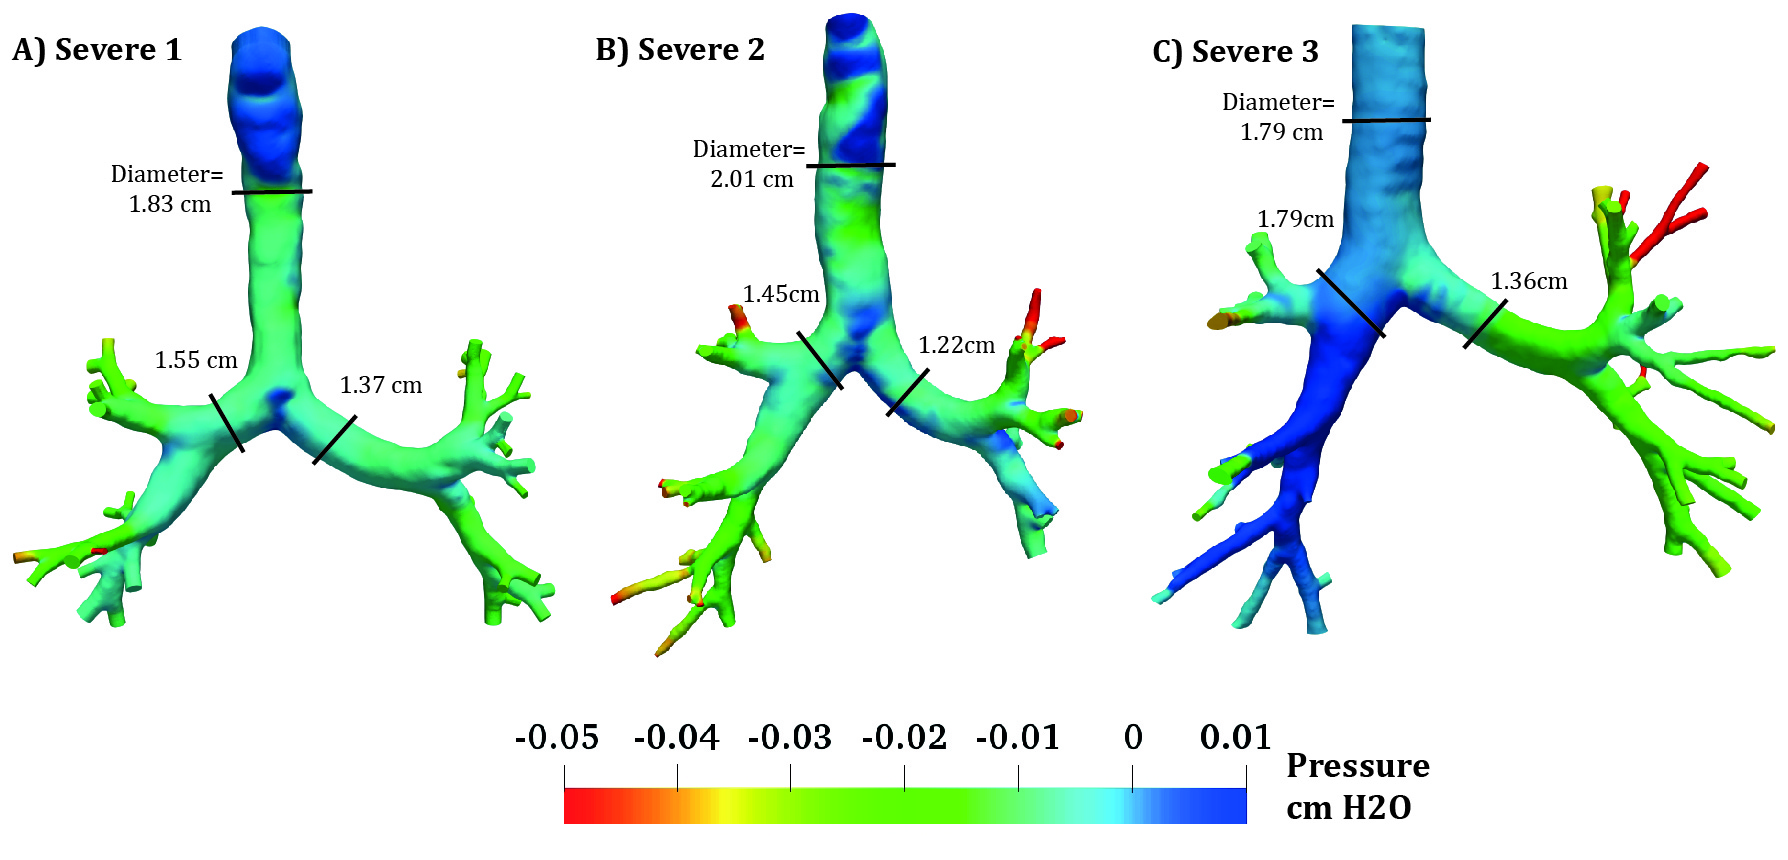
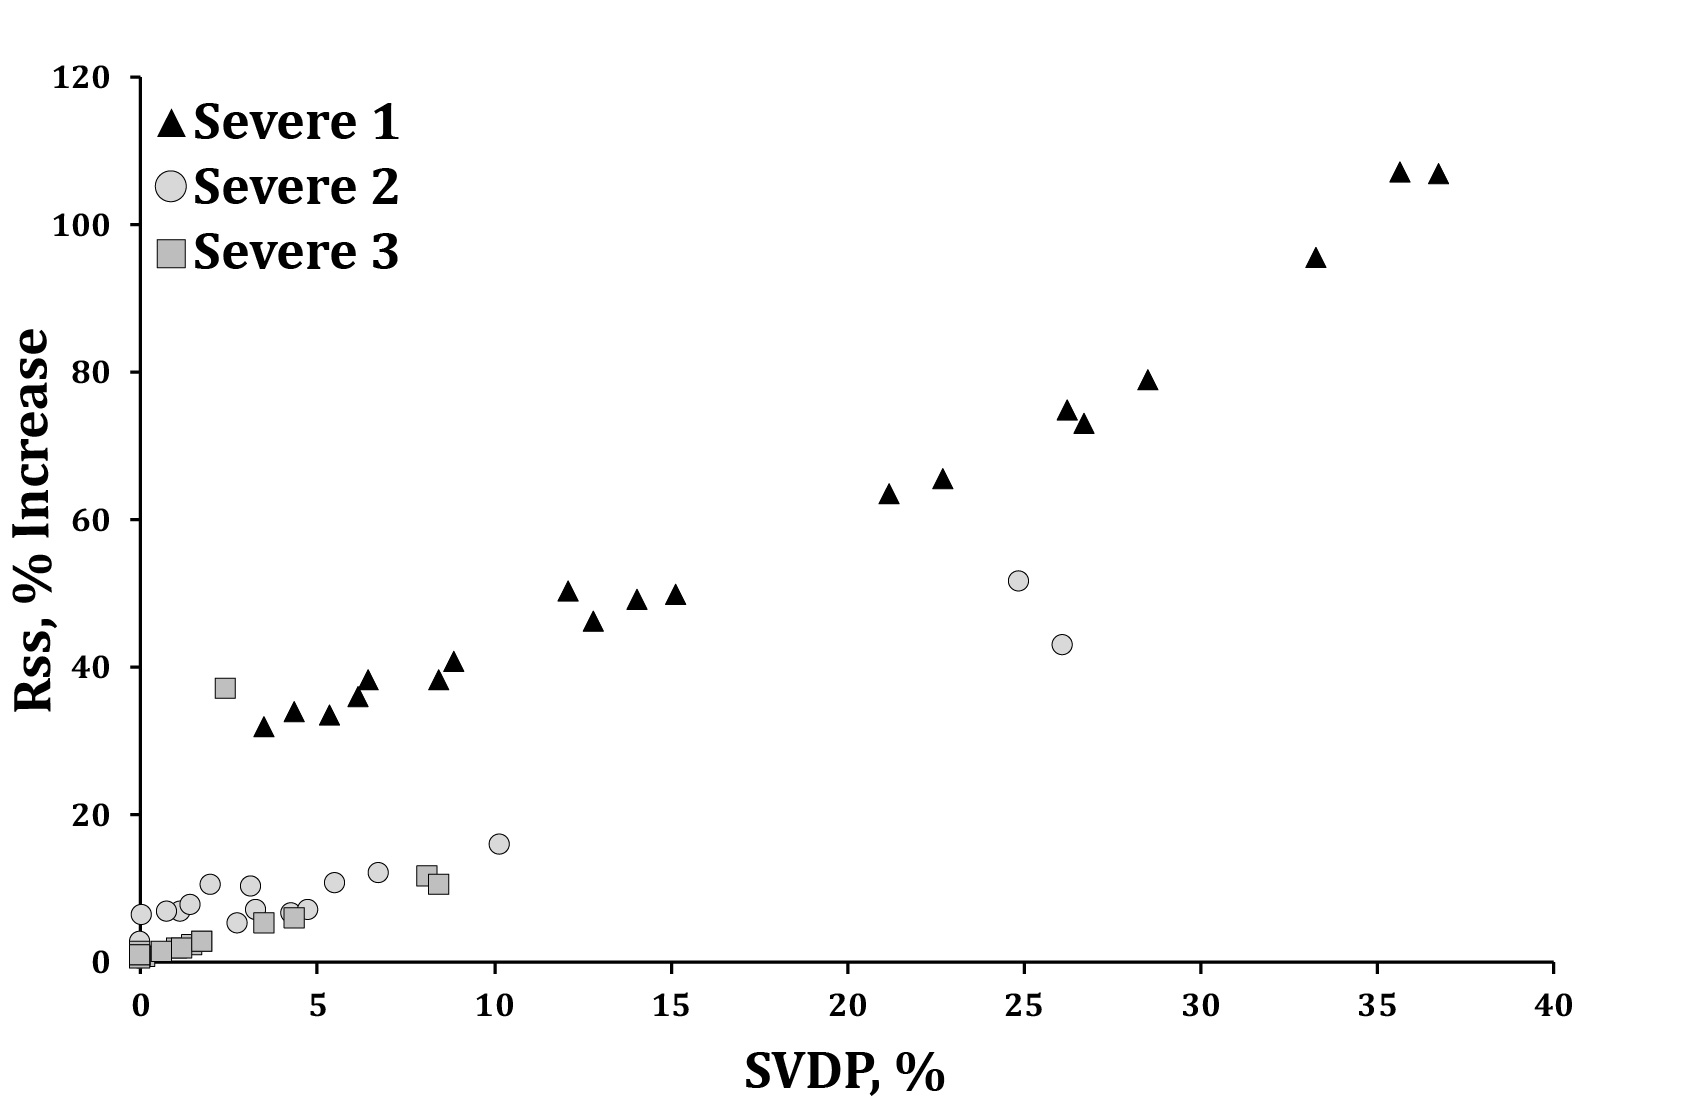
Simulated gas distributions matched within 5% of the measured volumes. We saw variations in pressure distribution between subjects; for instance, the right inferior lobe of subject 2 has larger pressure gradients compared to the other subjects (Figure 2). Predicted peripheral resistance is largest in subject 1 (Table 2), correlating with subject 1’s low FEV1 percent predicted (53.9%), large amount of gas trapping (21.21%, defined as the relative area under -856 Hounsfield units measured from the CT images), and 11 mucus-plugged airways, measured from the CT data (Table 1). As expected, Rss increased to match the MRI-measured ventilation defects, and the largest change in Rss is observed for the subject with the highest SVDP (Figure 3). Central airway resistances vary among the three subjects and subject 2 has the largest central resistance, likely because this subject has relatively smaller bronchi (Figure 2). In addition, we observe a correlation between central resistances and $$$\overline{WSS}$$$ (Table 2).Discussion:
Pinpointing regional airway obstruction in asthmatics is challenging, as gold standard clinical measures are only indicative of whole-lung function. On the other hand, state-of-the-art MR imaging methods can provide insights into regional ventilation distributions and are associated with severe asthma outcomes. When coupled with in silico models, they can provide detailed information on lung mechanics and gas flow patterns. Here we show that by using SVDP to estimate Rss, we effectively distinguish between central and peripheral resistances. Indeed, we show variability in predicted central and peripheral resistances between the three severe subjects, suggesting that, while clinically they are defined as the same, their pathophysiology is notably different. Although we only present a small group of subjects, results indicate that there is a link between SVDPs, spirometry test results, air trapping measurements, and predicted peripheral resistances.Conclusion:
This work highlights the ability to combine CT images, HP gas MRI, and patient-specific computational models to predict gas flow distributions, central and peripheral resistances, and wall shear stresses in the lungs of severe asthmatics. Predicted data highlights the potential to sub-classify severe asthma based on central versus peripheral pathology.Acknowledgements
This work is supported by grant NIH/NHLBI R21 HL140436-01; NIH/NHLBI R01 HL069116; R01 HL080412; U10 HL109168; NIH/NCATS UL1TR000427.References
1. D. Mummy, S. Kruger, W. Zha, R. Sorkness, N. Jarjour, M. Schiebler, L. Denlinger, M. Evans, and S. Fain, “Ventilation defect percent in helium-3 magnetic resonance imaging as a biomarker of severe outcomes in asthma,” Journal of Allergy and Clinical Immunology, vol. 141, pp. 1140–1141, 2018.
2. Oakes, Jessica M., David Mummy, Kamran Poorbahrami, Wei Zha, and Sean B. Fain. "Patient-Specific Computational Simulations Of Hyperpolarized 3he Mri Ventilation Defects In Healthy And Asthmatic Subjects." IEEE Transactions on Biomedical Engineering (2018). DOI: 10.1109/TBME.2018.2872845
3. “Proceedings of the ATS Workshop on Refractory Asthma REFRACTORY ASTHMA: DEFINITION AND DIAGNOSIS,” Am J Respir Crit Care Med, vol. 162, no. 6, pp. 2341–2351, 2000.
4. A. Updegrove, N. M. Wilson, J. Merkow, H. Lan, A. L. Marsden, and S. C. Shadden, “SimVascular: An Open Source Pipeline for Cardiovascular Simulation,” Ann Biomed Eng, vol. 45, pp. 525–541, 2017.
5. E. D’Angelo, E. Calderini, G. Torri, F. M. Robatto, D. Bono, and J. Milic-Emili, “Respiratory mechanics in anesthetized paralyzed humans: effects of flow, volume, and time.” J Appl Physiol, vol. 67, no. 6, pp. 2556–2564, 1989.
6. Busacker, Ashley, John D. Newell Jr, Thomas Keefe, Eric A. Hoffman, Janice Cook Granroth, Mario Castro, Sean Fain, and Sally Wenzel. "A multivariate analysis of risk factors for the air-trapping asthmatic phenotype as measured by quantitative CT analysis." Chest 135, no. 1 (2009): 48-56.
7. P. H. Quanjer, S. Stanojevic, T. J. Cole, X. Baur, G. L. Hall, B. H. Culver, P. L. Enright, J. L. Hankinson, M. S. Ip, J. Zheng, J. Stocks, and C. Schindler, “Multi-ethnic reference values for spirometry for the 3-95-yr age range: The global lung function 2012 equations,” European Respiratory Journal, vol. 40, no. 6, pp. 1324–1343, 2012.
Figures