1882
Ventilation perfusion matching in patients with Cystic Fibrosis assessed via co-registered hyperpolarised gas and dynamic contrast enhanced lung MRI1POLARIS, Academic Unit of Radiology, Department of Infection, Immunity and Cardiovascular Disease, The University of Sheffield, Sheffield, United Kingdom, 2Sheffield Children's Hospital, Sheffield Children's NHS Foundation Trust, Sheffield, United Kingdom, 3Sheffield Teaching Hospitals NHS Foundation Trust, Sheffield, United Kingdom, 4Respiratory Research Group, Division of Infection, Immunity & Respiratory Medicine, University of Manchester, Manchester, United Kingdom, 5Insigneo Institute for in silico Medicine, The University of Sheffield and Sheffield Teaching Hospitals NHS Foundation Trust, Sheffield, United Kingdom
Synopsis
Assessment of regional ventilation and perfusion is of clinical interest for better understanding of disease mechanisms and lung pathophysiology, as the primary function of the lung is gas exchange. This work aimed to assess ventilation and perfusion in patients with Cystic Fibrosis using co-registered hyperpolarised gas and dynamic contrast enhanced lung MRI.
Introduction
Perfusion (Q) changes in Cystic Fibrosis (CF) have been explored using non-contrast methods such as Fourier decomposition MRI1,2 as well as the standard dynamic contrast enhanced (DCE) imaging methods utilising a paramagnetic contrast agent3,4. In these studies to date, ventilation (V) was assessed with either Fourier decomposition or oxygen enhanced 1H MRI surrogate methods. Many of these publications report altered perfusion and ventilation in patients with CF when compared to healthy controls, however, the relationship between defects present in ventilation and perfusion images has generally been assessed qualitatively.Purpose
To develop a registration and analysis framework to assess ventilation and perfusion matching in patients with CF using co-registered hyperpolarised gas and dynamic contrast enhanced lung MRI.Methods
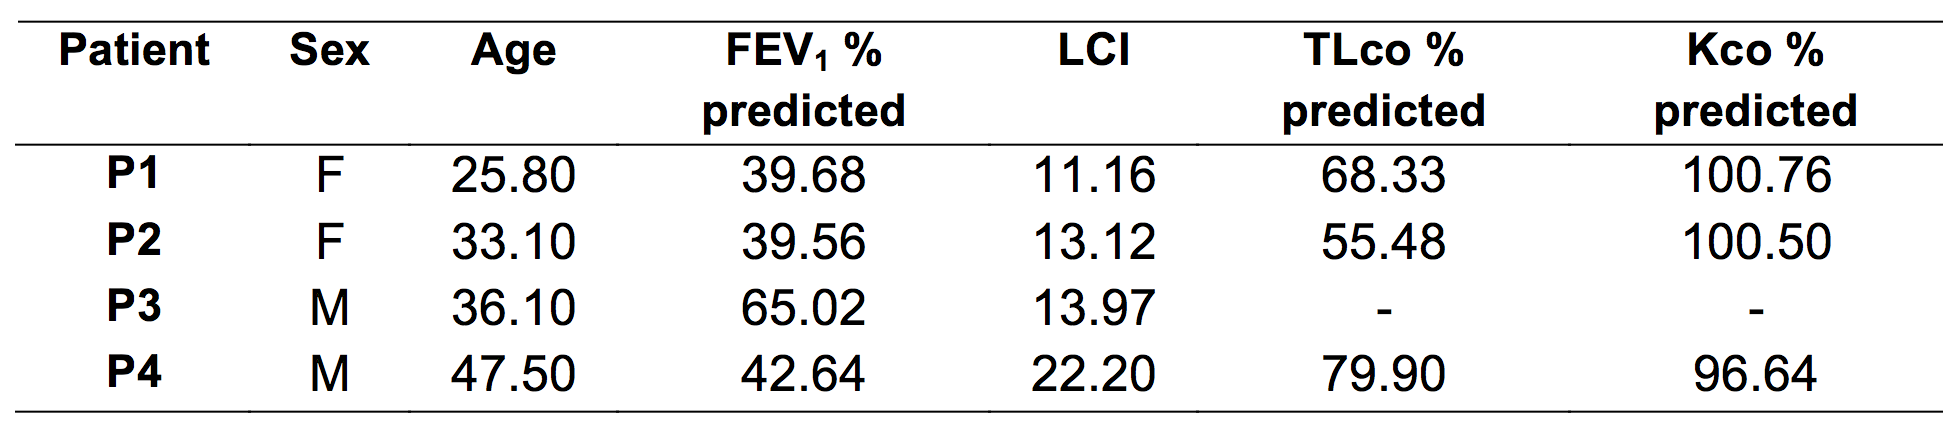
Four patients with CF were scanned using same-breath hyperpolarised helium-3 (3He) and proton (1H) anatomical lung MRI5 and DCE perfusion MRI at 1.5T (GE HDx, Milwaukee, WI). Patients also performed spirometry, gas transfer (TLco) and multiple breath washout6 using 0.2% SF6 on the same day as MR imaging.
3He / 1H anatomical imaging: Patients were imaged using a 3He transmit-receive vest coil (CMRS) after inhalation of a mix of hyperpolarised 3He (140-150ml) and N2 (660-850ml), the volume of which was titrated based on the height of the patient, from functional residual capacity. 3He images were acquired using a 3D balanced steady state free precession sequence (acquisition matrix of 100x100, BW=±83.3kHz, TE=0.6ms, TR=1.9ms, FA=10°) whilst corresponding anatomical images were acquired using a 3D spoiled gradient echo sequence in the same breath-hold5.
DCE perfusion imaging: Patients were repositioned in an 8-element 1H chest receiver coil. DCE perfusion images were acquired with 36-48 time-frames at approximately 0.5 seconds per volume (full lung coverage) using an SPGR sequence with TRICKS7 and SENSE8 factor 2 using an acquisition matrix of 200x80, BW of ±125kHz, TE of 0.8/0.7ms, TR of 2.3/2.1ms and a flip angle of 30°. Imaging began at the same time as the injection of Gadovist (0.05ml/kg injected at 4ml/s followed by a saline flush of 20ml at the same flow rate).
Image analysis: 3He and corresponding 1H images were segmented semi-automatically using spatial fuzzy c-means as previously described9 to calculate the percentage ventilated volume (%VV). DCE images were co-registered to the same spatial domain as the 1H anatomical image using the ANTs registration toolkit10 (Figure 1). Taking the maximum signal value in the temporal dimension of the DCE dataset and subtracting the baseline signal generated peak signal enhancement perfusion images. DCE peak signal enhancement images were segmented by manually outlining the lung parenchyma and applying a threshold (within 2 standard deviations of noise) to identify perfusion defects. Percent perfused volume (%PV) was then calculated in the same manner as %VV. Percent perfused and ventilated (%VQ) volume was calculated by determining the intersect of ventilation and perfusion masks and applying the same methodology for calculation of %VV. Finally, the Dice similarity coefficient (DSC)11 of the ventilation and perfusion masks was calculated to measure the amount of V/Q matching.
Results
Patient demographics and pulmonary function test results are given in Table 1 whilst imaging metrics are given in Table 2. Figure 1 shows an example image dataset from patient 3 and the resulting masks. As can be seen there is some V/Q mismatch in the upper right lobe of this patient, whereas the left upper lobe appears to be non-perfused as well as unventilated. %VV is decreased in these patients as is %PV. Three out of the four patients had less than 50% of the lung both ventilated and perfused. All patients had a ventilation-perfusion overlap (DSC(V,Q)) less than 0.9, showing with the definitions of ventilated and perfused areas here, there is considerable mismatch in this small cohort of patients.Discussion and conclusions
An analysis pipeline was developed to quantitatively assess the matching of ventilation and perfusion in patients with CF on a voxel-by-voxel basis. Based on DSC(V,Q) there appears to be considerable mismatch in V and Q in patients with CF. Longitudinal assessment of these patients would help ascertain the pathway of destruction and the relationship between V and Q in patients with CF. Finally, future work shall focus on increased numbers of patients being analysed to allow correlation of imaging metrics with pulmonary function test values in order to put the imaging metrics into context physiologically.Acknowledgements
NIHR, MRC, Cystic Fibrosis Trust and GlaxoSmithKline for fundingReferences
- G. Bauman, et al., European journal of radiology, 2013. 82(12): p. 2371-2377.
- P. Leutz-Schmidt, et al., European journal of radiology, 2018. 101: p. 178-183.
- M. O. Wielpütz, et al., American journal of respiratory and critical care medicine, 2014. 189(8): p. 956-965.
- T. F. Kaireit, et al., PloS one, 2017. 12(12): p. e0187483.
- F. Horn, et al., NMR in biomedicine, 2014. 27(12): p. 1461-1467.
- A. R. Horsley, et al., Thorax, 2008. 63(2): p. 135-140.
- F. R. Korosec, et al., Magnetic Resonance in Medicine, 1996. 36(3): p. 345-351.
- K. P. Pruessmann, et al., Magnetic resonance in medicine, 1999. 42(5): p. 952-962.
- P. J. Hughes, et al., Journal of Magnetic Resonance Imaging, 2018. 47(3): p. 640-646.
- B. B. Avants, et al., Insight J, 2009.
- L. R. Dice, Ecology, 1945. 26(3): p. 297-302.
Figures