1880
Comparison of quantified pulmonary blood flow using phase-resolved functional lung (PREFUL) MRI and dynamic contrast enhanced MRI in COPD, CF and CTEPH patients1Institute of Diagnostic and Interventional Radiology, Hannover Medical School, Hannover, Germany, 2Biomedical Research in Endstage and Obstructive Lung Disease Hannover (BREATH), German Center for Lung Research (DZL), Hannover, Germany
Synopsis
Phase-resolved functional lung (PREFUL) MRI is a very promising method for contrast agent free pulmonary perfusion measurement in free breathing. Still a large-scale validation of quantified pulmonary blood flow (PBFPREFUL) with the current gold standard PBFDCE derived by dynamic contrast enhanced (DCE) MRI is missing. Therefore, 52 patients with COPD, CF and CTEPH were included in this study and the correlations for PBFPREFUL and PBFDCE were assessed. Except for CTEPH, strong and moderate correlations were found. Low or no correlation can be explained by respiratory motion (DCE) and perfusion delay (PREFUL).
Introduction
Fourier Decomposition (FD) MRI1 derived methods allow for contrast agent free measurement of lung perfusion during free breathing. Although a quantification method for FD perfusion imaging was introduced2, no large-scale validation of this method with dynamic contrast enhanced (DCE) MRI was conducted. Therefore, this study focuses on the comparison of pulmonary blood flow (PBFPREFUL) derived by phase-resolved functional lung (PREFUL) MRI3 and PBFDCE derived by DCE in patients with chronic obstructive pulmonary disease (COPD), cystic fibrosis (CF) and chronic thromboembolic pulmonary hypertension (CTEPH). Furthermore, quantification of FD perfusion was demonstrated for a single slice only2. Since for quantification a completely blood-filled voxel is necessary, which is not available in every slice, in this study it is tested, whether a completely blood-filled voxel from a tracheal slice can be used for quantification of more than one coronal FD slice.Methods
Acquisition: PREFUL and DCE data were acquired for 20 COPD, 12 CF and 20 CTEPH patients on a 1.5T MR-scanner (Avanto or Aera, Siemens Healthcare, Germany). For PREFUL, a 2D-FLASH (TE=0.7ms-0.9ms, TR=3ms, flip angle=5°-8°, slice thickness=15mm, temporal resolution: 290ms) and for DCE a 3D-FLASH sequence (TE=0.7ms, TR=2.1ms-2.9ms, flip angle=10°-25°, slice thickness=5mm-6mm, temporal resolution: 800ms-1100ms, averaged duration of breath hold: 50s) was used.
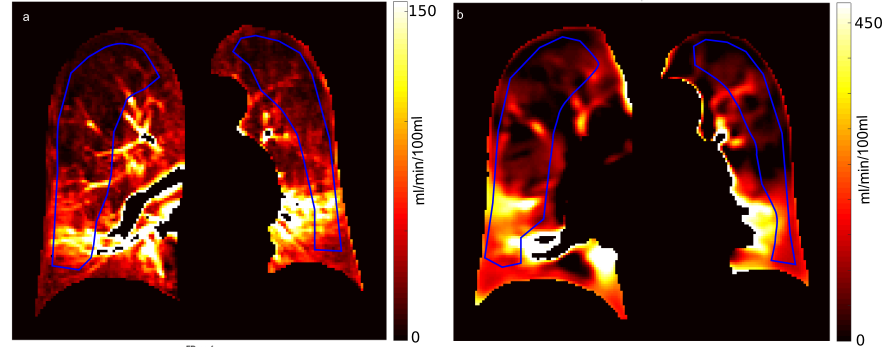
Post-processing: PREFUL post-processing was performed as described previously3. For each patient, three coronal slices were quantified2 (Figure 1b) by normalizing the phase-dependent signal amplitude (SA) of every voxel by the perfusion signal amplitude of a completely blood-filled voxel in the middle slice (SA,blood) located at the aortic arch: $$$PBF_{PREFUL}=\frac{S_{A}}{S_{A,blood}}\cdot\frac{1}{2\cdot t_{perf}}$$$ (tperf: time between two heartbeats). For calculation of PBFDCE, model-free deconvolution was used4 (Figure 1a). The arterial input function was determined inside the pulmonary artery.
Data analysis: Excluding large vessels, lung parenchyma was segmented as region of interest (ROI) and divided into sub-ROIs containing the left and right lung as well as the upper and lower left and right lung. Median PBFPREFUL and PBFDCE were computed and Pearson correlation coefficients r were determined.
Results
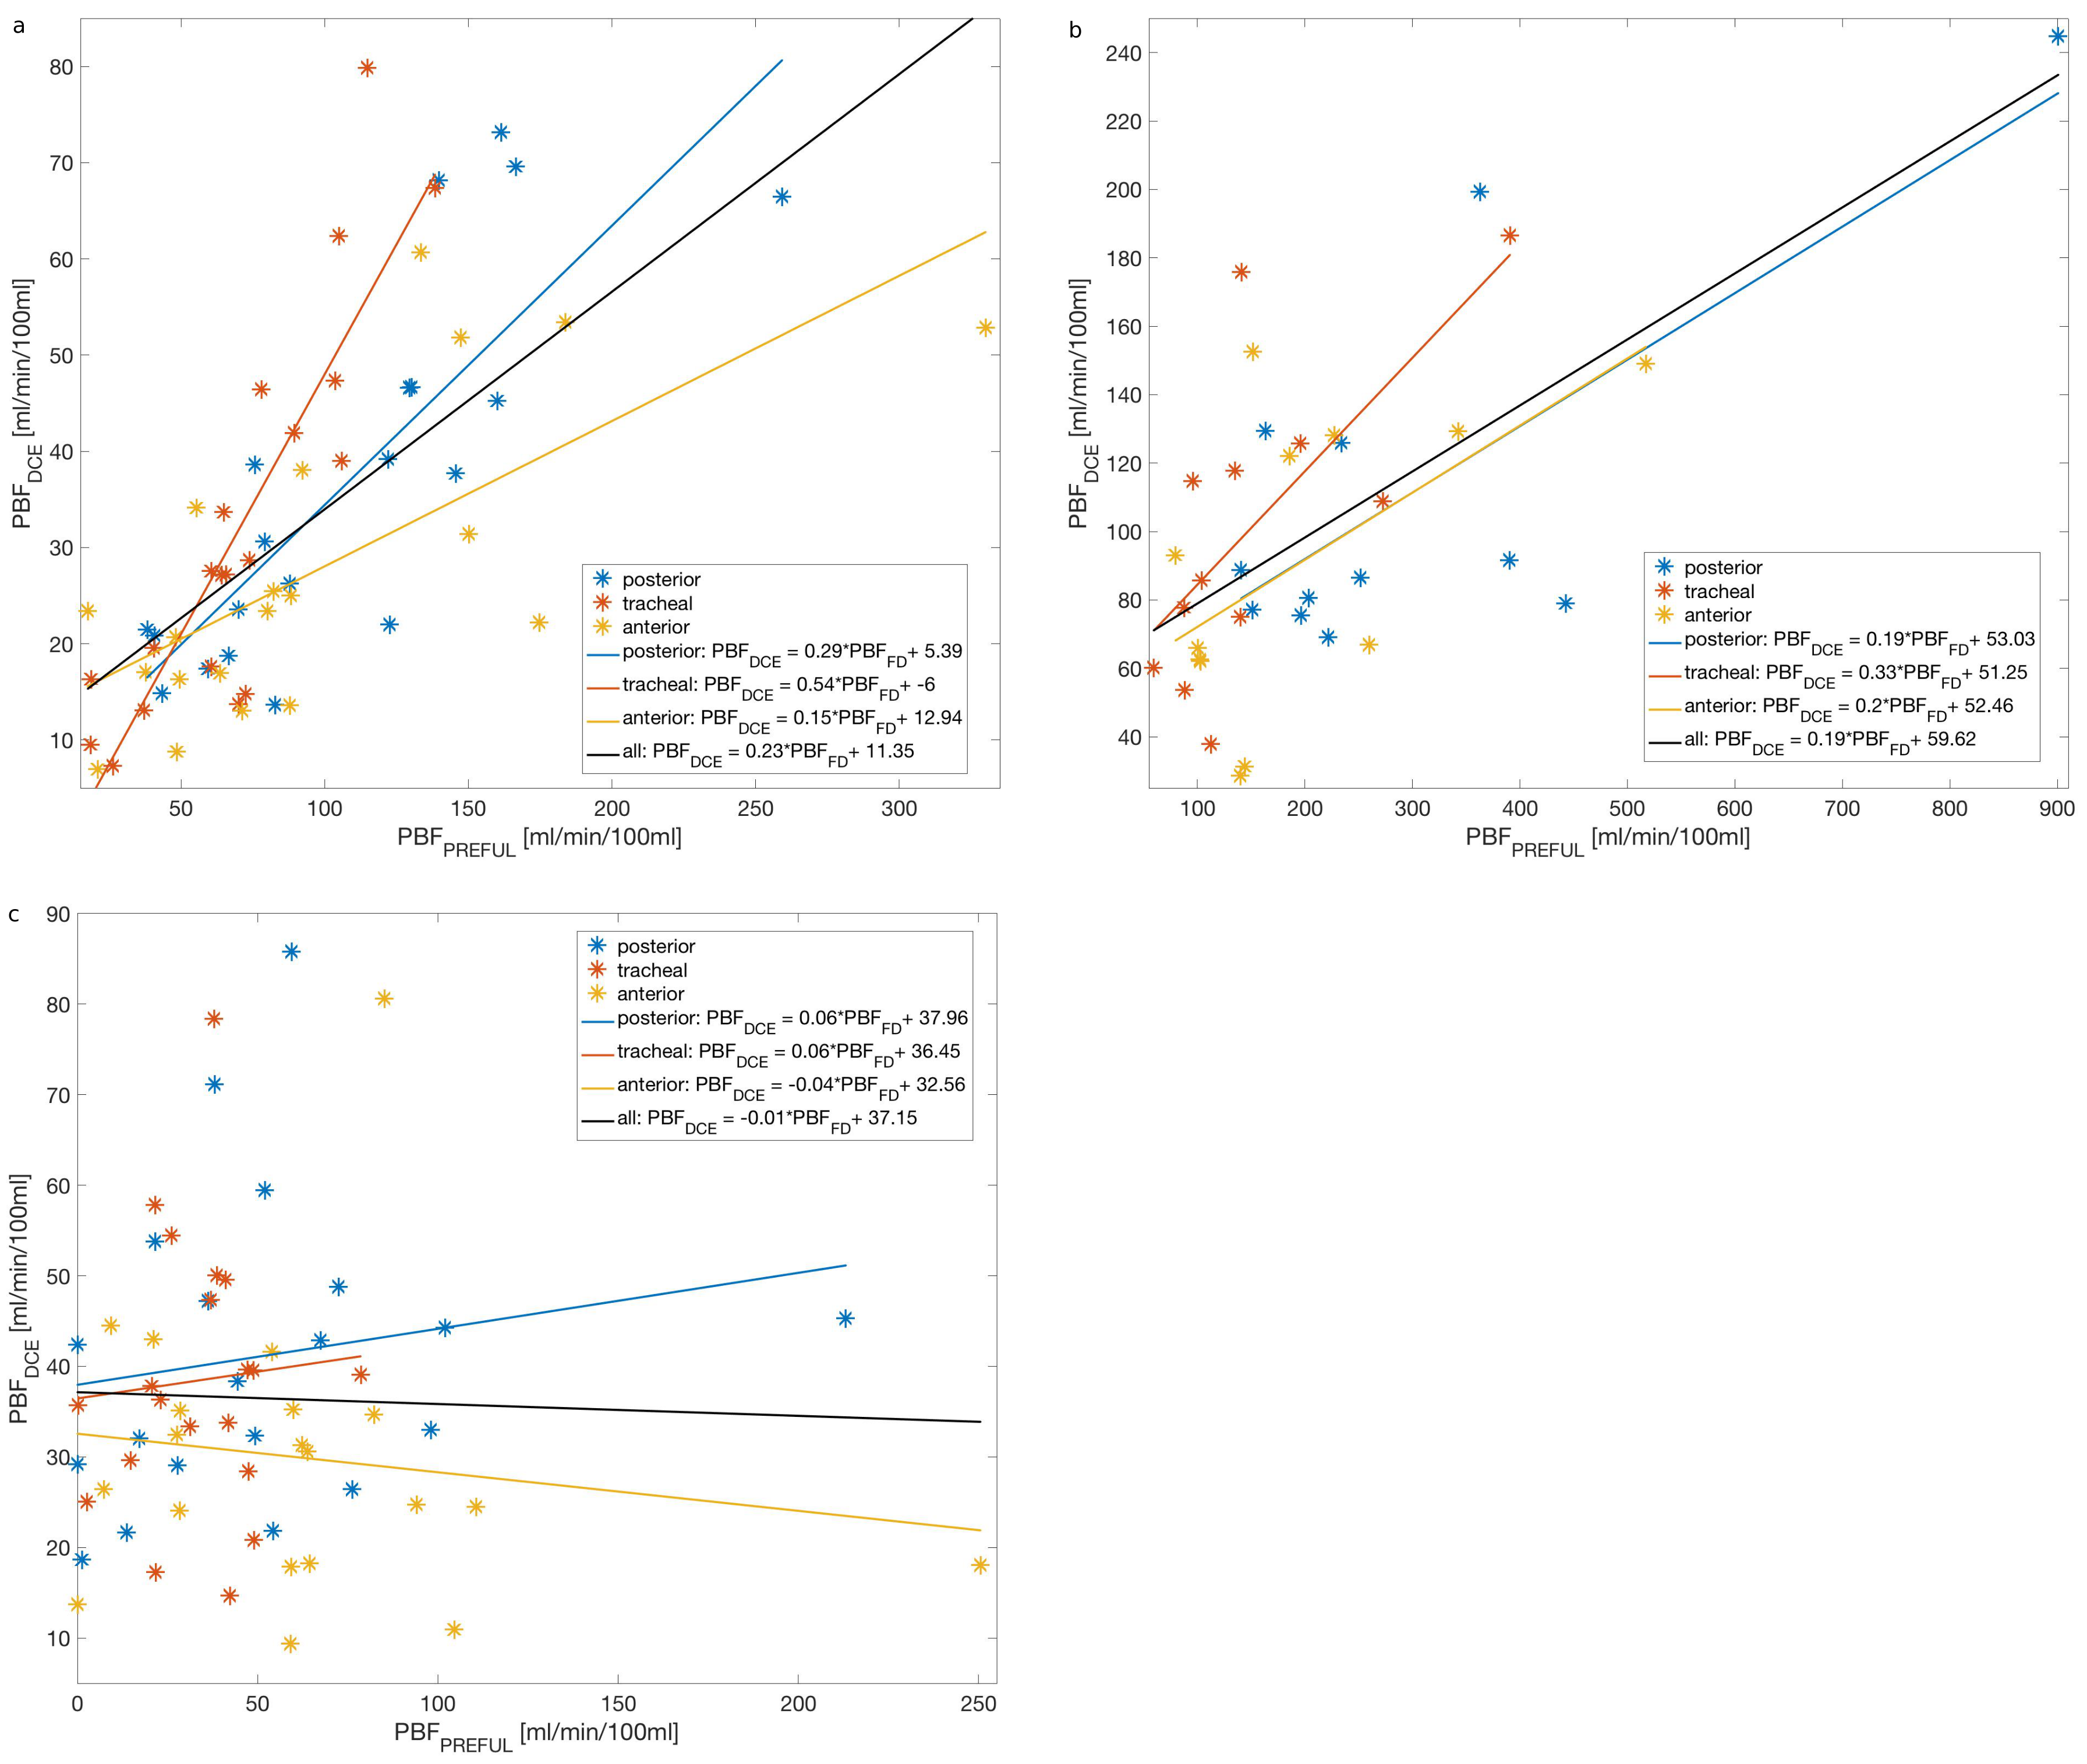
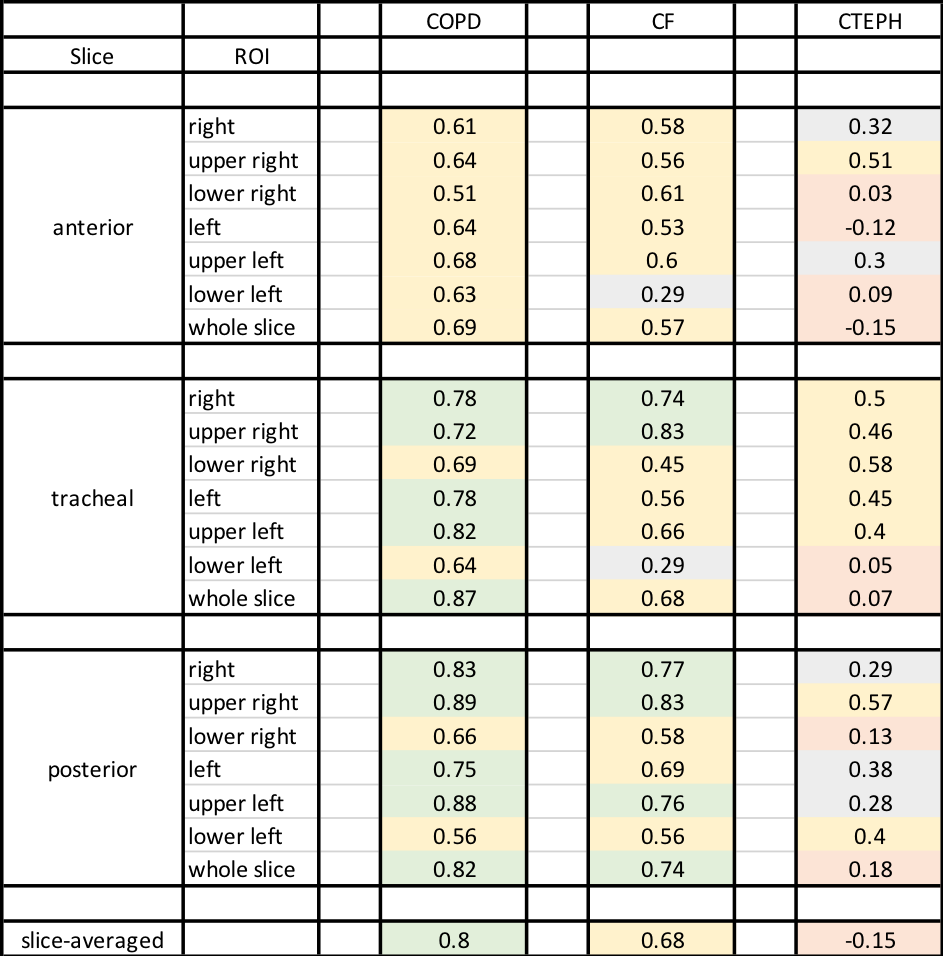
Correlation coefficients are listed in Table 1, perfusion values in Table 2. Strong and moderate correlations (r=0.51-0.89) were obtained for individual ROIs of COPD patients (Figure 2). The correlation for slice-averaged PBF was strong (r=0.8). Strong and moderate correlations (r=0.45-0.83) were found for most individual ROIs of CF patients. Similarly, to the COPD patients, the slice-averaged PBF showed a moderate correlation (r=0.68). For the CTEPH patients, low and moderate correlations (r=0.28-0.58) were found for most individual ROIs of the posterior and tracheal slice. No or low correlations were found for most ROIs of the anterior slice as well as for multi-slice PBF comparison. For all patient cohorts DCE-perfusion values decreased from the posterior to the anterior slice. In general, PREFUL perfusion values were up to three times higher than DCE values and no perfusion gradient from posterior to anterior was seen.Discussion
Despite good visual agreement5 and strong to moderate correlation in most lung regions of COPD and CF patients as well as in the tracheal slice of CTEPH patients, there are some regions with low or no correlation especially in the anterior slice of CTEPH patients. Some patients were not able to complete the necessary breath hold for DCE data acquisition. Therefore, remaining respiration may have affected the perfusion values. Furthermore, the correct estimation of SA,blood for PREFUL quantification is difficult due to high signal variability inside the aorta and therefore affects the PBFPREFUL values. Signal strength can be slice-dependent and influenced by B1-field inhomogeneities, inaccuracies of the estimated receive coil sensitivities and by the angle between the direction of the blood flow and the imaging plane. Since CTEPH is caused by obstruction of pulmonary vessels6,7, delayed perfusion of the right or left lung may influence perfusion values of PREFUL and causes lower correlation compared to COPD and CF. Depending on the selected phase for SA determination, differences in PBFPREFUL values can occur. Hence further corrections are needed to improve the agreement between both methods especially regarding absolute values.Conclusion
In this work, using PREFUL MRI a large-scale comparison between a
previously proposed perfusion quantification method of FD and the widely
accepted DCE-method was performed. For COPD and CF, strong and moderate
correlations were obtained. Lower correlations were found for CTEPH. Therefore,
both methods need improvement, especially concerning correct estimation of
signal amplitude in PREFUL and respiratory motion in DCE.Acknowledgements
This work was supported by the German Centre for Lung Research (DZL).References
1. Bauman G, Puderbach M, Deimling M, et al. Non-contrast-enhanced perfusion and ventilation assessment of the human lung by means of Fourier decomposition in proton MRI. Magn. Reson. Med. 2009;62:656-64
2. Kjørstad A, Corteville DM, Fischer A, et al. Quantitative lung perfusion evaluation using Fourier decomposition perfusion MRI. Magn. Reson. Med. 2014;72:558-562
3. Voskrebenzev A, Gutberlet M, Klimes F, et al. Feasibility of quantitative regional ventilation and perfusion mapping with phase-resolved functional lung (PREFUL) MRI in healthy volunteers and COPD, CTEPH, and CF patients. Magn. Reson. Med. 2017;0:1-9
4. Sourbron S, Dujardin M, Makkat S, et al. Pixel-by-pixel deconvolution of bolus-tracking data: optimization and implementation. Phys Med Biol. 2007;52(2):429-447
5. Bauman G, Puderbach M, Heimann T, et al. Validation of Fourier decomposition MRI with dynamic contrast-enhanced MRI using visual and automated scoring of pulmonary perfusion in young cystic fibrosis patients. Eur. J. Rad. 2013;82:2371-2377
6. Olsson K, Meyer B, Hinrichs J, et al. Chronic thromboembolic pulmonary hypertension. Dtsch Arztebl Int 2014;111:856–62.
7. Lang I, Pesavento R, Bonderman D, et al. Risk factors and basic mechanisms of chronic thromboembolic pulmonary hypertension: a current understanding Eur. Respir. J. 2013;41:462-468
Figures