1879
Ventilation defects on hyperpolarized helium-3 MRI are predictive of 2-year exacerbation frequency in asthma1Biomedical Engineering, University of Wisconsin-Madison, Madison, WI, United States, 2Medical Physics, University of Wisconsin-Madison, Madison, WI, United States, 3Biostatistics and Medical Informatics, University of Wisconsin-Madison, Madison, WI, United States, 4Medicine, University of Wisconsin-Madison, Madison, WI, United States, 5Pharmacy, University of Wisconsin-Madison, Madison, WI, United States, 6Pediatrics, University of Wisconsin-Madison, Madison, WI, United States, 7Radiology, University of Wisconsin-Madison, Madison, WI, United States
Synopsis
Ventilation defects on hyperpolarized 3He MRI in asthma are predictive of exacerbation frequency in the two years following imaging. Incorporating VDP and exacerbation history into a single model allows for a decision-tree based approach to assessing propensity for asthma exacerbation.
Purpose
Ventilation defects on hyperpolarized helium-3 magnetic resonance imaging (HP 3He MRI) in asthma have been associated with severe exacerbation in both retrospective1 and prospective studies2. However, these studies did not assess the utility of VDP as a predictor of asthma exacerbation frequency (i.e. cumulative exacerbations over a specified period of time). Incorporating history of recent exacerbation may also inform and improve models of VDP as a predictor of exacerbation frequency.Methods
66 asthma subjects (27M 39F, 28 mild/moderate and 38 severe) drawn from the Severe Asthma Research Program (SARP) underwent HP 3He MRI during a period of disease stability, and defect extent was measured using the ventilation defect percent (VDP)3. VDP was compared with spirometry and with blood and sputum eosinophils using Spearman’s correlation. The number of asthma exacerbations was recorded prospectively over the two-year period following imaging. We used a Poisson regression tree model to assess associations between VDP and exacerbation frequency and estimate an optimal VDP threshold. We then expanded the model to include a binary indicator of a record of severe (i.e. requiring systemic corticosteroid) exacerbation during the 12 months prior to imaging as an additional predictor of exacerbation frequency.Results
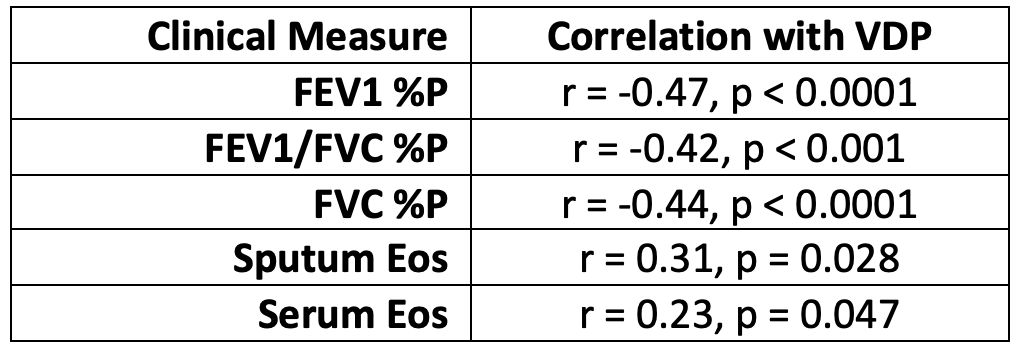
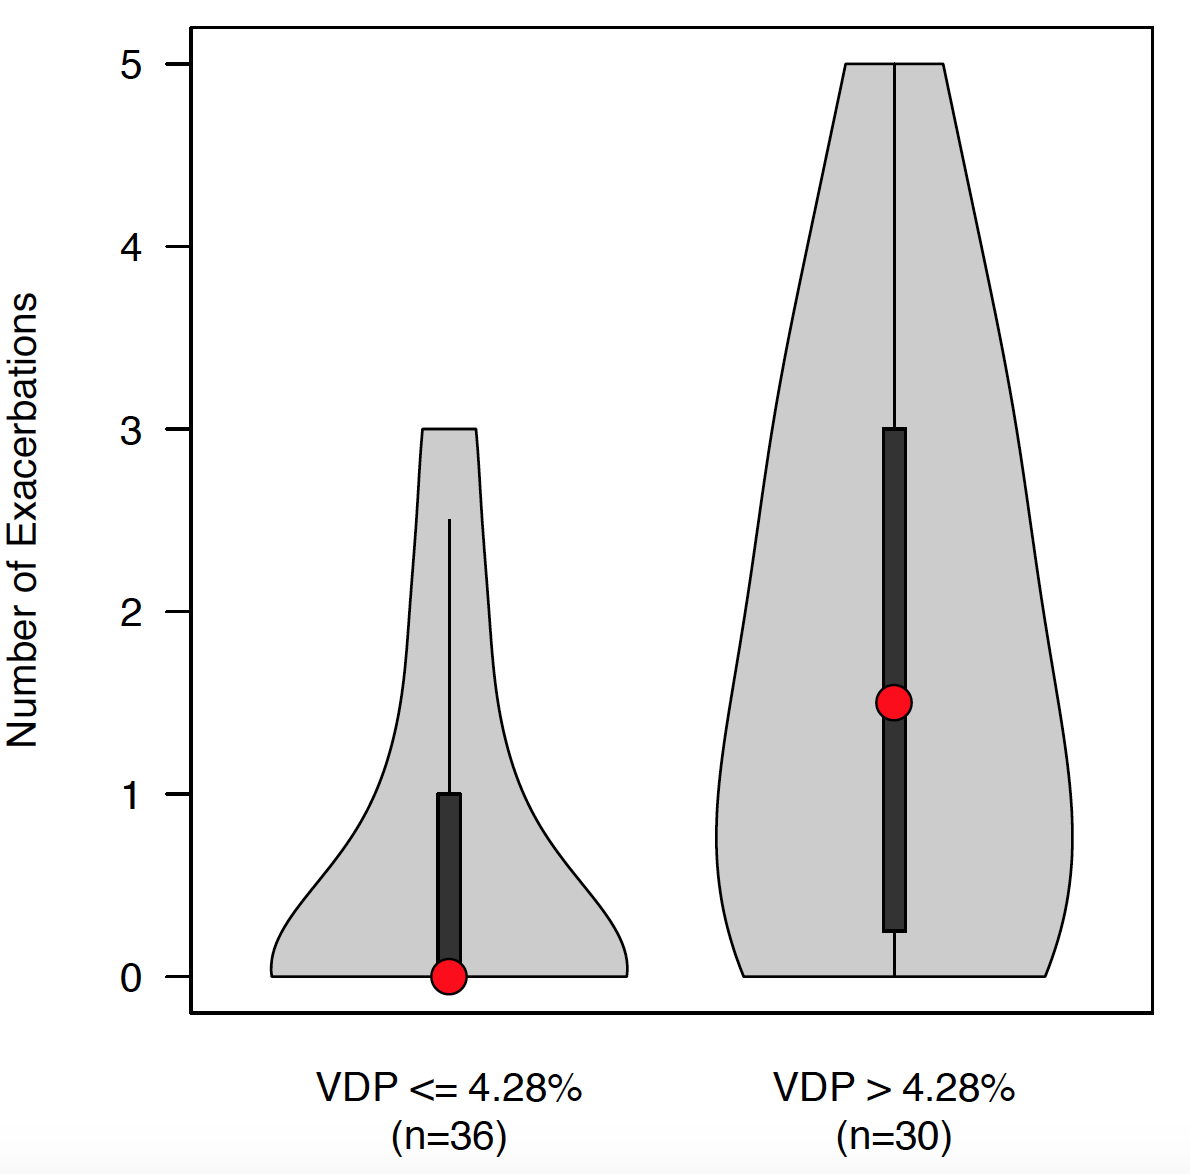
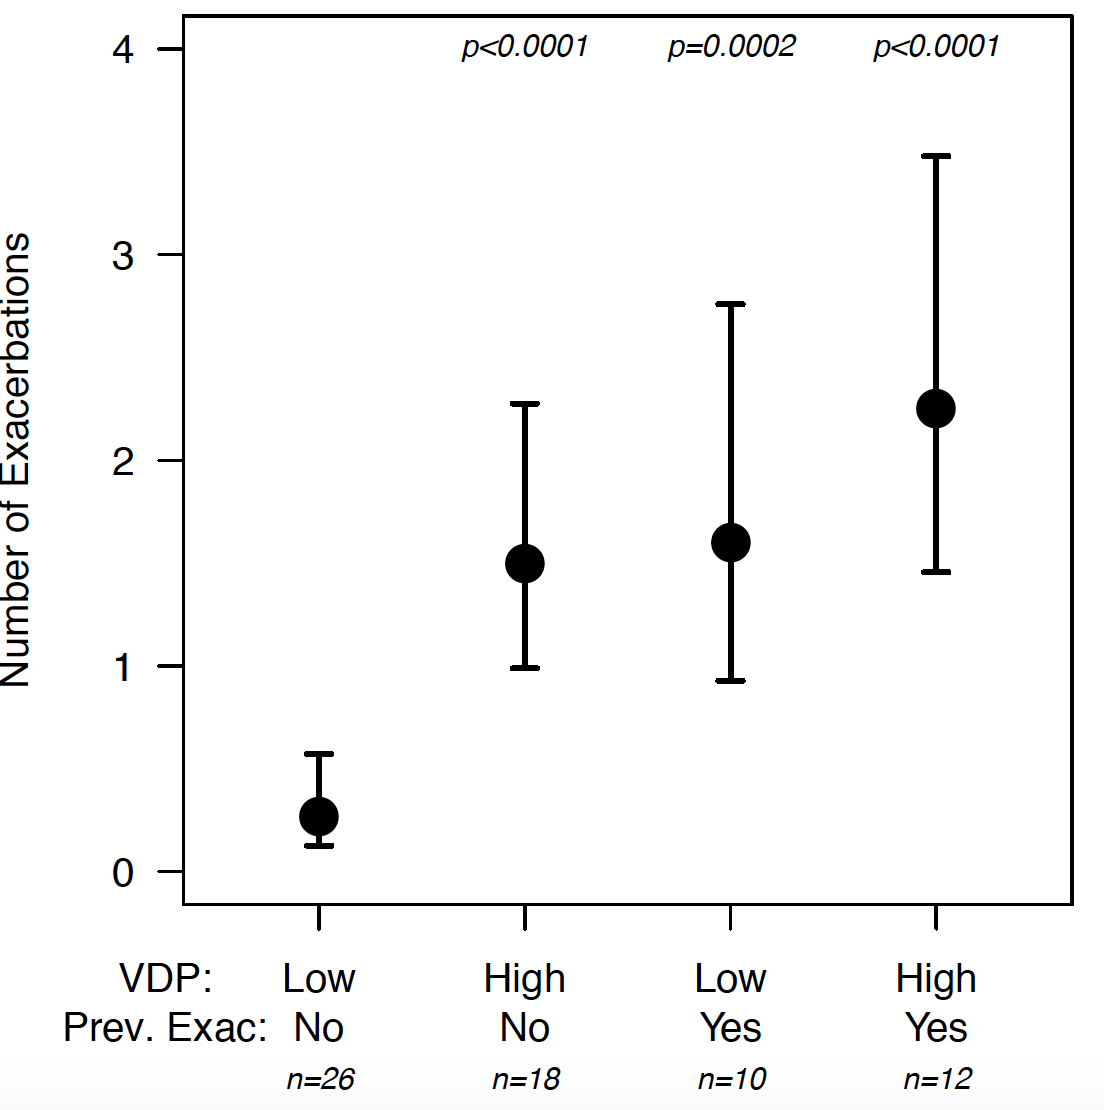
Median [1Q – 3Q] VDP was 5.6% [2.6% - 13.6%] in severe subjects vs. 1.9% [0.55% - 3.0%] in mild/moderate subjects. VDP was negatively correlated with forced expiratory volume in 1 second (FEV1) percent predicted (%P), FEV1 divided by forced vital capacity (FVC) %P (FEV1/FVC %P), and FVC %P, and positively correlated with measurements of eosinophils in blood and sputum (Table 1). A VDP threshold of 4.28% was selected based on maximum likelihood estimation of the regression tree model. Subjects with VDP exceeding the threshold (N = 30) had 1.5 [0.25 - 3.0] exacerbations vs. 0.0 [0.0 - 1.0] for subjects below the threshold (N = 36, Figure 1). The exacerbation frequency ratio for subjects above vs. below the VDP threshold was 2.8 (95% CI 1.6 - 5.2), p=0.001. By comparison, subjects classified as severe (N =38) had 1.0 [0.0 - 2.75] exacerbations vs. 0.0 [0.0 - 1.0] for mild/moderate subjects (N = 28), and the corresponding exacerbation frequency ratio was 2.4 (95% CI 1.3 - 4.9), p = 0.01. In the model incorporating both recent severe exacerbation and VDP as predictors of exacerbation frequency, we found that VDP above 4.28% (p=0.0006) and prior severe exacerbation (p=0.001) were each risk factors for increased exacerbation frequency. Importantly, among subjects without a recent severe exacerbation, those with VDP above the threshold (n=18) had more frequent exacerbations than those below (n=26) (exacerbation frequency ratio = 5.6, p<0.0001), as shown in Figure 2.Discussion
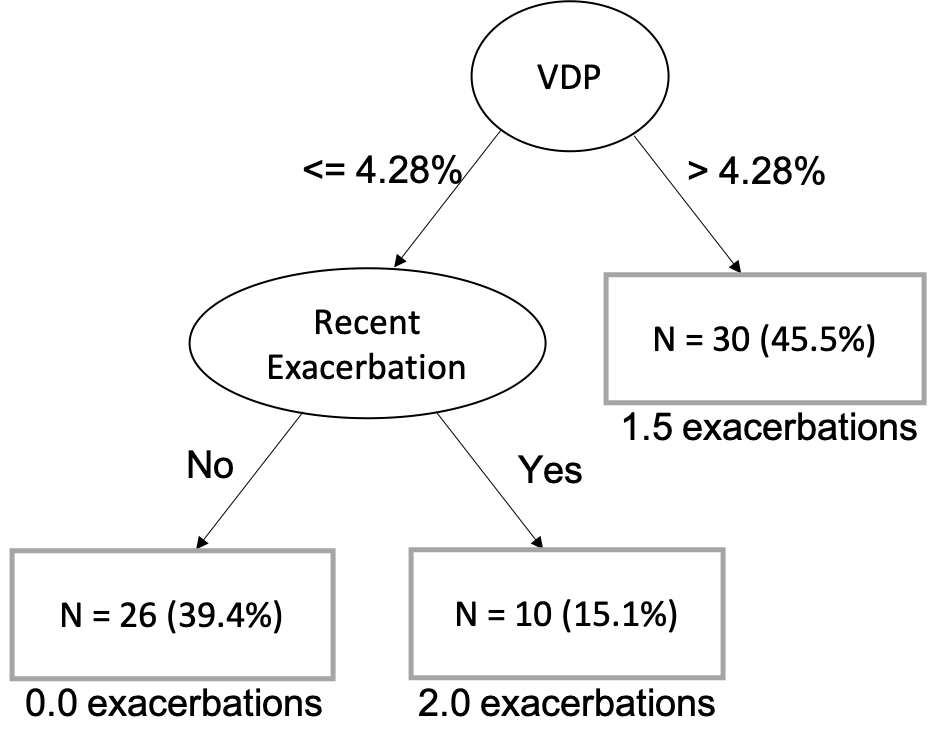
We found that the ventilation defect percent (VDP) on hyperpolarized gas MRI is predictive of exacerbation frequency in the two years following imaging, corroborating previously published results1 showing that VDP was associated with a history of severe exacerbation. We also found that severe exacerbation prior to imaging was an important mediator in models of VDP as a predictor of exacerbation frequency. These results suggest that measurements of VDP in the context of exacerbation history may enable a decision-tree based approach (Figure 3) to monitoring treatment response both in individual subjects and in clinical trials, and for selecting patients in need of intensive therapy intervention.Conclusion
VDP on HP 3He MRI in asthma is predictive of exacerbation frequency over a two-year period following imaging, and these models are further improved by incorporating records of recent severe exacerbation. These results provide further evidence for VDP as a possible clinical biomarker of propensity for severe outcomes in asthma.Acknowledgements
The authors would like to acknowledge funding from RO1 HL115118 and U10 HL109168, as well as funding from GE Healthcare for MRI research at UW-Madison.References
1. D. G. Mummy et al., “Ventilation defect percent in helium-3 magnetic resonance imaging as a biomarker of severe outcomes in asthma,” J. Allergy Clin. Immunol., vol. 141, no. 3, pp. 1140-1141. e4, 2018.
2. D. Mummy et al., “High Ventilation Percent on Hyperpolarized Helium-3 MRI is Associated with Reduced One-Year Risk of Asthma Exacerbation,” ISMRM 2018, Abstract 4463
3. W. Zha et al. “Regional heterogeneity of lobar ventilation in asthma using hyperpolarized helium-3 MRI.” Academic radiology 25.2 (2018): 169-178.
Figures