1877
Comparison of algorithms to determine Ventilated Volume Fraction from Oxygen-Enhanced MRI in Cystic Fibrosis1Bioxydyn Limited, Manchester, United Kingdom, 2Division of Cardiovascular Sciences, University of Manchester, Manchester, United Kingdom, 3Institute for Diagnostic and Interventional Radiology, University Hospital Zurich, Zurich, Switzerland, 4Quantitative biomedical Imaging Lab, Faculty of Biology, Medicine, and Health, University of Manchester, Manchester, United Kingdom
Synopsis
We have compared four different algorithms to determine the ventilated volume fraction (VVF) in a population of 4 healthy volunteers and 21 cystic fibrosis adult patients who underwent volumetric dynamic oxygen-enhanced MRI at 1.5T. Results were compared with pulmonary function tests and a CT-based scoring system (Brody score). All considered methods present significant correlation between VVF and FEV1 (R2>0.5), FVC (R2>0.4), FEV1/FVC (R2>0.4). Weaker correlation was found between VVF and the Brody score (R2 ~0.2).
Introduction
Oxygen Enhanced MRI (OE-MRI) exploits the paramagnetic properties of molecular oxygen to modify local T1 values to explore local lung function. During a dynamic OE-MRI experiment, the subject breath varying concentrations of O2 and the T1-weighted MR signal change in lung tissue is studied. One of the parameters of interest to determine overall lung function is the fraction of lung tissue showing O2 enhancement, analogous to the “ventilated volume” measurement performed in hyperpolarized lung gas imaging [1]. In this work, we compare different algorithms to determine the ventilated volume fraction (VVF) in a population of healthy volunteers (HV) and cystic fibrosis (CF) patients who underwent dynamic OE-MRI. Results were compared with pulmonary function tests and a CT-based scoring system.Methods
Analysis was applied retrospectively to OE-MRI data acquired from a previously published study [2]. 21 patients with CF (20 - 40 years, 13 male) and 4 healthy volunteers (27-37 y, 2 male) underwent dynamic OE-MRI on a 1.5 T Philips Achieva MRI scanner. The following free-breathing protocol based on an inversion-prepared centric ordered single shot 3D-turbo field echo sequence was used: TR/TE = 2.1/0.5 ms, Flip Angle = 6°, matrix = 128 x 128 x 15 acquired in a single readout, FOV= 450 x 450 x 225 mm3, temporal resolution = 10s/volume [3]. The dynamic acquisition, with TI = 1100 ms, lasted approximately 15 min (90 volumes) [3], during which gas was delivered at 15 l/min via a disposable non-rebreathing mask (Intersurgical EcoliteTM, Intersurgical ) and switched at minute 2 from medical air (21% O2) to 100% O2, and back to air at minute 10. All images were registered to correct for breathing motion using a non-linear registration algorithm [4]. Four approaches to estimated VVF from the dynamic dataset were compared. Pixels were considered as enhancing if
- Signal threshold (Enh10%): signal enhancement > 10%, where the signal enhancement is the difference between last 10 dynamics on 100% O2 and the first 10 dynamics on air, normalized by the latter;
- T-test: the p-value calculated with a t-test between the last 10 dynamics on 100% O2 and the first 10 dynamics on air is < 0.05;
- Exponential fit (Exp fit): a mono-exponential recovery function was fitted to the signal using a Levenberg-Marquadt algorithm (curve_fit function in the python SciPy library), and the coefficient of determination R2 is higher than 0.1;
- Akaike information criterion (AIC): the AIC favours an exponential fit over a constant function having the median value from the time series.
All subjects also underwent conventional spirometry (ZAN500 Spire), and FEV1, FVC and FEV1/FVC results were corrected for age, height and gender. CF patients additionally underwent HRCT and images were evaluated by an independent reader using the “Brody score”, a radiological score reflecting structural abnormalities on CT [5]. Relationships between variables were evaluated with Pearson correlation. P < 0.05 is considered to indicate the presence of a statistically significant correlation. No corrections were made for multiple comparisons.
Results
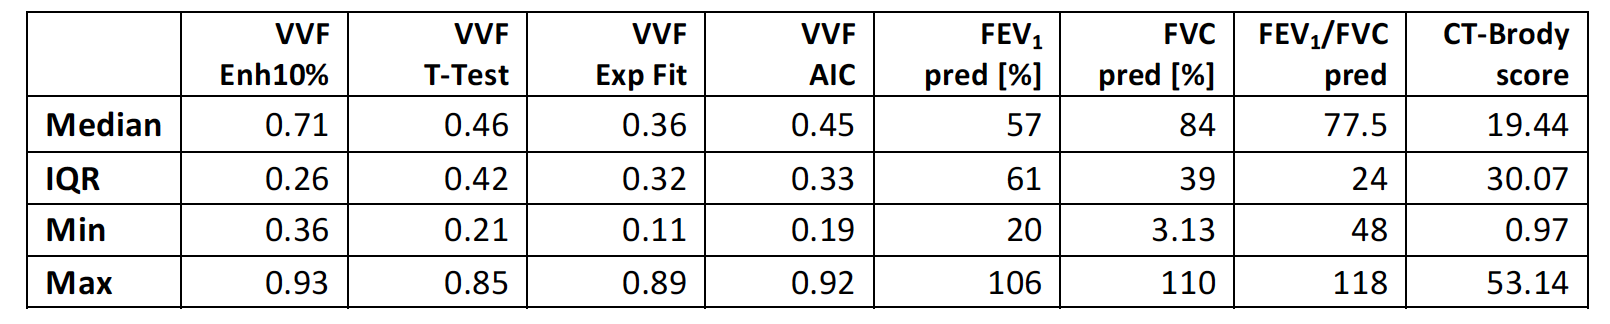
Table 1 presents the descriptive statistics of the considered parameters. The population of CF adult patients and healthy volunteers presents a wide range of FEV1% predicted, from 20% (severe disease) to >100% (mild/no disease). Examples of the VVF masks generated using each method in a patient with FEV1% predicted ~20% and in a patient with FEV1% predicted ~100% are given in figure 1 and 2 respectively. Table 2 presents the Pearson correlation coefficient R2 obtained between all considered VVF algorithms, the spirometry results and the Brody score. Figure 3 presents the scatter plots of the relationships between each VVF method, the spirometry parameters and the Brody score.Discussion
All dynamic OE-MRI VVF algorithms considered correlate significantly with measurements of lung function derived from spirometry. The VVF Enh10% and Exp fit algorithms correlate less strongly with the Brody score, which is an assessment of the pulmonary abnormalities seen in HD-CT and therefore does not directly measure lung function. Overall, our results suggest that VVF calculated from dynamic OE-MRI is relatively insensitive to the choice of method. Among the algorithms considered, the AIC offers the clear advantage of not requiring the setting of thresholds to identify enhancing pixels.Conclusion
Dynamic OE-MRI presents several options for the definition of ventilated volume fraction. We have compared four methods and demonstrated that each is sensitive to variation in lung function, with variable sensitivity to structural information derived from CT. Our analysis suggests that the AIC method may provide the most robust and objective method for quantifying VVF, although this needs to be confirmed in larger prospective studies and in other patient groups.Acknowledgements
This research was funded by Innovative Medicines Initiatives 2 Joint Undertaking under grant agreement No. 116106. This Joint Undertaking receives support from the European Union’s Horizon 2020 research and innovation programme and EFPIA. This study also received funding by LUNGE ZÜRICH. We thank David Higgins of Philips Healthcare for assistance in protocol development and for access to research protocols.References
1. Woodhouse, N., Wild, J. M., van Beek, E. J., Hoggard, N., Barker, N., & Taylor, C. J.. Assessment of hyperpolarized 3He lung MRI for regional evaluation of interventional therapy: a pilot study in pediatric cystic fibrosis. JMRI. 2009; 30(5), 981-988.
2. Martini, K., C. M. Gygax, C. Benden, A. R. Morgan, G. J. M. Parker, and T. Frauenfelder. "Volumetric dynamic oxygen-enhanced MRI (OE-MRI): comparison with CT Brody score and lung function in cystic fibrosis patients." European radiology. 2018: 1-11.
3. Ulloa, J. L., Morgan, A. R., & Parker, G. J. . Evaluation of a novel whole lung 3D dynamic OE-MRI protocol in healthy subjects. In ISMRM 23; 2015(p. 3973). Toronto.
4. Avants, B.B., Tustison, N.J., Song, G., Cook, P.A., Klein, A. and Gee, J.C.. A reproducible evaluation of ANTs similarity metric performance in brain image registration. Neuroimage. 2011; 54(3), pp.2033-2044.
5. Brody, A.S., Kosorok, M.R., Li, Z., Broderick, L.S., Foster, J.L., Laxova, A., Bandla, H. and Farrell, P.M. Reproducibility of a scoring system for computed tomography scanning in cystic fibrosis. Journal of thoracic imaging.2006;21(1), pp.14-21.
Figures