1867
Preoperative Supine Breast MRI for Surgical Planning: Comparison of Dynamic Contrast Enhancement Curves to Prone Diagnostic MRIs1Bioengineering, Stanford University, Stanford, CA, United States, 2Radiology, Stanford University, Stanford, CA, United States, 3Electrical Engineering, Stanford University, Stanford, CA, United States
Synopsis
Dynamic contrast-enhanced breast imaging is typically performed in the prone position, but supine breast MRI is desirable for patient comfort and better correspondence to the surgical position. We have developed a breath-held multiphase supine bilateral DCE breast imaging protocol with Dixon fat-water separation. In this work, we compare the DCE curves to those from the prone diagnostic MRIs in 6 tumors. The shape of the curves is generally preserved, demonstrating that our supine scans are limited primarily by resolution, as opposed to SNR or motion.
Introduction
Analysis of contrast enhancement over time in dynamic contrast-enhanced (DCE) breast MRI gives insight into the malignancy of a tumor1,2. Breast MRI is typically performed prone, but this can be uncomfortable for the patient. Supine imaging would be more comfortable, and additionally more closely matches the surgical position for lumpectomy or mastectomy. Supine DCE imaging has been investigated previously3-7, but to our knowledge DCE curves from the same patient in both positions have not been compared.
The availability of surface coils with many channels allows for significant acceleration with parallel imaging, enabling breath-held scans. Dixon fat-water separation provides fat compensation that is robust to B0 and B1 variations, and generates fat images that can be used for reliable registration across temporal phases to account for bulk and deformable motion8.
We have developed a breath-held multiphase supine bilateral breast imaging protocol with two-point Dixon, which has been used to acquire preoperative images to display directly on a patient using mixed reality9,10. In this work, we analyze the DCE curves from these images and compare them to the patients’ prone diagnostic MRIs.
Methods
We report results from 8 tumors across 7 patients scanned with our supine protocol, and compare to results from 6 of the tumors in the previously acquired prone diagnostic MRIs available for 5 of these patients.
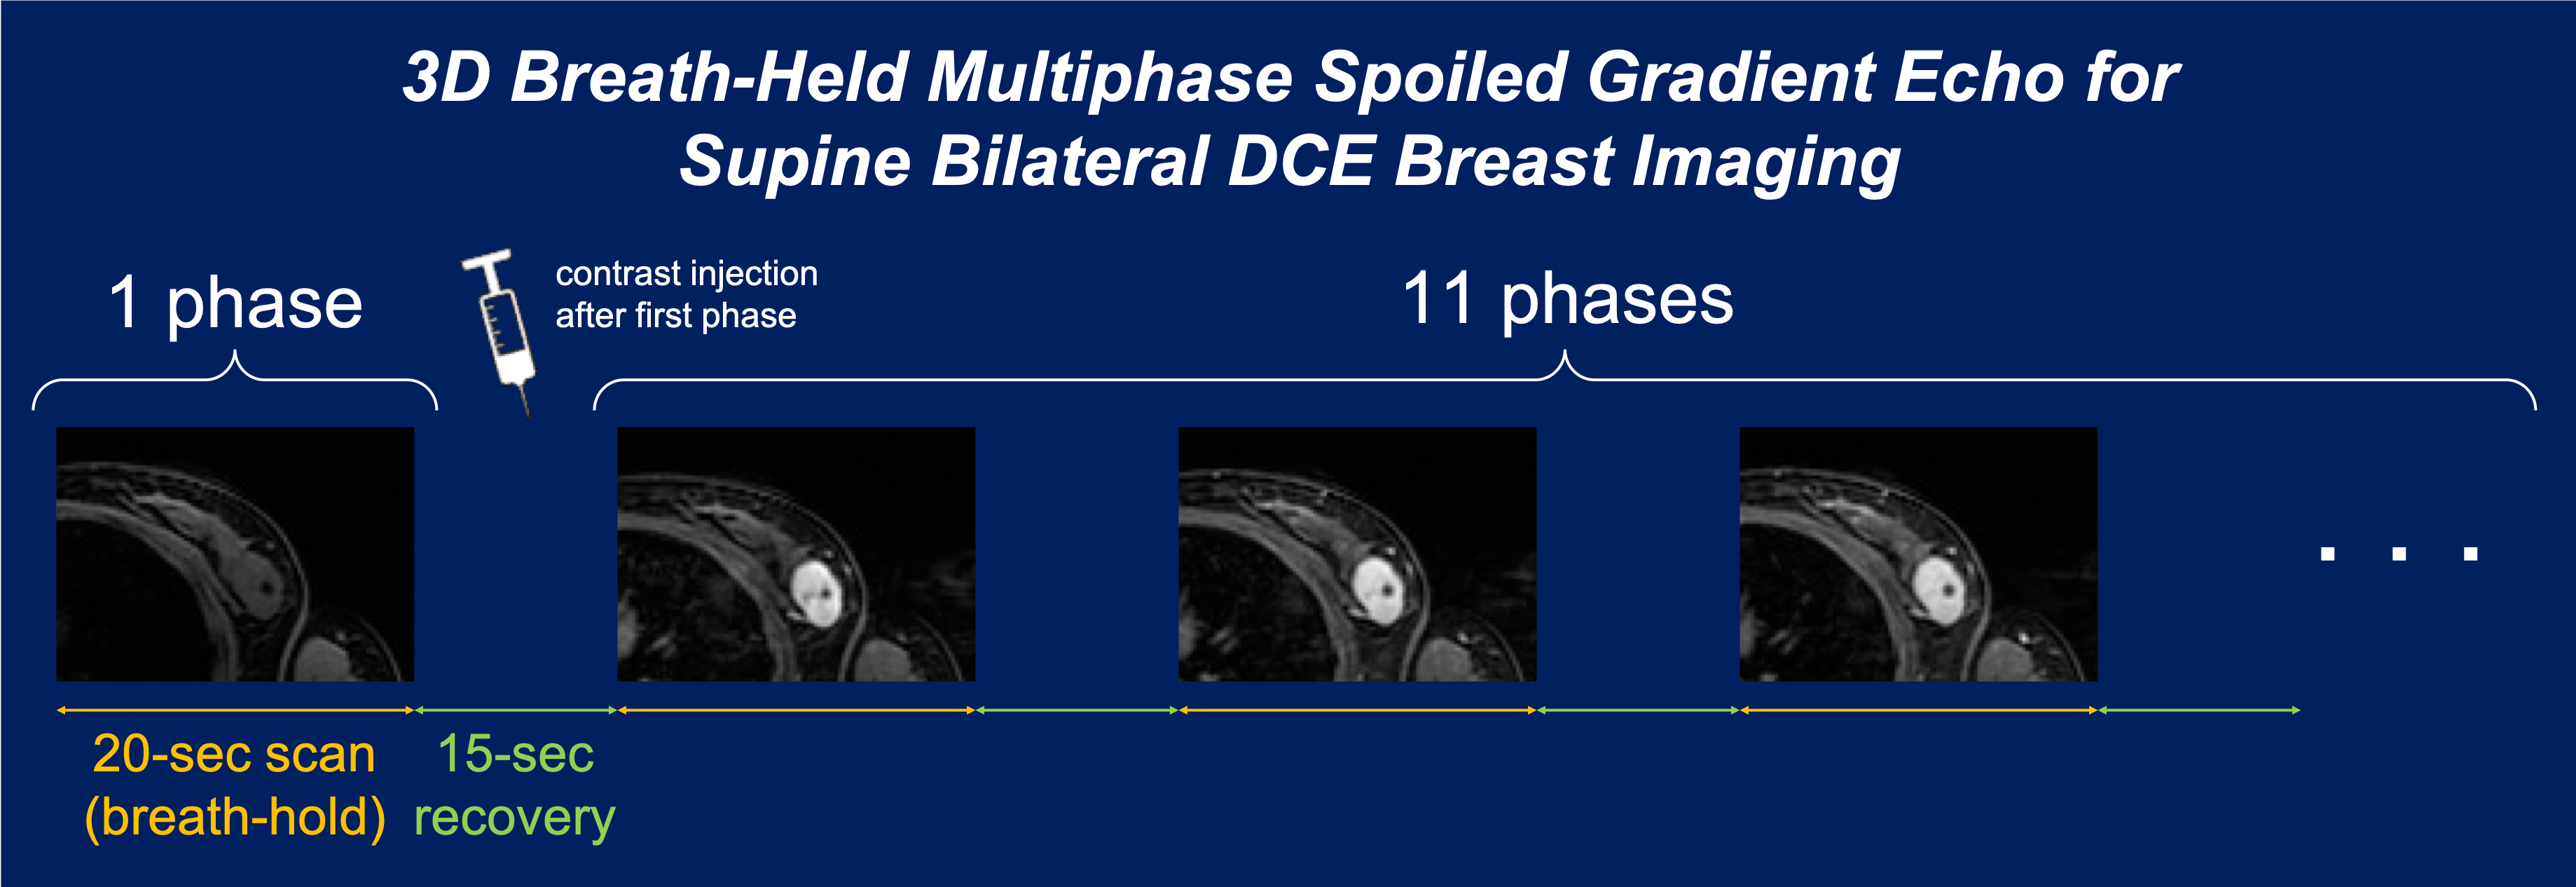
Patients were scanned with IRB approval on either a 3T GE MR750 (8-channel cardiac coil) or 3T GE SIGNA Premier (16-channel torso phased array coil) system; a rigid, passive cover was placed over the patient to prevent deformation of the breast by the coil. Supine axial bilateral 3D spoiled gradient-echo images with two-point Dixon were acquired at 12 temporal phases (20-second breath-hold each) separated by 15-second recovery intervals (Figure 1), with: 1.6 x 1.6 mm2 in-plane resolution, 4.0 mm slice thickness (interpolated to 2.0 mm), TR = 3.9 ms, 12° flip angle, acceleration = 3 in the phase encode (L/R) direction. Gadobutrol (0.1 mmol/kg) was injected intravenously immediately after the first phase. In one patient, only 7 phases were acquired (Tumor 3). To account for bulk and deformable motion, the temporal phases were registered by applying an affine transformation and then a B-spline transformation, using the fat images acquired ~3 min after contrast injection (Phase 7) as the fixed template8.
The prone diagnostic MRIs for each patient were acquired at various sites with varying imaging parameters (Figure 2). The injection time was estimated to be immediately before the first post-contrast phase. The phases were registered similarly to the supine images, using the fat images when available and the fat-suppressed images otherwise.
For both datasets, the mean signal intensity (SI) was calculated in a 2D ROI of the tumor. Percent enhancement2,11 was calculated as $$$((SI_{post}–SI_{pre})/SI_{pre})*100$$$, where SIpre corresponds to the pre-contrast phase, and SIpost the peak post-contrast phase of the rapid wash-in. The signal enhancement ratio (SER)12 was calculated as $$$(SI_{early}–SI_{pre})/(SI_{late}–SI_{pre})$$$, where SIearly corresponds to the phase closest to 140 s, and SIlate closest to 400 s. To visualize DCE curves, SIpre was subtracted from the SI for each phase, and each value was scaled by SIpost and plotted as a function of acquisition time.
Results and Discussion
Example supine images with arrows indicating the tumors are shown in Figure 3. Although some phases contained motion artifacts, the acquisition of multiple phases increases the likelihood that at least one will be clean enough for tumor segmentation.
Because contrast enhancement depends on additional factors such as field strength, T1-weighting, and type of contrast agent11,13, the prone and supine DCE curves cannot be compared directly. However, the general shapes correspond well (Figure 4), indicating our scans are not SNR-limited, and the average SER difference is -0.02 (Figure 5). Noise in the supine curves and discrepancies in SER may be due to blurring and motion artifacts in some of the phases, which could affect the SI in the tumor ROI. Curves from the unregistered supine images are also plotted for reference; several are much noisier because the tumor was not always in the ROI due to bulk motion, indicating the importance of registration across temporal phases.
Conclusion
We have developed a supine bilateral breast protocol with Dixon fat-water separation for DCE imaging. The images have sufficient SNR and temporal resolution to capture enhancement behavior, and comparison of the prone and supine DCE curves reveals that shape is generally preserved. Future work will focus on improving the spatial resolution by investigating the use of light, flexible coil arrays with many channels, and exploring continuous breathing approaches with motion compensation to reduce image artifacts.Acknowledgements
IDEA Award 22IB-0006, GE Healthcare, NIH P41 EB015891, NIH R01 EB009055, Stanford Bio-XReferences
- Kuhl CK, Mielcareck P, Klaschik S et al. “Dynamic breast MR imaging: Are signal intensity time course data useful for differential diagnosis of enhancing lesions?” Radiology 1999; 211(1):101-110.
- El Khouli RH, Macura KJ, Jacobs MA et al. “Dynamic contrast-enhanced MRI of the breast: Quantitative method for kinetic curve type assessment.” AJR Am J Roentgenol 2009; 193(4):W295-300.
- Flickinger FW, Allison JD, Sherry RM, Wright JC. “Differentiation of benign from malignant breast masses by time-intensity evaluation of contrast enhanced MRI.” Magn Reson Imaging 1993; 11(5):617-620.
- Shimada M, Senoo A, Hayashi S et al. “Assessment of breast cancer with dynamic gadolinium-enhanced MR imaging combined with magnetization transfer contrast using a newly developed breast surface coil for the supine position.” Radiat Med 1997; 15(2):85-90.
- Tozaki M, Fukuda K. “Supine MR mammography using VIBE with parallel acquisition technique for the planning of breast-conserving surgery: Clinical feasibility.” Breast 2006; 15(1):137-140.
- Siegler P, Holloway CMB, Causer P et al. “Supine breast MRI.” J Magn Reson Imaging 2011; 34(5):1212-1217.
- Janssen NNY, Ter Beek LC, Loo CE et al. “Supine breast MRI using respiratory triggering.” Acad Radiol 2017; 24(7):818-825.
- Srinivasan S, Hargreaves BA, Daniel BL. “Fat-based registration of breast dynamic contrast enhanced water images.” Magn Reson Med 2018; 79(4):2408-2414.
- Perkins SL, Lin MA, Srinivasan S et al. “A mixed-reality system for breast surgical planning.” 2017 IEEE International Symposium on Mixed and Augmented Reality (ISMAR-Adjunct), Nantes, 2017, pp. 269-274.
- Perkins SL, Lin MA, Srinivasan S et al. “Perceptual accuracy of a mixed-reality system for MR-guided breast surgical planning in the operating room.” ISMRM 2018 #0607.
- Moon M, Cornfeld D, Weinreb J. “Dynamic contrast-enhanced breast MR imaging.” Magn Reson Imaging Clin N Am 2009; 17(2):351-362.
- Hylton N. “Dynamic contrast-enhanced magnetic resonance imaging as an imaging biomarker.” J Clin Oncol 2006; 24(20):3293-3298.
- Kuhl C. “The current status of breast MR imaging: Part I. Choice of technique, image interpretation, diagnostic accuracy, and transfer to clinical practice.” Radiology 2007; 244(2):356-378.
Figures