1863
Apparent Exchange Rate Mapping with Diffusion MRI: A Novel Marker For In Vivo Breast Cancer Characterization1Radiology, University of Washington, Seattle, WA, United States, 2Pathology, University of Washington, Seattle, WA, United States, 3Lund University, Lund, Sweden, 4Random Walk Imaging, Lund, Sweden
Synopsis
Filter exchange MR imaging (FEXI) offers potential to measure the diffusional exchange rate of water between intra- and extra-cellular spaces, which may provide unique insights to alterations in cell physiology. We investigated the feasibility of implementing FEXI for in vivo measurement of breast tumor apparent exchange rates (AXR) and association with pathologic factors. Our findings showed reduced AXR in breast tumors and suggested association with aquaporin five (AQP5) concentration, previously shown to correlate with tumor aggressiveness and metastatic risk. Further investigation is warranted to evaluate FEXI as a new prognostic marker and early marker of response to therapy.
Introduction
Diffusional exchange of water between tissue micro-environments with different apparent diffusivities, e.g. intra- and extra-cellular space, can be quantified by filter exchange MR imaging (FEXI).1,3 In cell suspensions, the apparent exchange rate (AXR) measured by FEXI is closely related to cell membrane permeability1,2,4, which is determined in part by the amount of aquaporins (AQPs) in cell membranes. In breast tumors, elevated aquaporin five (AQP5) concentration has been shown to correlate with tumor aggressiveness and metastasis.5,6 AXR may therefore provide unique physiologic assessment and constitute a valuable new biomarker for breast lesion characterization. Thus, the purpose of this study was to apply FEXI to measure AXR of human breast tumors in vivo and evaluate associations of AXR with tumor AQP5 expression and other prognostic pathological markers.Methods
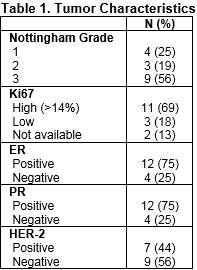
Subjects: After IRB approval, patients with newly diagnosed invasive breast cancer were consented prior to preoperative breast MRI to undergo an additional research FEXI sequence during their MR exams. Pathology: Routine clinical evaluation of diagnostic core biopsies included histologic type, Nottingham grade, ER, PR, and HER2 expression, and Ki-67. Aquaporin 5 (AQP5) expression was also qualitatively assessed by a pathologist and categorized as low, intermediate, or high from formalin-fixed biopsy and/or surgical samples using a previously described immunohistochemistry technique.7
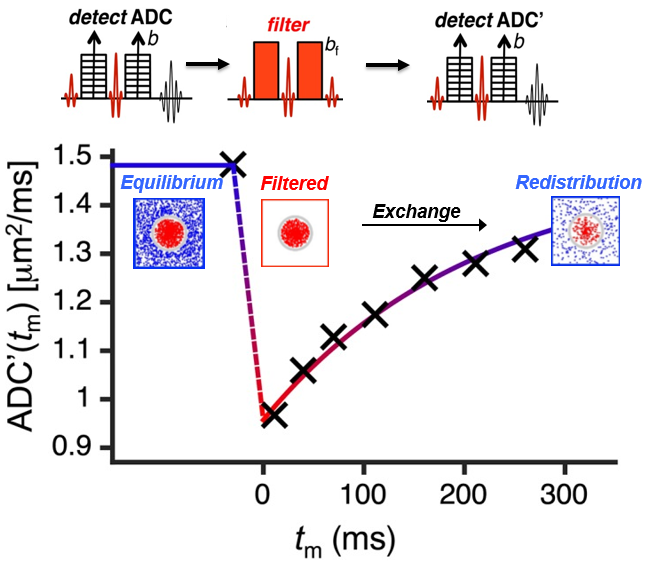
Image Acquisition: Imaging was performed on a 3 Tesla Philips Achieva TX scanner with a 16-channel breast MRI coil. Multiparametric breast MR examinations included (in order): T2-weighted, diffusion-weighted imaging (DWI), dynamic contrast-enhanced MRI, and FEXI sequences. FEXI was acquired using a double pulsed gradient spin echo (PGSE) sequence, as previously reported1, where the first PGSE block acts as a diffusion filter (‘filter block’), providing diffusion weighting bf, and the second block is used to detect the apparent diffusivity (‘detection block’) with variable diffusion weighting b. FEXI imaging parameters were: gradient pulse duration δ=9.7ms; interval between gradient pulses Δ=23ms; mixing time (tm)=12ms (×2 repetitions), 100ms (x1 rep), 250ms (×2 reps); bf=300s/mm2; b=40s/mm2 (×3 reps), 500s/mm2 (×7 reps). Diffusion encoding was applied along three orthogonal directions and seven 5mm-thick slices with 3×3 mm2 spatial resolution were acquired using echo planar imaging (EPI) with SPIR fat suppression, TR=3s, TE=52ms, and a total scan time of 7:36 min.
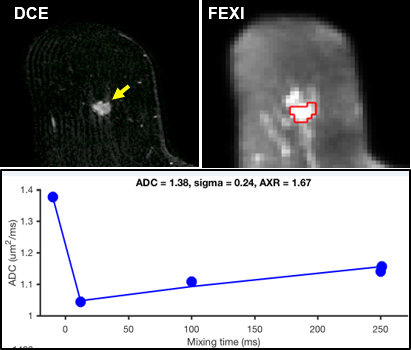
Image Analysis: Tumors were identified on conventional MR images, and regions of interest (ROIs) were drawn in corresponding locations on FEXI images. AXR (units s-1) was calculated as previously described1, by globally fitting Eqs. 1-3 to the experimental non-filtered and filtered tumor signal values, using:
- S(b) = S0 exp(-b·ADC) Eq. 1 (non-filtered)
- S(b,tm) = Sf(tm)exp(-b·ADC’(tm)) Eq. 2(filtered)
- ADC’(tm) = ADC(1-σexp(-tm·AXR)) Eq. 3 (filtered)
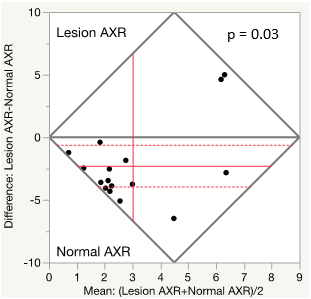
where S(b,tm) is the signal, ADC’(tm) is the filtered ADC, and Sf(tm) is the relaxation-weighted and filtered signal intensity, σ=1–ADC’(0)/ADC is the filter efficiency (Fig 1). Intrasubject tumor and normal breast AXR values were compared by Wilcoxon signed rank test. Exploratory analyses of AXR associations with patient and pathologic characteristics were performed by Wilcoxon rank-sum test and Spearman’s correlation. P<0.05 was considered significant.
Results
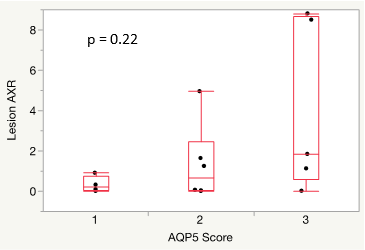
The study included 16 patients with invasive breast cancer (14 IDC, 2 ILC), aged 30 to 88 (median, 52) years. Tumor characteristics are given in Table 1. Tumor AXR values ranged from 0 to 8.8 (median, 0.7) s-1, example shown in Figure 2, which were significantly lower than intrasubject normal tissue (range, 1.3 to 7.8, median, 3.9 s-1; p=0.03, Fig 3). AQP5 expression was low in 4 tumors, intermediate in 6, and high in 5, and one tumor did not have sufficient tissue available for assessment. AXR demonstrated a positive trend with increasing AQP5 concentration (Fig 4), although this was not statistically significant. Exploratory analyses did not identify any significant associations of AXR with other pathologic or patient characteristics (p>0.05 for all comparisons). Of note, tumor AXR and ADC measures were not significantly correlated (rho=-0.3, p=0.24).Discussion
Our preliminary findings suggest FEXI may provide a feasible method to non-invasively measure cellular water exchange rates of breast tumors in vivo. Lower AXR measures in tumor vs. normal breast tissue in 13/16 cases were unexpected and contradictory to our original hypothesis of elevated AXR with malignancy as observed in other disease types, which may relate to unique biology of normal breast parenchyma. If validated in further studies, the suggested association of tumor AXR with AQP5 expression indicates that AXR could serve as a novel marker of cellular physiology that may relate to lesion aggressiveness and metastatic potential.Acknowledgements
Supported by NIH/NCI research grants R01CA151326, R01CA207290, and Fred Hutchinson Cancer Center Support Grant (P30 CA015704-43) Pilot Award.References
1. Lasič, S., Oredsson, S., Partridge, S. C., Saal, L. H., Topgaard, D., Nilsson, M., & Bryskhe, K. Apparent exchange rate for breast cancer characterization. NMR in biomedicine, 2016;29 (5), 631-9.
2. Lasič, S., Nilsson, M., Lätt, J., Ståhlberg, F. and Topgaard, D. Apparent exchange rate mapping with diffusion MRI. Magn. Reson. Med. 2011;66: 356-365.
3. Nilsson, M., Lätt, J., van Westen, D., Brockstedt, S., Lasič, S., Ståhlberg, F. and Topgaard, D. Noninvasive mapping of water diffusional exchange in the human brain using filter‐exchange imaging. Magn. Reson. Med. 2013;69: 1572-1580.
4. Aslund I, Nowacka A, Nilsson M, Topgaard D. Filter-exchange PGSE NMR determination of cell membrane permeability. Journal of Magnetic Resonance. 2009;200(2): 291-295.
5. Jung HJ, Park J-Y, Jeon H-S, Kwon T-H. Aquaporin-5: A Marker Protein for Proliferation and Migration of Human Breast Cancer Cells. PLoS ONE. 2011;6(12)e28492
6. Lee SJ, Chae YS, Kim JG, Kim WW, Jung JH, Park HY, Jeong JY, Park JY, Jung HJ, Kwon TH. AQP5 expression predicts survival in patients with early breast cancer. Ann. Surg. Oncol. 2014 Feb;21(2):375-83
7. Shi Z, Zhang T, Luo L, Zhao H, Cheng J, Xiang J, Zhao C. Aquaporins in human breast cancer: identification and involvement in carcinogenesis of breast cancer. J. Surg. Oncol. 2012 Sep;106(3):267-72.
Figures