1862
Bias Correction for Improved Segmentation and Background Parenchymal Enhancement Calculation in Multi-Center Breast MRI Trials1Department of Radiology and Biomedical Imaging, University of California San Francisco, San Francisco, CA, United States, 2Department of Oncology and Pathology, Karolinska Institutet, Stockholm, Sweden
Synopsis
The presence of bias field inhomogeneity can negatively impact segmentation of breast fibroglandular tissue on MRI and subsequent quantification of background parenchymal enhancement. This can be particularly problematic in multi-center trials utilizing multiple imaging platforms. We have implemented the N4ITK algorithm for bias correction and evaluated the agreement between semi-automatic and semi-manual segmentation methods. Our results show that bias correction produces tissue segmentations and BPE estimates with better agreement with a reference manual segmentation method than non-corrected images.
Introduction
Dynamic contrast enhanced MR imaging (DCE-MRI) provides qualitative and quantitative measurements reflecting the kinetics of tissue enhancement, which can be used to assess breast cancer risk.1 In particular, background parenchymal enhancement (BPE) observed in breast fibroglandular tissue (FGT) has been shown to be associated with breast cancer risk and can be used as an imaging biomarker.2,3 However, accurate segmentation of breast FGT is a challenge when bias field inhomogeneity is present, especially in multi-center studies utilizing a variety of imaging platforms. For this retrospective study we compared a semi-automatic segmentation method with and without bias correction (BC) to a semi-manual segmentation method performed by a radiologist that we set as a reference standard. We analyzed the accuracy and improvement of the implemented bias correction method within a neoadjuvant treatment cohort in order to validate and provide a more accurate response evaluation.Methods
Studies were drawn from a cohort of 237 women undergoing MRI during neoadjuvant chemotherapy (NAC) treatment in a multi-center trial. All subjects gave written informed consent prior to enrollment. Subjects were scanned at 21 different centers on scanners from 3 manufacturers, at 1.5T and 3T field strengths. 237 DCE-MRI studies conducted before NAC (pre-treatment) and 213 studies done after 12 weeks of taxane-based treatment (inter-regimen) were analyzed. We applied an in-house algorithm for semi-automatic segmentation of the breast tissue using fuzzy c-means (FCM) clustering to identify FGT.4 For semi-manual segmentation, a radiologist with two years of experience in breast MRI manually placed a mask around the parenchymal tissue and applied FCM clustering with fine tuning to get the most optimal segmentation. All FGT segmentations were performed on a single axial slice located at the nipple position of the contralateral breast. For bias correction, we applied the N4ITK algorithm to correct for the field inhomogeneity observed in the MR images.5 We calculated BPE as (S1-S0)/S0, where S0 is the pre-contrast signal intensity and S1 is the early post-contrast signal intensity at 2.5 minutes after contrast injection. For analysis, mean BPE was calculated to assess the agreement of segmentation between the semi-automatic and semi-manual methods. Pearson’s linear correlation coefficient was calculated to compare the improvement gain of bias correction for BPE quantification. The Sørensen-Dice similarity coefficient (DICE index) was calculated to compare the accuracy of segmentation methods with regards to our reference standard.Results
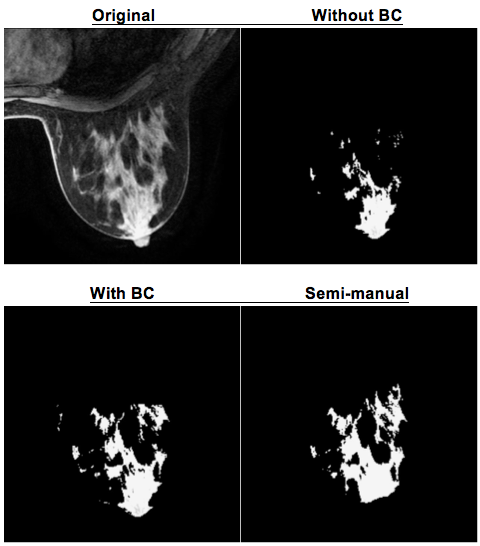
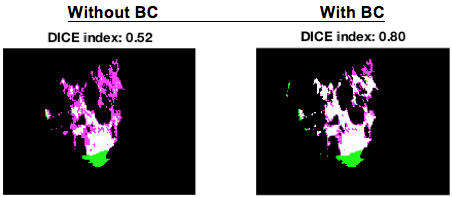
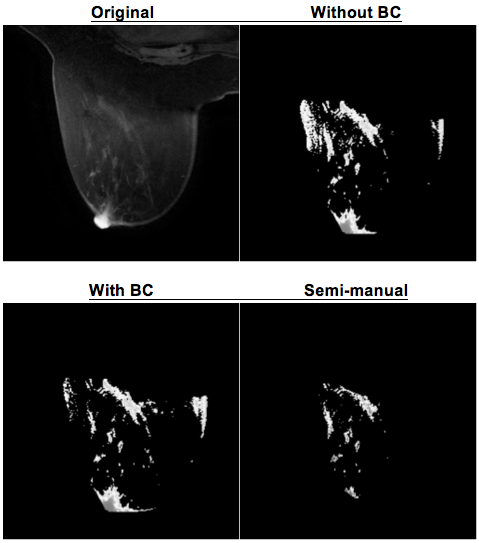
There was a 50% bias correction success rate at both pre-treatment and inter-regimen (119/237 cases and 107/213 cases, respectively) where half of all cases benefitted from bias correction. For the cases where bias correction succeeded, the Pearson’s linear correlation coefficient, r, improved by 0.02 at pre-treatment and 0.04 at inter-regimen for mean BPE, p<0.001. With bias correction, half of the semi-automatic cases showed a higher agreement with the results from semi-manual method. Figure 1 shows a visual example where bias correction improved the semi-automatic segmentation method. The original image shows a bias field near the nipple and after bias correction, the semi-automatic segmentation included more FGT further away from the nipple. Figure 2 shows a visual comparison between the DICE index without and with bias correction. In this case, an improvement of 0.28 is observed when bias correction is implemented. Figure 3 shows a visual example where bias correction failed also resulting in a miscalculated mean BPE.Discussion
Use of bias correction before quantitative image analysis can effectively improve BPE quantification and reduce the overall variance of mean BPE. FCM clustering is not robust enough to account for bias field inhomogeneity and this was observed in many of the cases from our dataset. There are a number of parameters that can be optimized for breast MRI since the implemented bias correction algorithm was originally developed for correcting brain images. On the other hand, for the cases where bias correction aided in providing more accurate segmentation and therefore more accurate BPE measurements, this preprocessing step allows measured BPE to be a better biomarker for assessing breast cancer risk.Conclusion
Manual segmentation by a radiologist is very time consuming and subject to intra- and inter-operator variability, whereas precise automatic segmentation allows for accurate quantitative BPE calculations as well as improving the radiologist's work flow. Future research will include optimizing the bias correction algorithm for accommodating a wider array of varying breast MRIs and exploring machine learning techniques for more robust segmentation accuracy as well as further reducing time for processing large datasets.Acknowledgements
This work was supported in part by NIH R01 CA132870 and NIH U01 CA225427.References
1. Dontchos BN, Rahbar H, Partridge SC, Korde LA, Lam DL, Scheel JR, Peacock S, and Lehman CD. Are Qualitative Assessments of Background Parenchymal Enhancement, Amount of Fibroglandular Tissue on MR Images, and Mammographic Density Associated with Breast Cancer Risk? Radiology. 2015; 276(2), 371-380.
2. King V, Brooks JD, Bernstein JL, Reiner AS, Pike MC, Morris EA. Background Parenchymal Enhancement at Breast MR Imaging and Breast Cancer Risk. Radiology. 2011; 260(1), 50-60.
3. Chen JH, Yu HJ, Hsu C, Mehta RS, Carpenter PM, Su MY. Background Parenchymal Enhancement of the Contralateral Normal Breast: Association with Tumor Response in Breast Cancer Patients Receiving Neoadjuvant Chemotherapy. Translational oncology 2015; 8:204-9.
4. Klifa C, Carballido-Gamio J, Wilmes L, Laprie A, Lobo C, Demicco E, Watkins M, Shepherd J, Gibbs J, Hylton N. Quantification of breast tissue index from MR data using fuzzy clustering. Conf Proc IEEE Eng Med Biol Soc. 2004; 3:1667-70.
5. Tustison NJ, Avants BB, Cook PA, Zheng Y, Egan A, Yushkevich PA, Gee JC. N4ITK: Improved N3 Bias Correction. IEEE Trans Med Imaging. 2010; 29(6):1310–1320
Figures