1860
Changes in breast tumor blood flow measured by dynamic contrast-enhanced MRI after one cycle of neoadjuvant chemotherapy1University of Leeds, Leeds, United Kingdom, 2Leeds Teaching Hospitals NHS Trust, Leeds, United Kingdom
Synopsis
Early assessment of response to neoadjuvant chemotherapy (NACT) in breast cancer is important and it has been suggested that functional changes, such as tumor blood flow (TBF), may precede size changes. We measured TBF using dynamic contrast-enhanced MRI in 40 patients before and after one cycle of NACT and compared these measures to pathological response. There was no correlation between change in TBF and pathological response in the full sample. However, several tumors shrank after one cycle of NACT; if these were removed then change in TBF in tumors that didn’t shrink correlated well with pathological response
Introduction
Neoadjuvant chemotherapy (NACT) is an option for patients with advanced breast cancer, but a significant proportion of patients do not benefit from it [1]. Assessment of treatment response is typically limited to clinical examinations that monitor changes in tumor diameter [2]. It is, however, recognized that changes in tumor physiology, such as tumor blood flow (TBF), may precede morphological changes [3]. We have previously presented an interleaved sampling strategy that allows the acquisition of data suitable for estimation of TBF while retaining high spatial resolution (HSR) data for clinical assessment [4]. Here we report the results of applying that strategy to test the hypothesis that change in TBF following one cycle of NACT can be used to identify patients who go on to achieve a complete pathological response.Methods
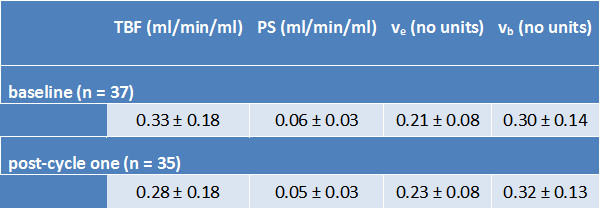
Forty female patients (median age 45 years, range 25 to 69) diagnosed with primary breast cancer and due to undergo NACT were scanned on a 1.5 T MR system (Aera; Siemens) pre-treatment and following one cycle of NACT (EC90; epirubicin (90 mg/m2) and cyclophosphamide (600 mg/m2)). The MRI protocol included bookend IR-TurboFLASH sequences for T1 quantification [5] and interleaved high temporal resolution (HTR) and HSR dynamic contrast-enhanced (DCE) sequences for tracer kinetic analysis and clinical reporting, respectively [4]. A flexible matrix coil placed on the patients’ backs was used to enhance signal from the descending aorta to provide an arterial input function (AIF) for the DCE analysis [6]. A dose of 0.1 mmol/kg Gd-DOTA was administered at 3 ml/s followed by 20 ml saline. Tumor and AIF region of interests were manually drawn for subsequent analysis. T1 relaxation times for tumor and AIF were estimated before and after contrast administration and, following an iterative approach, a bookend correction was applied to the DCE-MRI data to convert signal to contrast agent concentration as described by Cron et al [5]. The data were fitted with a two-compartment exchange model (2CXM) to provide estimates of TBF, capillary permeability-surface area product (PS), extracellular-extravascular space fraction (ve) and blood volume (vb) [7].
Each of the patients went on to receive a further 2 cycles of EC90, followed by a 3rd MRI, and then 3 or 4 cycles of docetaxel (with trastuzumab in HER2+ patients), followed by a 4th MRI, before undergoing surgery. The surgical specimens were assessed by a pathologist and a residual cancer burden (RCB) index was calculated [8].
Results
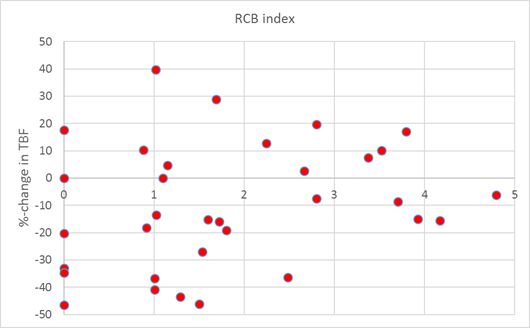
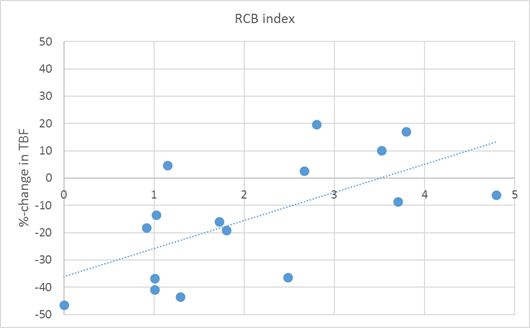
Baseline MRI data was successfully acquired in 37 patients (1 patient was unable to tolerate the MRI and there were technical problems in 2 others). Post-cycle one data were acquired in 35 patients (3 withdrew from the study and technical problems affected 2 patients). TBF and related parameters measured at baseline and after one cycle are reported in Table 1. Following surgery RCB data were available in 38 patients: 6 had a complete pathological response (RCB class 0), 10 had minimal (RCB-I), 13 moderate (RCB-II) and 9 extensive residual disease (RCB-III). The correlation between change in TBF after one cycle and RCB index across all patients was poor (Figure 1). However, if changes in tumor volume were also considered and those patients whose tumor volume decreased by > 20% after one cycle of NACT were excluded, the correlation became much stronger (r = 0.69, p = 0.003; Figure 2).Discussion
Only two groups have previously reported on breast TBF by DCE-MRI and they both employed single-slice techniques that were not compatible with clinical guidelines [9,10]. Our interleaved strategy has the advantage of providing estimates of TBF from 3D data while retaining the information available from standard HSR clinical DCE-MRI [4]. Moreover, our estimates of TBF at baseline very closely match those measured using 15-O labelled water [11] and similarly show little variation in TBF as a function of tumor immunohistochemical subtype (triple negative, HER2+ & luminal). While change in TBF alone could not predict pathological response, the combination of change in tumor volume and TBF shows great promise in the early (post-one cycle) prediction of tumor response to NACT.Acknowledgements
The study was funded by Breast Cancer Now (award 2014MayPR241).References
- Makris A, Powles TJ, Ashley SE, Chang J, Hickish T, Tidy VA, Nash AG, Ford HT. A reduction in the requirements for mastectomy in a randomized trial of neoadjuvant chemoendocrine therapy in primary breast cancer. Annals of Oncology 1998;9(11):1179-1184.
- Eisenhauer EA, Therasse P, Bogaerts J, Schwartz LH, Sargent D, Ford R, Dancey J, Arbuck S, Gwyther S, Mooney M, Rubinstein L, Shankar L, Dodd L, Kaplan R, Lacombe D, Verweij J. New response evaluation criteria in solid tumours: Revised RECIST guideline (version 1.1). Eur J Cancer 2009;45(2):228-247.
- Wasser K, Klein SK, Fink C, Junkermann H, Sinn HP, Zuna I, Knopp MV, Delorme S. Evaluation of neoadjuvant chemotherapeutic response of breast cancer using dynamic MRI with high temporal resolution. Eur Radiol 2003;13(1):80-87.
- Georgiou L, Sharma N, Broadbent DA, Wilson DJ, Dall BJ, Gangi A, Buckley DL. Estimating breast tumor blood flow during neoadjuvant chemotherapy using interleaved high temporal and high spatial resolution MRI. Magn Reson Med 2018;79(1):317-326.
- Cron GO, Santyr G, Kelcz F. Accurate and rapid quantitative dynamic contrast-enhanced breast MR imaging using spoiled gradient-recalled echoes and bookend T-1 measurements. Magn Reson Med 1999;42(4):746-753.
- Georgiou L, Wilson DJ, Sharma N, Perren TJ, Buckley DL. A functional form for a representative individual arterial input function measured from a population using high temporal resolution DCE MRI. Magn Reson Med 2018; doi.org/10.1002/mrm.27524.
- Sourbron SP, Buckley DL. Tracer kinetic modelling in MRI: estimating perfusion and capillary permeability. Phys Med Biol 2012;57(2):R1-R33.
- Symmans WF, Peintinger F, Hatzis C, Rajan R, Kuerer H, Valero V, Assad L, Poniecka A, Hennessy B, Green M, Buzdar AU, Singletary SE, Hortobagyi GN, Pusztai L. Measurement of Residual Breast Cancer Burden to Predict Survival After Neoadjuvant Chemotherapy. J Clin Oncol 2007;25(28):4414-4422.
- Brix G, Kiessling F, Lucht R, Darai S, Wasser K, Delorme S, Griebel J. Microcirculation and microvasculature in breast tumors: Pharmacokinetic analysis of dynamic MR image series. Magn Reson Med 2004;52(2):420-429.
- Makkat S, Luypaert R, Stadnik T, Bourgain C, Sourbron S, Dujardin M, De Greve J, De Mey J. Deconvolution-based dynamic contrast-enhanced MR imaging of breast tumors: correlation of tumor blood flow with human epidermal growth factor receptor 2 status and clinicopathologic findings--preliminary results. Radiology 2008;249(2):471-482.
- Specht JM, Kurland BF, Montgomery SK, Dunnwald LK, Doot RK, Gralow JR, Ellis GK, Linden HM, Livingston RB, Allison KH, Schubert EK, Mankoff DA. Tumor metabolism and blood flow as assessed by positron emission tomography varies by tumor subtype in locally advanced breast cancer. Clin Cancer Res 2010;16(10):2803-2810.
Figures