1858
Diffusion-Weighted MRI for Non-Contrast Breast Screening: Lesion Conspicuity on Computed vs. Acquired High b-Value Images1Radiology, University of Washington, Seattle, WA, United States
Synopsis
On breast DWI, the relative signal intensity of a lesion can be increased by exploiting the differences in signal decay between tumor and normal tissue at higher b values. Computing high b-value images rather than acquiring them directly can increase lesion conspicuity and decrease scan times, improving the potential utility of breast DWI for non-contrast screening. In women with invasive breast cancer, we investigated the differences in lesion conspicuity across b-values and between acquired and computed diffusion weighted images. Our findings showed maximal lesion conspicuity at higher b-values (1200-1500s/mm2), with acquired images generally providing higher conspicuity than computed images.
Introduction
Diffusion weighted imaging (DWI) has the potential to be used as a quick, non-contrast tool for detecting and characterizing breast cancer. In high b-value diffusion weighted images, the differences in signal decay between cancer and normal tissues can be exploited to increase the signal intensity of cancerous lesions relative to other tissues and improve detectability.1 However, acquiring images at high b-values increases image distortions due to susceptibility effects and eddy-currents and lengthens scan times.2 By computing these high b-value images rather than acquiring them directly, lesion conspicuity can potentially be increased relative to lower b-value images while minimizing scan time and maintaining image quality. The purpose of this study was to quantitatively investigate differences in lesion conspicuity across b-values and between acquired and computed DWI.Methods
In this IRB approved study, women with breast cancer undergoing preoperative breast MRI were enrolled to undergo an extra high b-value DWI scan during their exam. In addition, a diffusion breast phantom was scanned (High Precision Devices [HPD], Boulder, CO)3. All MRI acquisitions were performed on a 3T clinical scanner (Achieva, Philips Healthcare, Best, Netherlands) using a 16-channel breast coil. In vivo DWI scans were acquired with TR/TE=3500/79.9ms, NSA=2, b=0, 100, 800, 1500, 2500s/mm2, high-b-averaging=on, scan time 3:33min. Phantom DWI scans were acquired with TR/TE=3500/80ms, NSA=3, 26 b-values between 0-2500s/mm2, high-b-averaging=off, scan time 13:42min. All scans were acquired with SPAIR and gradient reversal fat suppression, FOV=360x360mm2, 30 slices, pixel size=1.8x1.8x4mm3, in plane SENSE factor=3, and MB-SENSE factor=2.
Apparent diffusion coefficient (ADC) maps were first generated with voxel-by-voxel fitting of:
ADC=ln(S800/S100)/(-Δb)
where S100 and S800 are the signal intensities of the b=100s/mm2 and b=800s/mm2 images, respectively, and ∆b is the difference in b-value (700 s/mm2). Computed high b-value images were then calculated for b-values ranging from b=200-2500s/mm2 using:
Sb=S100(e-Δb·ADC)
where ADC is that calculated above, and ∆b is the difference in b-value between the reference image (S100) and the computed image (Sb). Lesions were segmented on b=1500s/mm2 images and normal tissue regions were segmented on b=0s/mm2 images using a custom threshold based semi-automated tool,4 and segmented regions were propagated to all other b-value images. Lesion contrast-to-noise ratio (CNR) was calculated for both computed and acquired images at each b-value:
CNR=(μlesion-μtissue)/√(σ2lesion+σ2tissue)
where μlesion and μtissue are the mean DWI signal intensities and σlesion and σtissue are the standard deviations for the voxels in the segmented regions. CNR measures from computed and acquired images were compared by Wilcoxon signed-rank test.
Results
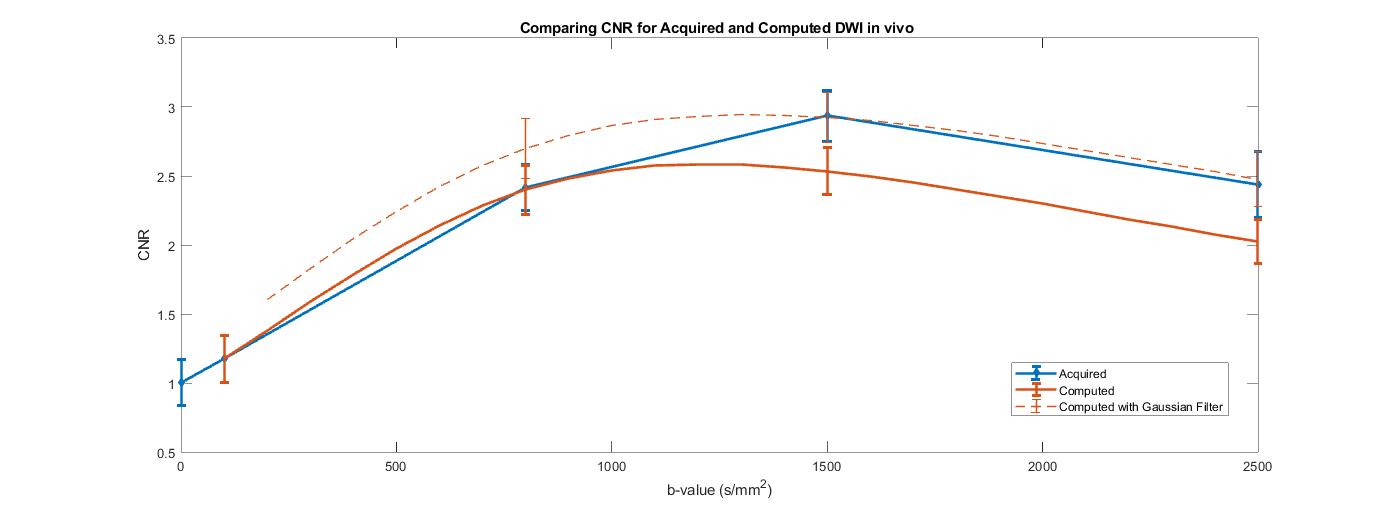
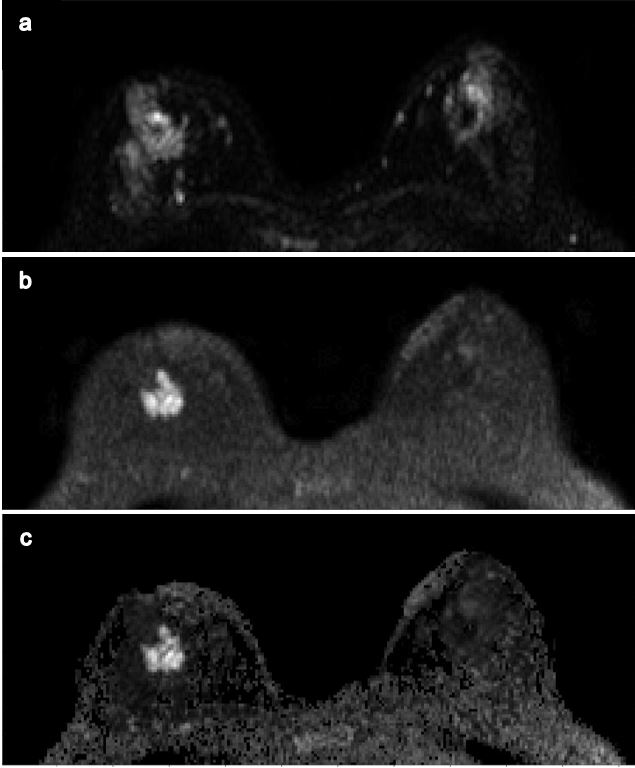
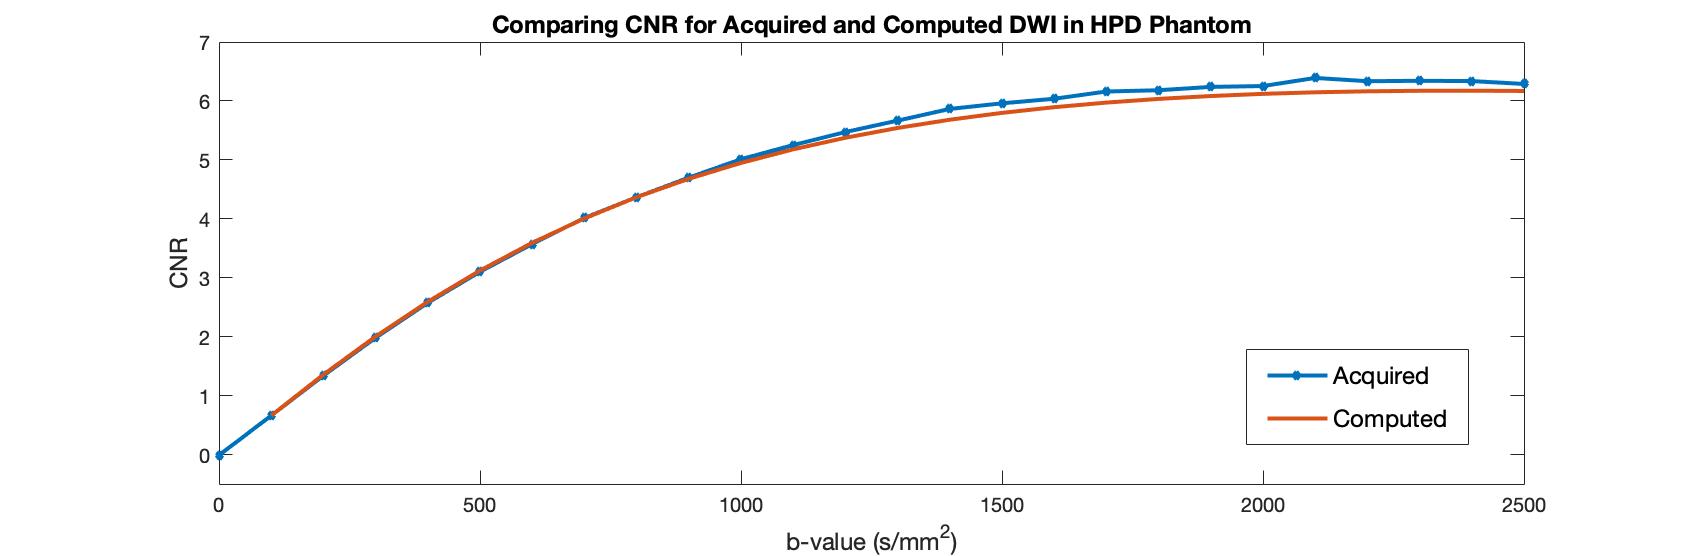
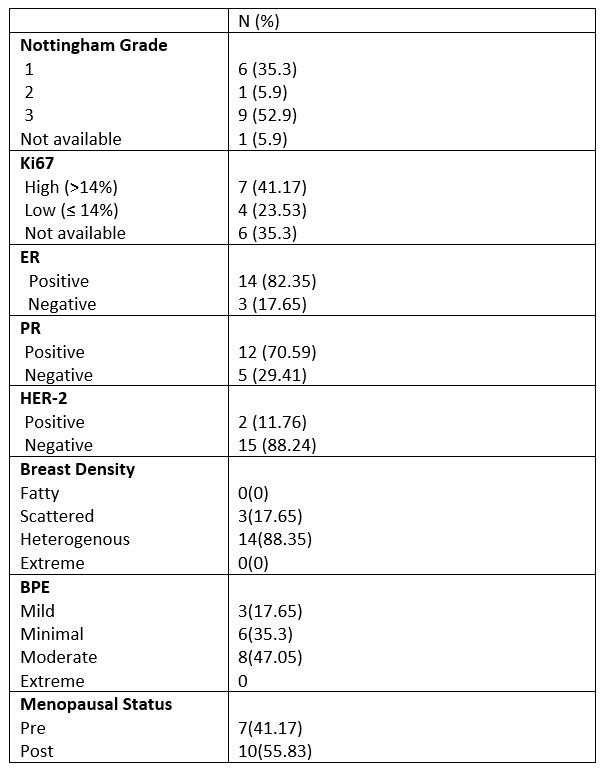
Seventeen patients with invasive breast cancer were evaluated (median age: 52 years), Table 1. In vivo, lesion conspicuity as measured by CNR increased with increasing b-value, peaking at b=1500s/mm2 for acquired images and b=1200s/mm2 for computed images (Fig 1). An example case is shown (Fig 2). Computed and acquired images exhibited similar CNR variations with b-value, although acquired images had significantly higher CNR at b=1500s/mm2 (mean, 2.9 vs. 2.5, p=0.0013) and b=2500s/mm2 (2.4 vs. 2.0, p=0.02). Higher CNR for acquired vs. computed images in vivo was due in part to effects of high-b-averaging during acquisition, where more averages are performed for higher b-values to improve SNR, as well as possible diffusion kurtosis effects presenting in tumors in high b-value acquired images5 that could further increase CNR. Neither high-b-averaging nor kurtosis effects are accounted for in the computed images, which were computed from lower b images (with less averaging) using a monoexponential signal decay model. Further post-processing of computed images by Gaussian smoothing (standard deviation=0.8) reduced noise and improved the CNR at high b-values to be comparable to high-b-averaged acquired images (Fig 1). In the phantom experiment, where neither high-b-averaging nor kurtosis were present, CNR for computed and acquired DWI were closely matched across all b-values and increased continually up to the maximal b-value investigated of 2500s/mm2 (Fig 3).Discussion and Conclusion
Our findings show the maximum conspicuity of invasive breast tumors on DWI is achieved at b=1200-1500s/mm2, which is higher than typical diagnostic breast DWI protocols. Although, optimal b-values likely vary with breast density and other patient and tumor characteristics. Higher lesion CNR for acquired vs. computed images at higher b-values agrees with previous reports6, attributed to both high-b-averaging and diffusion kurtosis effects positively influencing CNR for the directly acquired images. Post-processing techniques such as noise filtering can overcome some of the limitations and further enhance tumor CNR on computed images. Potential advantages of computed DWI including shorter scan times and flexibility to retrospectively generate images at any b-value for optimal interpretation warrant further exploration of the value of this technique for breast imaging.
Acknowledgements
Supported by NIH/NCI research grant R01CA207290 and in-kind support from Philips Healthcare.References
- Woodhams, Reiko, et al. "Diffusion-weighted Imaging of the Breast: Principles and Clinical Applications." Radiographics 2011: 1059-1084.
- Nilsson, M, et al. "Extrapolation-Based References Improve Motion and Eddy-Current Correction of High B-Value DWI Data: Application in Parkinson's Disease Dementia." PLoS One 2015: 10(11):e0141825
- High Precision Devices. "Quantitative MRI (qMRI) Diffusion Phantom (QIBA DWI)." 2017. High Precision Devices (HPD).
- Rahbar H, Kurland BF, Olson ML, Kitsch AE, Scheel JR, Chai X, Usoro J, Lehman CD, Partridge SC. Diffusion Weighted Breast MRI: A Semi-automated Voxel Selection Technique Improves Inter-Reader Reproducibility of Apparent Diffusion Coefficient Measures. Journal of Computer Assisted Tomography (JCAT). 2016: 40(3):428-35.
- Iima M, Yano K, Kataoka M, et al. ”Quantitative non-Gaussian diffusion and intravoxel incoherent motion magnetic resonance imaging: differentiation of malignant and benign breast lesions.” Invest Radiol 2015: 50:205–211.
- Tamura, T, et al. "How to Improve the Conspicuity of Breast Tumors
on Computed High b-value Diffusion-weighted Imaging." Magn Reson Med
Sci 2018.
Figures