1856
Change in breast cancer functional tumor volume and contralateral background parenchymal enhancement is associated with pathological complete response to neoadjuvant therapy1Department of Radiology and Biomedical Imaging, University of California San Francisco, San Francisco, CA, United States, 2Department of Oncology and Pathology, Karolinska Institutet, Stockholm, Sweden, 3Department of Surgery, University of California San Francisco, San Francisco, CA, United States
Synopsis
For women with locally advanced breast cancer, we have examined the change in quantitative measures of MRI tumor volume and background parenchymal enhancement between pre-treatment and after 12 weeks of treatment. In a multivariate model, we found that a larger decrease in MRI tumor volume or in quantitative BPE was associated with higher probability of pathological complete response.
Introduction
In the neoadjuvant chemotherapy setting, it has been shown that pathologic complete response (pCR) is a good predictor for long-term survival of breast cancer [1]. MRI measures of change in tumor volume have been shown to be associated with recurrence-free survival [2-5]. A few smaller studies have also suggested that background parenchymal enhancement (BPE) and the change in BPE with treatment could be predictive of pCR [6, 7]. According to the American College of Radiology guidelines, visual BPE should be assessed by four categories as described in the Breast Imaging Reporting and Data System (BI-RADS) manual [8]. However, a quantitative measure would reduce inter-observer variability and could potentially be a better predictor of therapy response. The purpose of this study is to examine whether the change in MRI tumor volume and the change in BPE are associated with pCR and hormone receptor status in in a cohort of breast cancer patients enrolled in the I-SPY 2 TRIAL and undergoing neoadjuvant treatment [9].Methods
Within the IRB-approved I-SPY2 TRIAL, we examined 247 patients with locally advanced breast cancer undergoing neoadjuvant therapy [10]. pCR was defined by pathological analysis of the surgical specimen and lymph node status showing no residual cancer. We calculated the percent change in MRI functional tumor volume (ΔFTV%) [2] and quantitative BPE (ΔqBPE%) between pre-treatment and inter-regimen scan at the 12-week time point. The qBPE measure was based on automated contralateral whole-breast segmentation and a fuzzy c-means method to classify voxels containing fibroglandular tissue [11]. The tissue classification was quality-assessed by visual inspection of five central slices in the pre-contrast sequence (Table 1). Cases with poor quality fibroglandular classification were excluded from further analysis. qBPE was calculated as (S1 – S0)/S0 where S0 is the signal intensity prior to contrast media injection, and S1 is the signal intensity approximately 2.5 minutes after contrast injection. Baseline measures of qBPE were categorized following the frequency distribution observed for BI-RADS BPE categories in the study population. Linear regression was used to analyse ΔFTV% and ΔqBPE% in association with patient characteristics. Logistic regression was used to model the change measures as predictors of pCR in a univariate model, and multivariate adjusting for covariates: pre-treatment FTV and qBPE, hormone receptor status, Mammaprint score, age at inclusion, menopausal status. Ten-fold cross-validated AUC measures were calculated. All statistical analyses were performed in Stata 14.2.Results
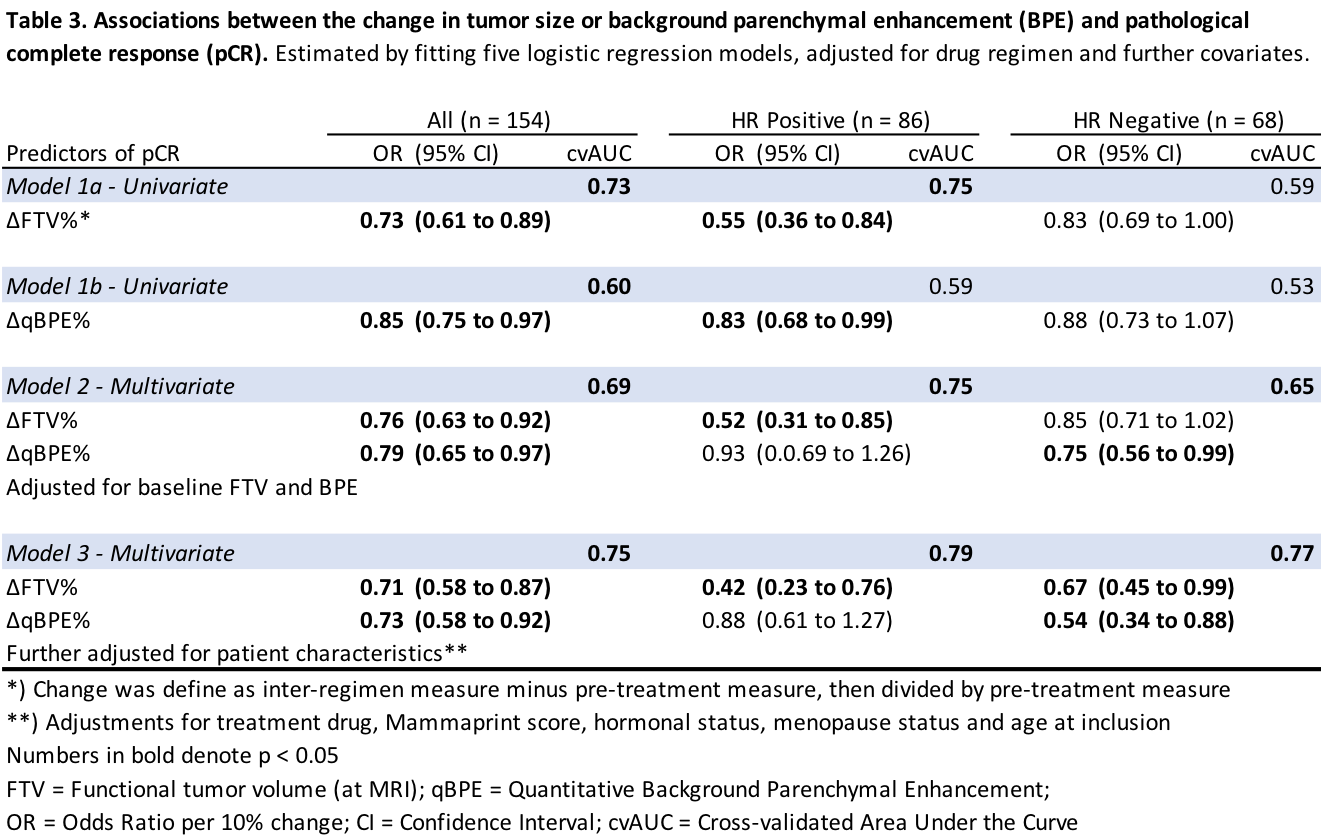
Table 1 shows descriptive characteristics of the 247 patients based on passing or failing image quality assessment. The only difference between patients whose images passed versus failed the quality assessment was that the former group was slightly younger. Table 2 shows that younger patients (p = 0.045, multivariate) and a higher pre-treatment qBPE (p < 0.001, multivariate) were associated with more negative ΔqBPE%. Table 3 describes the associations between the change measures and pCR. Overall, both ΔFTV% (OR 0.71; 95%CI: 0.58 to 0.87) and ΔqBPE% (OR 0.73; 95%CI: 0.58 to 0.92) were associated with pCR after adjustments. There was interaction between ΔqBPE% and ΔFTV% (p=0.031). ΔqBPE% was associated with pCR within hormone receptor positive and negative subgroups. For hormone receptor positive tumors, was univariate associated with pCR (OR 0.83; 95% CI: 0.68 to 0.99) but not after adjustments. For hormone receptor negative tumors, ΔqBPE% was associated with pCR only after adjustments (OR 0.54; 95%CI: 0.34 to 0.88).Discussion
We have determined that both ΔFTV% and ΔqBPE% are associated with pCR in a neoadjuvant chemotherapy setting for women with breast cancer (Table 3). While the association of pCR with FTV% is established, the association with ΔqBPE% supports the results from prior studies that suggested a more pronounced decrease in BPE for patients with a complete pathological response [6, 7]. Interestingly, the association between ΔqBPE% and pCR was dependent on adjusting for ΔFTV%. For hormone receptor positive cancers, our results suggest that ΔqBPE% is not an independent predictor of pCR after taking ΔFTV% into account. For hormone receptor negative cancers, on the other hand, our results show that ΔqBPE% is a predictor of response after taking ΔFTV% into account.Conclusion
We have confirmed that a larger decrease in tumor volume or quantitative BPE is associated with a higher probability of pCR. The differential association between qBPE and pCR in hormone receptor positive and negative tumors warrants further research.Acknowledgements
This work was supported in part by NIH R01 CA132870 and NIH U01 CA225427.References
1. Esserman LJ, Berry DA, DeMichele A, Carey L, Davis SE, Buxton M, Hudis C, Gray JW, Perou C, Yau C, Livasy C, Krontiras H, et al. Pathologic complete response predicts recurrence-free survival more effectively by cancer subset: results from the I-SPY 1 TRIAL--CALGB 150007/150012, ACRIN 6657. Journal of clinical oncology : official journal of the American Society of Clinical Oncology 2012;30: 3242-9.
2. Hylton NM, Blume JD, Bernreuter WK, Pisano ED, Rosen MA, Morris EA, Weatherall PT, Lehman CD, Newstead GM, Polin S. Locally advanced breast cancer: MR imaging for prediction of response to neoadjuvant chemotherapy—results from ACRIN 6657/I-SPY TRIAL. Radiology 2012;263: 663-72.
3. Hylton NM, Gatsonis CA, Rosen MA, Lehman CD, Newitt DC, Partridge SC, Bernreuter WK, Pisano ED, Morris EA, Weatherall PT. Neoadjuvant chemotherapy for breast cancer: functional tumor volume by MR imaging predicts recurrence-free survival—results from the ACRIN 6657/CALGB 150007 I-SPY 1 TRIAL. Radiology 2015;279: 44-55.
4. Henderson SA, Muhammad Gowdh N, Purdie CA, Jordan LB, Evans A, Brunton T, Thompson AM, Vinnicombe S. Breast cancer: influence of tumour volume estimation method at MRI on prediction of pathological response to neoadjuvant chemotherapy. Br J Radiol 2018;91: 20180123.
5. Eom HJ, Cha JH, Choi WJ, Chae EY, Shin HJ, Kim HH. Predictive Clinicopathologic and Dynamic Contrast-Enhanced MRI Findings for Tumor Response to Neoadjuvant Chemotherapy in Triple-Negative Breast Cancer. AJR Am J Roentgenol 2017;208: W225-w30.
6. Preibsch H, Wanner L, Bahrs SD, Wietek BM, Siegmann-Luz KC, Oberlecher E, Hahn M, Staebler A, Nikolaou K, Wiesinger B. Background parenchymal enhancement in breast MRI before and after neoadjuvant chemotherapy: correlation with tumour response. European radiology 2016;26: 1590-6.
7. Chen JH, Yu HJ, Hsu C, Mehta RS, Carpenter PM, Su MY. Background Parenchymal Enhancement of the Contralateral Normal Breast: Association with Tumor Response in Breast Cancer Patients Receiving Neoadjuvant Chemotherapy. Translational oncology 2015;8: 204-9.
8. Acr. 2013 ACR BI-RADS Atlas: Breast Imaging Reporting and Data Systemed.: American College of Radiology, 2014.
9. Barker AD, Sigman CC, Kelloff GJ, Hylton NM, Berry DA, Esserman LJ. I-SPY 2: An Adaptive Breast Cancer Trial Design in the Setting of Neoadjuvant Chemotherapy. Clinical Pharmacology & Therapeutics 2009;86: 97-100.
10. Barker A, Sigman C, Kelloff G, Hylton N, Berry D, Esserman L. I‐SPY 2: an adaptive breast cancer trial design in the setting of neoadjuvant chemotherapy. Clinical Pharmacology & Therapeutics 2009;86: 97-100.
11. Klifa C, Carballido-Gamio J, Wilmes L, Laprie A, Lobo C, Demicco E, Watkins M, Shepherd J, Gibbs J, Hylton N. Quantification of breast tissue index from MR data using fuzzy clustering. Conf Proc IEEE Eng Med Biol Soc 2004;3: 1667-70.
Figures
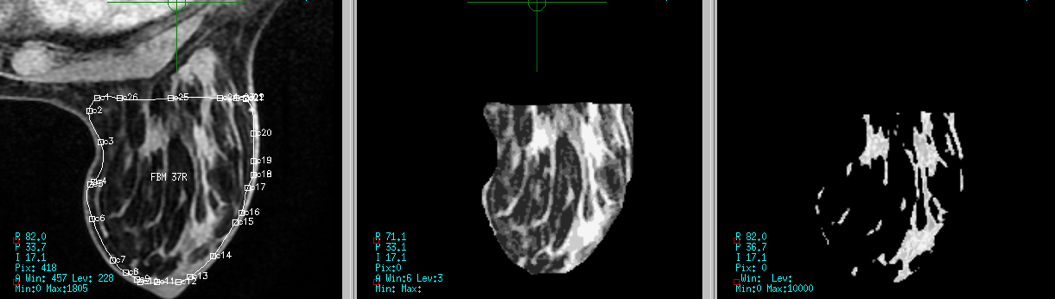


Table 2. Association between patient characteristics and the change in functional tumor volume and BPE between baseline and interregimen. Estimated by linear regression modelling; univariate and multiple adjusted.
A positive β means that the effect of the parameter was a less negative change, e.g., a higher age was associated with a less negative BPE change between pre-treatment and interregimen examination.