1855
A comparison of visual, automated and semi-manual approaches in assessing background parenchymal enhancement as a biomarker for response to neoadjuvant therapy1Department of Radiology and Biomedical Imaging, University of California San Francisco, San Francisco, CA, United States, 2Department of Oncology and Pathology, Karolinska Institutet, Stockholm, Sweden
Synopsis
We have examined different approaches to segmenting the fibroglandular tissue in breast MRI when calculating quantitative background parenchymal enhancement (BPE) as a potential predictor of response to neoadjuvant treatment (pCR). Our results suggest that quantitative approaches to measure BPE might be preferable to visual BI-RADS as a biomarker of response. Change in quantitative BPE with treatment was associated with pCR; but pre-treatment BPE was not. Further research may be directed towards handling wrongful inclusion of non-parenchymal voxels.
Introduction
Quantitative MRI of breast cancer is poised to produce biomarkers that allow more accurate neoadjuvant therapy response evaluation [1-4]. An emerging MRI measure with potential to be a biomarker is background parenchymal enhancement (BPE). The current clinical practice is for the radiologist to visually assess background parenchymal enhancement (BPE) from dynamic contrast enhanced (DCE) MRI by the four BI-RADS [5]. Implementing seemingly straight-forward quantitative BPE measurements gives rise to several practical issues to consider [6, 7]. The precision can be affected by faulty fat suppression, misclassification or under-sampling of the parenchymal tissue, and other artifacts. In this study, we examined the correlation between automated, semi-manual and visual BI-RADS approaches to BPE assessment. We also assessed how each measure, and its change over treatment, was associated with the outcome of pathological complete response (pCR).Methods
Within the I-SPY2 TRIAL, we examined DCE MRI exams for 247 breast cancer patients undergoing neoadjuvant chemotherapy at pre-treatment and inter-regimen (12 week) time-points [8]. The visual BI-RADS BPE on the contralateral breast was determined by a radiologist (FS) with two years’ experience in breast MRI. For automated BPE measures, we used an in-house algorithm for whole-breast segmentation and a fuzzy c-means method to identify fibroglandular tissue [9]. We examined four axial slice-inclusion approaches: full-stack, central half-stack, central five-slices, and 5 slices centered at the nipple level. For the semi-manual BPE measure, we manually placed an outer mask around the parenchymal tissue in a single slice at the nipple level, and when applying the fuzzy c-means method we allowed the reader (FS) to individually fine-tune the clustering. We visually assessed the quality of the automatic fibroglandular tissue identification in three central slices and excluded failed examinations from further analysis. We calculated quantitative qBPE = (S1-S0)/S0, where S0 is the signal intensity prior to contrast media injection, and S1 is the signal intensity at a post-contrast acquisition around 2.5 minutes later. Pre-treatment qBPE was categorized following the same frequency distribution as the BI-RADS categories in the study population. The relative change, ΔqBPE%, between the time-points was calculated. For BI-RADS we calculated the change as inter-regimen category minus pre-treatment category. We estimated correlation coefficients between the BPE measures and associations with pathological complete response (pCR) by logistic regression modeling. The study was IRB-approved, HIPAA compliant and all patients gave written informed consent.Results
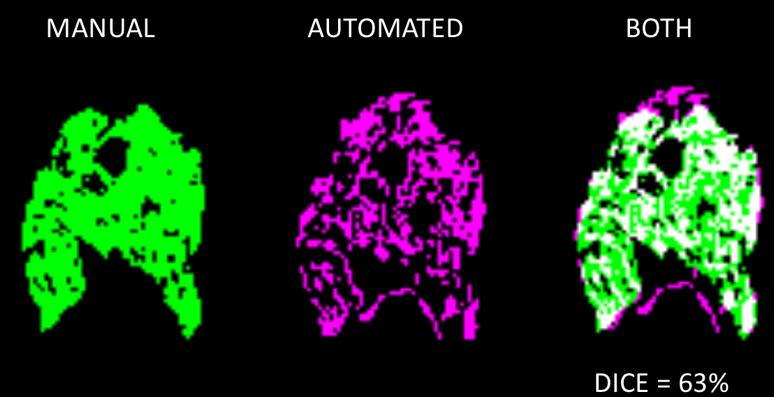
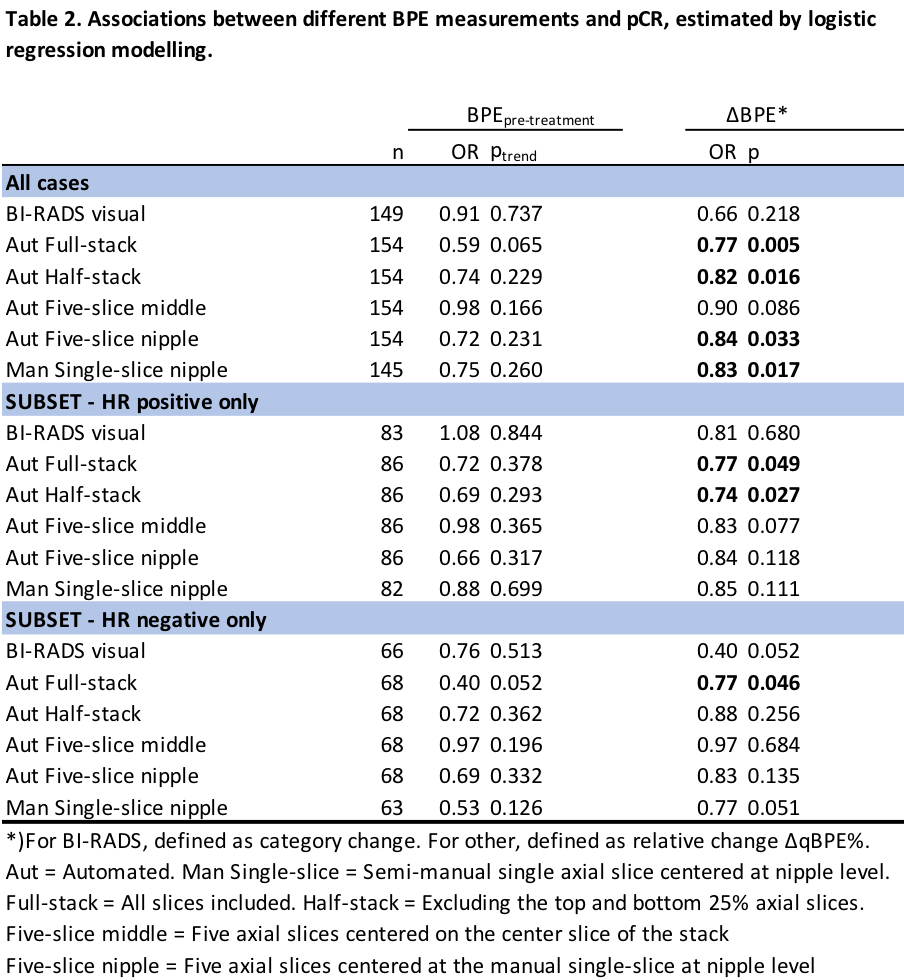
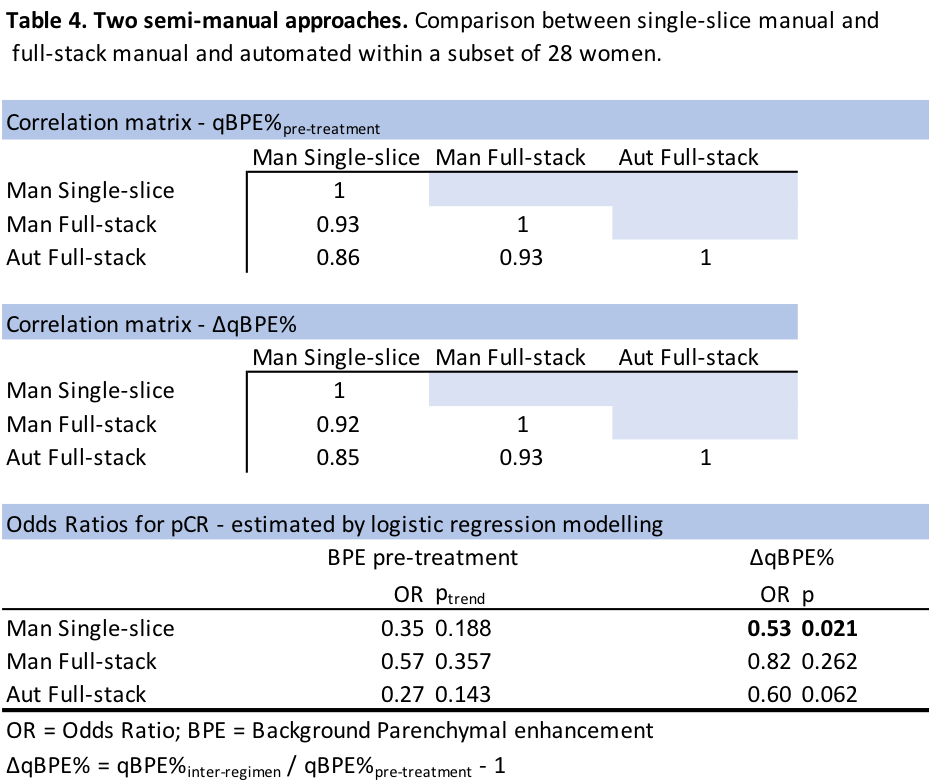
Table 1 shows the distribution of BI-RADS BPE and the mean qBPE measures for each approach in the pCR and the non-pCR group. For qBPE, all segmentation approaches gave similar mean BPE measures. Patients with pCR consistently had a more negative ΔqBPE% compared to patients without pCR. Table 2 shows that none of the methods show any association between pre-treatment BPE and pCR, while ΔqBPE% is significantly associated for most quantitative approaches. Full-stack automated appears to perform the best. Centering the automated five-slice approach at the manually identified nipple slice improved the overall strength of association between ΔqBPE% and pCR. For change in BI-RADS category, there was no association with pCR. A DICE calculation was performed to estimate segmentation concordance (figure 1 shows an example), with an average concordance of 67% between voxels of the semi-manual single-slice and the automated segmentation of the same slice. Table 3 shows that poor biomarker performance arises from poor fat suppression, and coil artifacts reduce the association between ΔqBPE% and pCR. Vessel inclusion affected the correlation between automated and manual qBPE, but its effect on the association with pCR could not be examined due to having just four cases. Under-sampling of fibroglandular tissue did not show evidence of causing deterioration of correlation or prediction measures. In a subset of 28 women (Table 4), it shows that using the manual approach to the full stack does not seem to perform better than applying it to a single slice at nipple level.Discussion
Our results suggest that quantitative approaches to measure BPE might be preferable to visual BI-RADS as a biomarker of response to neoadjuvant therapy. Whether an automated or manual segmentation approach is chosen, it has minimal effect on the qBPE measurements. The most problematic quality issues seem to be wrongful inclusion of non-parenchymal voxels, while the under-sampling of parenchymal tissue does not seem to be a major concern.Conclusion
Automated quantitative BPE measurement is a promising approach to neoadjuvant therapy response assessment. Further research will be directed towards handling the wrongful inclusion of non-parenchymal voxels.Acknowledgements
This work was supported in part by NIH R01 CA132870 and NIH U01 CA225427.References
1. Hylton NM, Blume JD, Bernreuter WK, Pisano ED, Rosen MA, Morris EA, Weatherall PT, Lehman CD, Newstead GM, Polin S. Locally advanced breast cancer: MR imaging for prediction of response to neoadjuvant chemotherapy—results from ACRIN 6657/I-SPY TRIAL. Radiology 2012;263: 663-72.
2. Hylton NM, Gatsonis CA, Rosen MA, Lehman CD, Newitt DC, Partridge SC, Bernreuter WK, Pisano ED, Morris EA, Weatherall PT. Neoadjuvant chemotherapy for breast cancer: functional tumor volume by MR imaging predicts recurrence-free survival—results from the ACRIN 6657/CALGB 150007 I-SPY 1 TRIAL. Radiology 2015;279: 44-55.
3. Teruel JR, Heldahl MG, Goa PE, Pickles M, Lundgren S, Bathen TF, Gibbs P. Dynamic contrast‐enhanced MRI texture analysis for pretreatment prediction of clinical and pathological response to neoadjuvant chemotherapy in patients with locally advanced breast cancer. NMR in Biomedicine 2014;27: 887-96.
4. Li H, Zhu Y, Burnside ES, Drukker K, Hoadley KA, Fan C, Conzen SD, Whitman GJ, Sutton EJ, Net JM. MR imaging radiomics signatures for predicting the risk of breast cancer recurrence as given by research versions of MammaPrint, Oncotype DX, and PAM50 gene assays. Radiology 2016;281: 382-91.
5. Acr. 2013 ACR BI-RADS Atlas: Breast Imaging Reporting and Data Systemed.: American College of Radiology, 2014.
6. Preibsch H, Wanner L, Bahrs SD, Wietek BM, Siegmann-Luz KC, Oberlecher E, Hahn M, Staebler A, Nikolaou K, Wiesinger B. Background parenchymal enhancement in breast MRI before and after neoadjuvant chemotherapy: correlation with tumour response. European radiology 2016;26: 1590-6.
7. Chen JH, Yu HJ, Hsu C, Mehta RS, Carpenter PM, Su MY. Background Parenchymal Enhancement of the Contralateral Normal Breast: Association with Tumor Response in Breast Cancer Patients Receiving Neoadjuvant Chemotherapy. Translational oncology 2015;8: 204-9.
8. Barker A, Sigman C, Kelloff G, Hylton N, Berry D, Esserman L. I‐SPY 2: an adaptive breast cancer trial design in the setting of neoadjuvant chemotherapy. Clinical Pharmacology & Therapeutics 2009;86: 97-100.
9. Klifa C, Carballido-Gamio J, Wilmes L, Laprie A, Lobo C, Demicco E, Watkins M, Shepherd J, Gibbs J, Hylton N. Quantification of breast tissue index from MR data using fuzzy clustering. Conf Proc IEEE Eng Med Biol Soc 2004;3: 1667-70
Figures