1847
Pelvic MRI with Segmentation and 3D Anatomical Renderings Provide a Novel Method for Quantifying Clinically Relevant Parameters of the Lower Urinary Tract1Radiology, University of Wisconsin School of Medicine and Public Health, Madison, WI, United States, 2Medical Physics, University of Wisconsin School of Medicine and Public Health, Madison, WI, United States, 3Mechanical Engineering, University of Wisconsin School of Medicine and Public Health, Madison, WI, United States, 4Biomedical Engineering, University of Wisconsin School of Medicine and Public Health, Madison, WI, United States
Synopsis
Prior imaging studies with ultrasound and CT have shown that bladder wall thickness (BWT), detrusor muscle volume (DMV) and prostate volume (PV) increase with age. We found a significant increase in DMV, BWT and PV when comparing males aged 30-39 to 60-69. There was no significant increase in BWT in females from the third to the sixth decade. While DMV increased significantly for women, the percent increase in muscle volume was substantially higher for men, likely the result of prostate hypertrophy. This is the first study, to our knowledge, to correlate physiologic changes of the urinary system in men and women using MRI.
Introduction
Prior studies have shown that changes in the structure of the lower urinary tract occur with age1. Such changes include thickening of the bladder wall, which in men, may be attributable in part to an enlargement of the prostate2. Often times, these changes manifest as lower urinary tract symptoms (LUTS) and/or bladder outlet obstruction (BOO), both of which can have a substantial negative impact on quality of life3. Numerous imaging studies using ultrasound (US) and computed tomography (CT) have correlated aging and physiological changes in the lower urinary tract of men and women with LUTS and BOO1-8. Importantly, bladder wall thickness (BWT) can predict the presence and severity of LUTS and BOO in men. Here, we investigate age-related urinary tract changes using a novel method consisting of generation and analysis of 3D anatomical models of the bladder and prostate from pelvic MR images.Methods
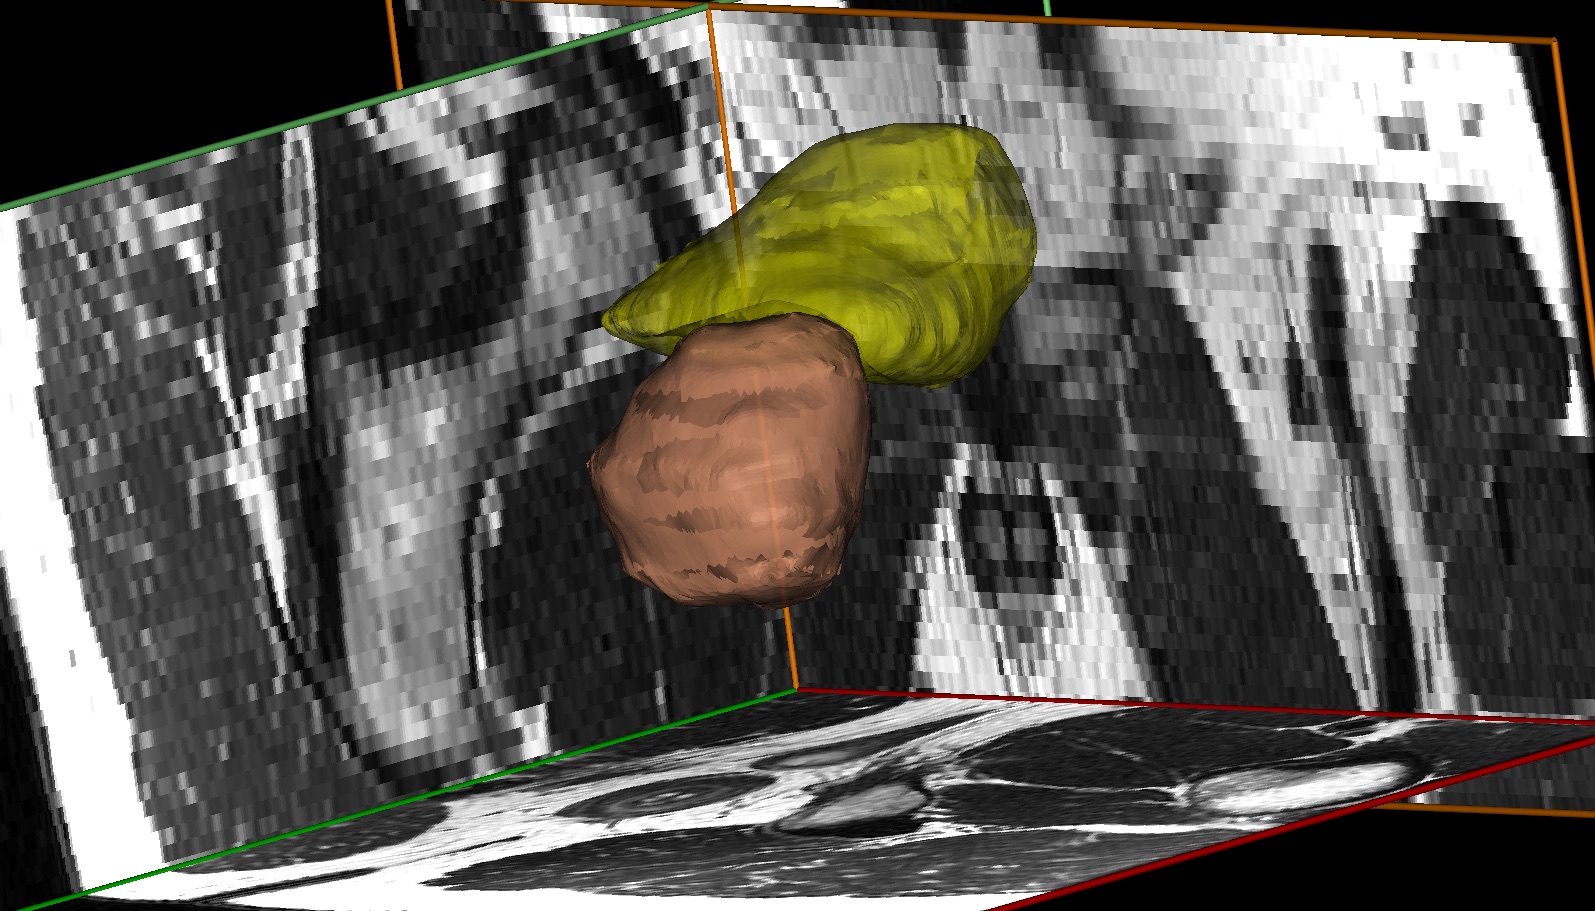
With IRB approval and following a HIPAA compliant protocol, 58 male and 59 female pelvic MRIs of subjects aged 30-69 were retrospectively analyzed and grouped by decade of age (male: n30= 14, n40 = 15, n50 = 15, n60 = 14; female: n30 = 16, n40 = 14, n50 = 15, n60= 14). All MRIs were performed on a clinical 3T scanner (Discovery MR 750, GE Healthcare, Waukesha, WI) using a 32-channel body coil (NeoCoil, Pewaukee, WI) or a 1.5T scanner (MR450) with an 8-channel coil. The prostate and detrusor muscle were segmented (Mimics, Materialize, Leuven, Belgium) in males and the detrusor muscle in females from fast-spin echo (FSE) T2-weighted acquisitions, allowing for 3D visualization and measurement of BWT, DMV and PV (Fig. 1). BWT was recorded at 1) the anterior bladder wall and 2) site of maximum thickness. Statistical analysis was conducted using Student’s t-test with p<0.05 considered significant.Results
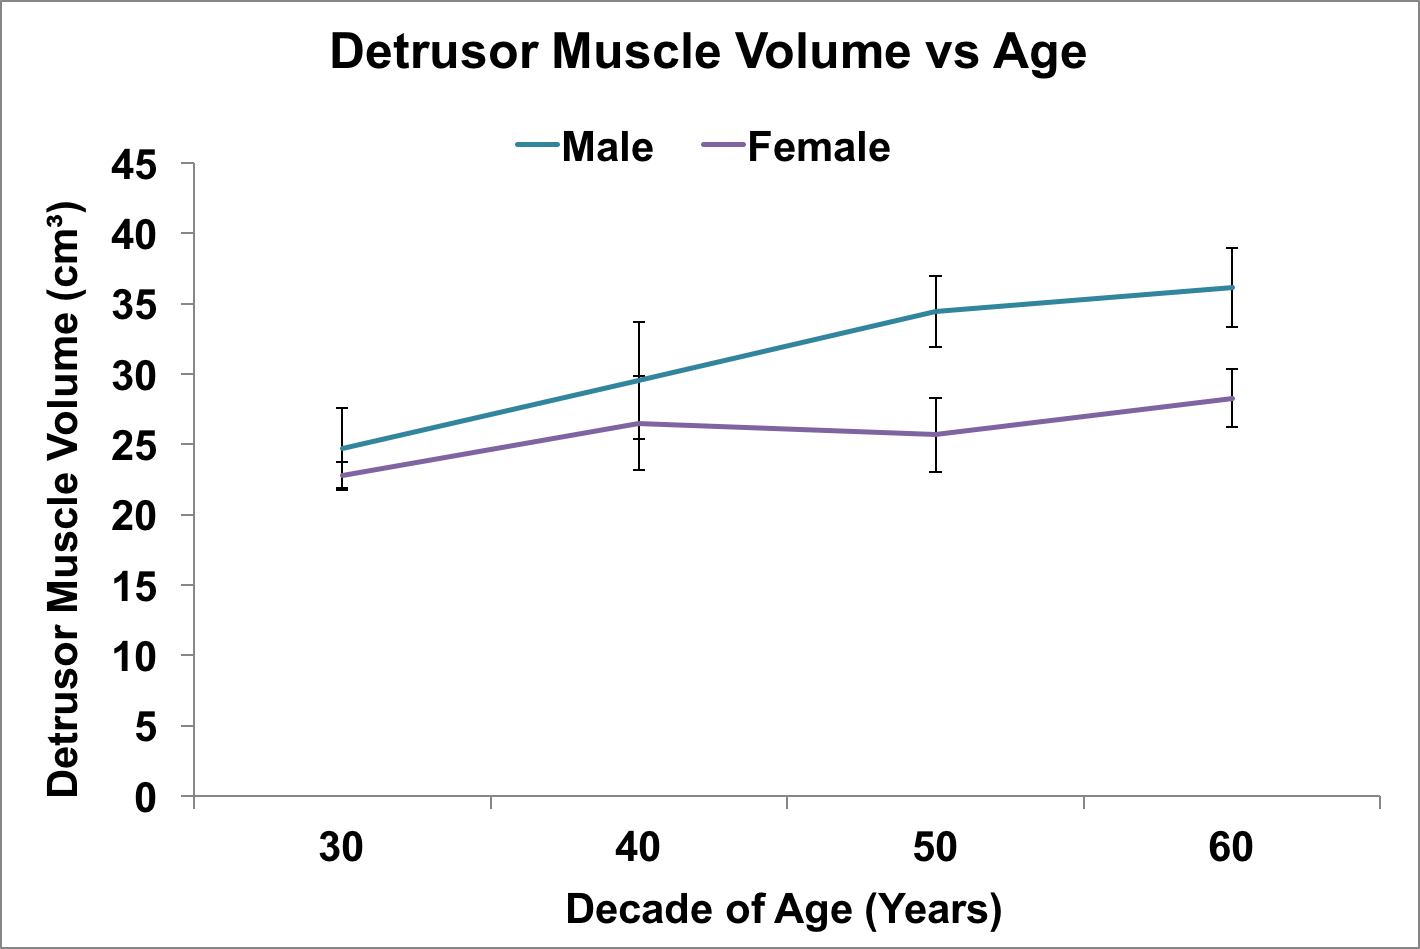
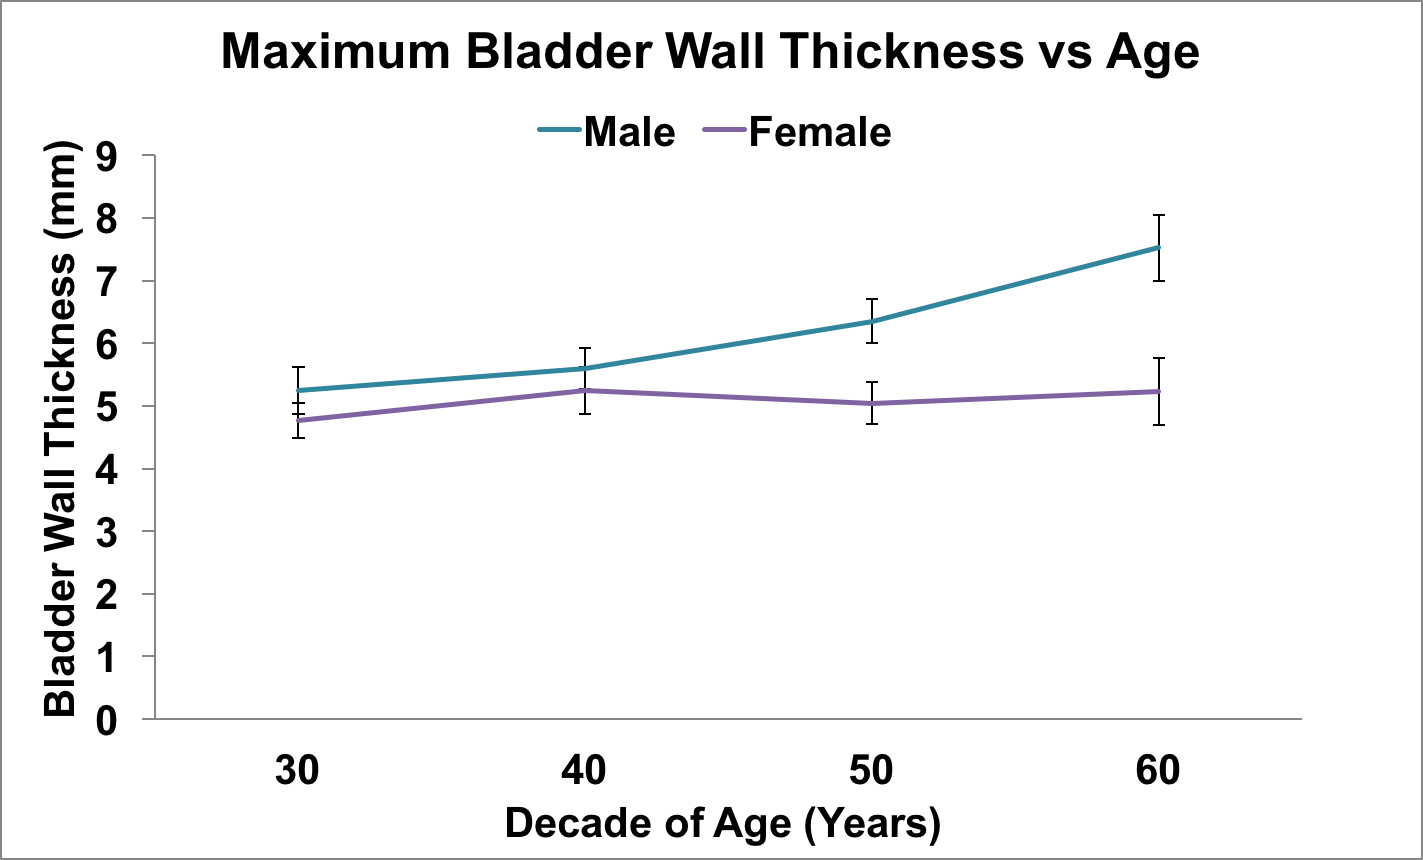
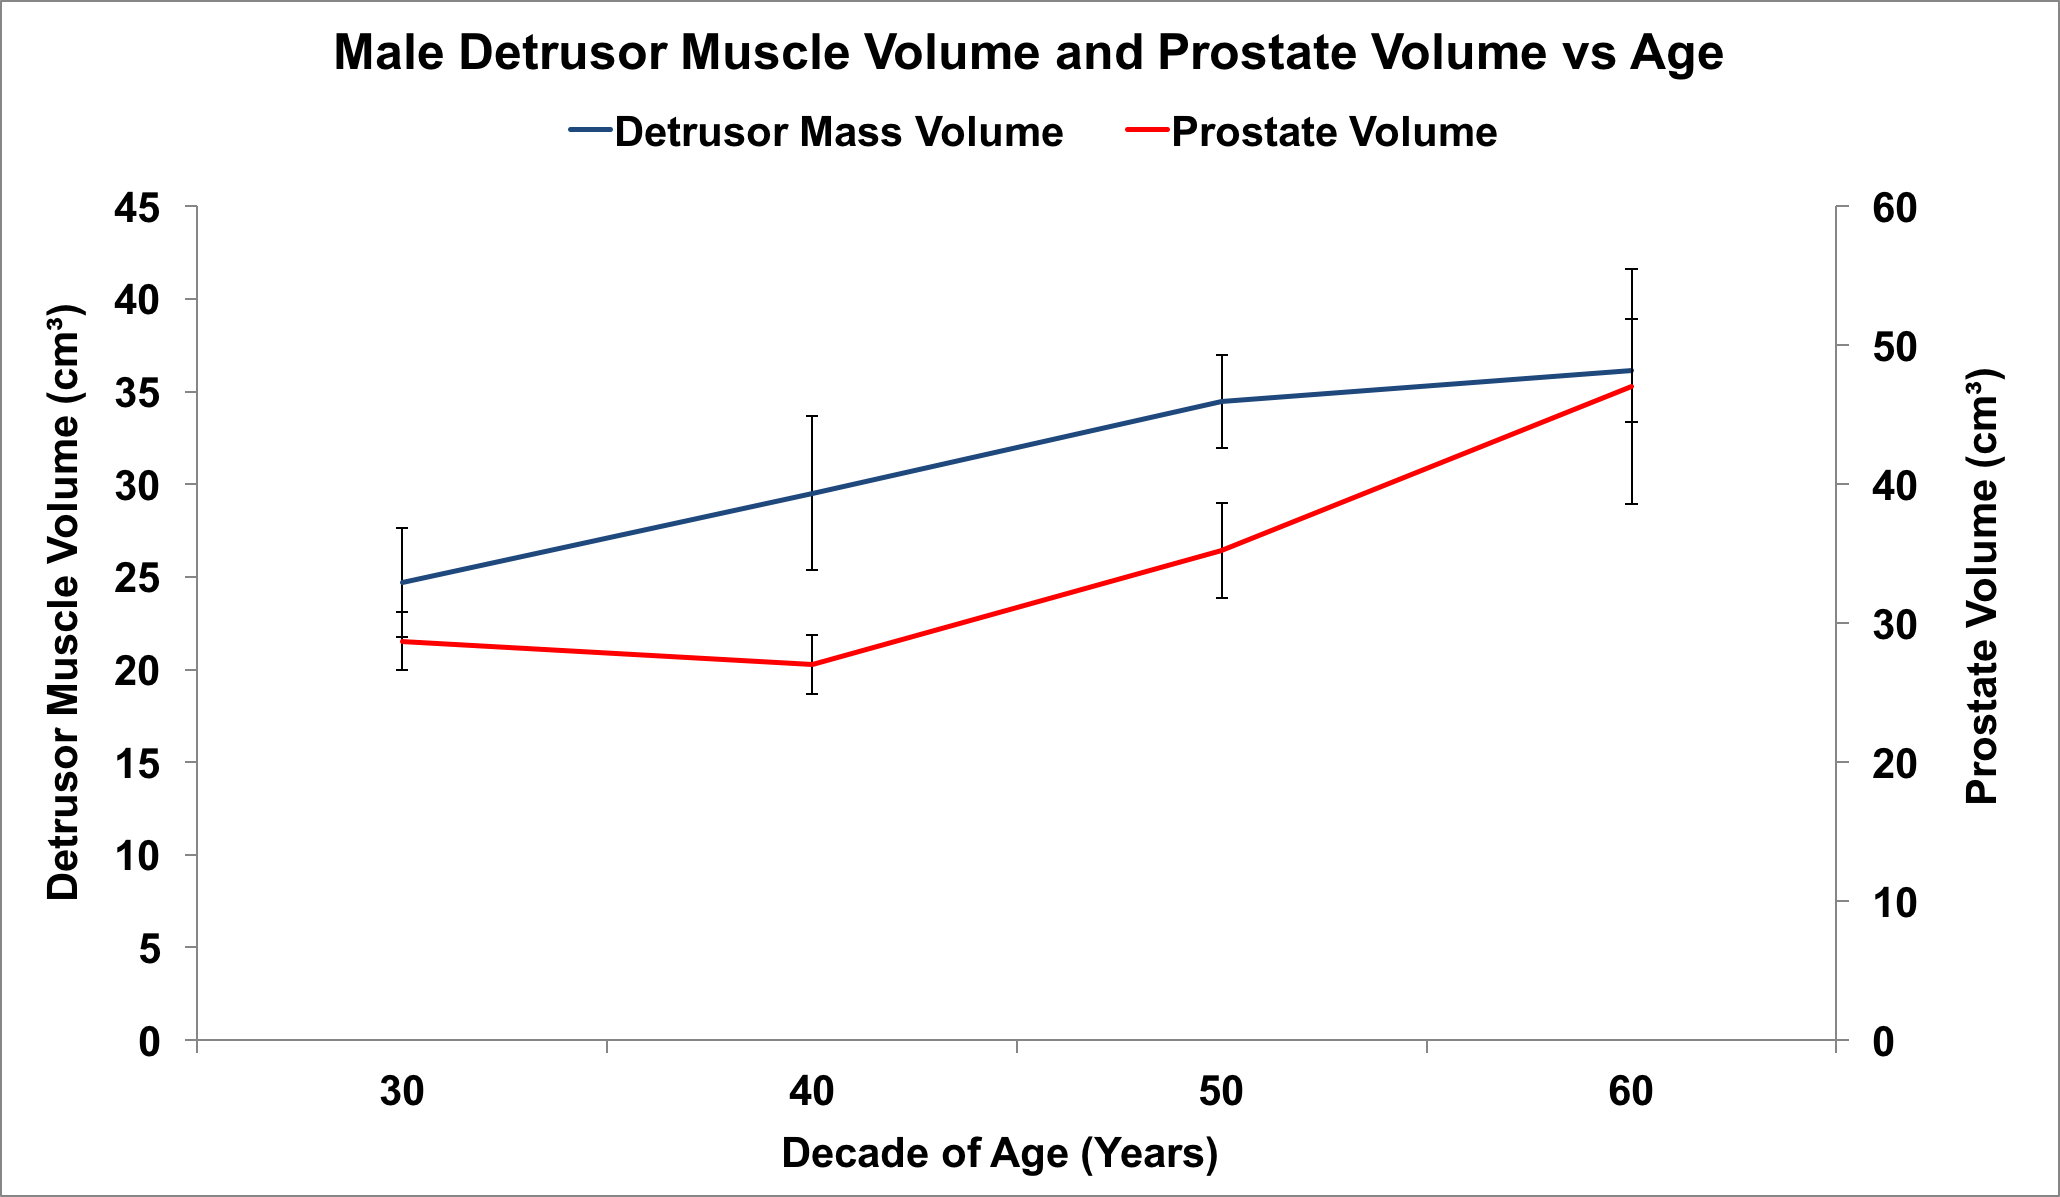
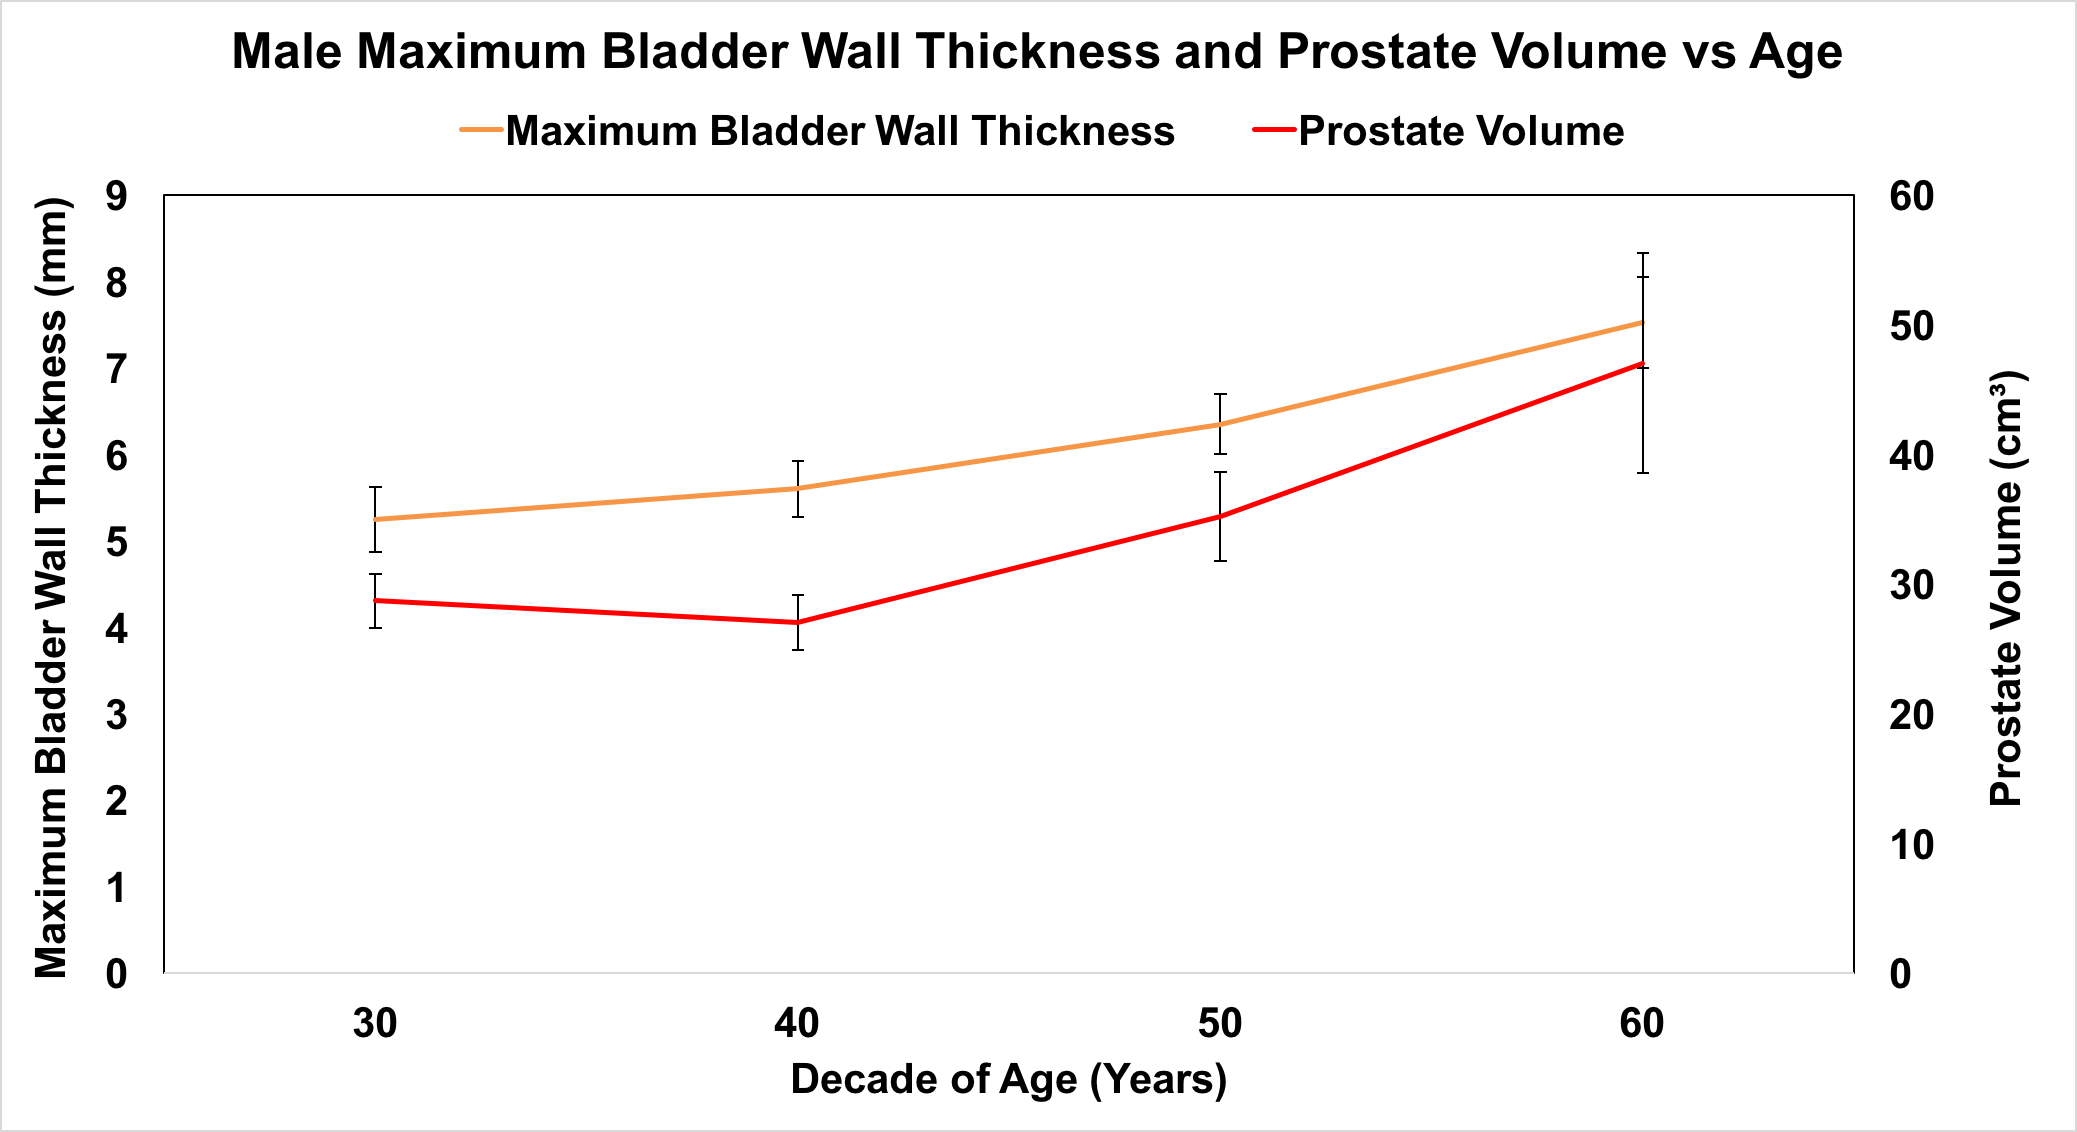
DMV increased significantly from the third to sixth decade in both males and females (p=0.01 and p=0.02, respectively) (Fig. 2). The change in mean DMV was higher for men compared to women (46.4% vs 24.0% change, respectively). Mean anterior and maximum BWT increased significantly with age in males from the third to sixth decade [3.98mm to 5.51mm (p=0.01) and 5.24mm to 7.52mm (p=0.002), respectively] (Fig. 3). In contrast, there was no significant increase in anterior or maximum BWT in females (p=0.25 and p=0.42, respectively). Mean prostate volume increased 63.9% from the third to sixth decade (28.7cm3 to 47.0cm3 p=0.045) (Fig. 4 and 5).Discussion
We found a significant increase in BWT and PV from the third to sixth decade of life in men, while no significant change was seen across the same time frame in BWT for women. Further, the percent increase in DMV was considerably higher for males compared to females. The findings of our study support the notion that age-related increases in prostate volume result in higher resistance to the expulsion of urine, triggering detrusor hypertrophy9. Our results suggest that pelvic MRI can be used to assess and quantify multiple physiologic parameters (BWT, DMV, PV) of the lower urinary tract in both men and women.Conclusion
Pelvic MRI with segmentation and 3D anatomical renderings provide a novel method for quantifying clinically relevant parameters of the lower urinary tract including bladder wall thickness, detrusor muscle and prostate volume. Our MRI findings support previous findings of age-related increases in prostate volume leading to detrusor muscle hypertrophy. Future directions aim to compare these imaging findings to LUTS symptom scores, BMI, and other patient health conditions.Acknowledgements
This work is supported by the K12 research grant K12DK100022.References
1. Fananapazir, G., Kitich, A., Lamba, R., Stewart, SL. and Corwin, MT. “Normal reference values for bladder wall thickness on CT in a healthy population.” Abdominal Radiology. 2018. 43: 2442-2445.
2. Güzel, Ö., Aslan, Y., Balcı, M., Tuncel, A., Keten, T., Erkan, A. and Atan, A. "Can Bladder Wall Thickness Measurement Be Used for Detecting Bladder Outlet Obstruction?" Urology. 2015. 86(3): 439-444.
3. Franco, G., De Nunzio, C., Leonardo, C., Tubaro, A., Ciccariello, M., De Dominicis, C., Miano, L. and Laurenti, C. "Ultrasound Assessment of Intravesical Prostatic Protrusion and Detrusor Wall Thickness—New Standards for Noninvasive Bladder Outlet Obstruction Diagnosis?" The Journal of Urology. 2010. 183(6): 2270-274.
4. Ahmed, AF., and Bedewi, M. "Can Bladder and Prostate Sonomorphology Be Used for Detecting Bladder Outlet Obstruction in Patients With Symptomatic Benign Prostatic Hyperplasia?" Urology. 2016. 98: 126-31.
5. Hakenberg, OW., Linne, C., Manseck, A. and Wirth, MP. “Bladder Wall Thickness in Normal Adults and Men With Mild Lower Urinary Tract Symptoms and Benign Prostatic Enlargement.” Neurology and Urodynamics. 2000. 19: 585-593.
6. Bright, E., Pearcy, R. and Abrams, P. “Automatic evaluation of ultrasonography-estimated bladder weight and bladder wall thickness in community-dwelling men with presumably normal bladder function.” BJU International. 2011. 109: 1044-1050.
7. Lee, H., Choo, M., Kim, M., Cho, SY., Lee, SB., Jeong, H. and Son, H. “Changes in Bladder Wall Thickness and Detrusor Wall Thickness After Surgical Treatment of Benign Prostatic Enlargement in Patients With Lower Urinary Tract Symptoms: A Preliminary Report.” Korean Journal of Urology. 2013. 55(1): 47-51.
8. Deirmentzoglou, S., Giannitsas, K., Perimenis, P., Petsas, T. and Athanasopoulos, A. "Correlation of Ultrasound-estimated Bladder Weight to Urodynamic Diagnoses in Women With Lower Urinary Tract Symptoms." Urology. 2012. 80(1): 66-70.
9. Mirone, V., Imbimbo, C., Longo, N. and Fusco, F. "The Detrusor Muscle: An Innocent Victim of Bladder Outlet Obstruction." European Urology. 2007. 51(1): 57-66.
Figures