1837
T1 Imaging of Transition Zone Prostate Cancer: Why Quantitative Maps But Not T1 Weighted Images Are Helpful1Radiology, Case Western Reserve University, Cleveland, OH, United States, 2Diagnostic, Pediatric and Interventional Radiology, Inselspital, Bern, Switzerland, 3Radiology, Mayo Clinic, Rochester, MN, United States, 4Urology, University Hospitals Cleveland Medical Center, Cleveland, OH, United States, 5Radiology, University Hospitals Cleveland Medical Center, Cleveland, OH, United States
Synopsis
It has been shown that quantitative T1 relaxation times measured on T1 maps may help differentiate transition zone (TZ) cancer from normal transition zone (NTZ). However, T1 weighted images are not utilized for non-contrast detection of prostate cancer. In this study, we explored scientific reasons why T1w images have not been found to be of utility for this purpose. Fat suppressed T1w 3D gradient echo (VIBE) sequence acquisition settings were adjusted based on simulated acquisition parameters and our measured differences between cancer and NTZ, to try to maximize differences in calculated signal between tumor lesions and NTZ. The resulting contrast remains too subtle to utilize for detection; though quantitative differences are readily measureable.
Introduction
Prostate cancer is the commonest cancer in men and 25-45% of all prostate cancer are located in the transition zone (TZ) (1). Traditionally, TZ lesions are characterized primarily on T2w images, with secondary importance given to diffusion weighted imaging (DWI) or dynamic contrast enhanced imaging in cases of suboptimal DWI (2). Recent work with MR Fingerprinting has shown that T1 maps may differentiate cancer from normal transition zone (NTZ) with TZ cancer having significantly shorter T1 relaxation time than the NTZ (3). However clinically, non-contrast T1w images are used almost exclusively for the exclusion of post-biopsy hemorrhage and as a reference for DCE-MRI, but not for prostate cancer detection. The goal of this work was to explore the scientific reason why T1w images have not been found to be of utility in prostate cancer detection and characterization, despite measureable T1 differences between cancer and normal tissue.Methods
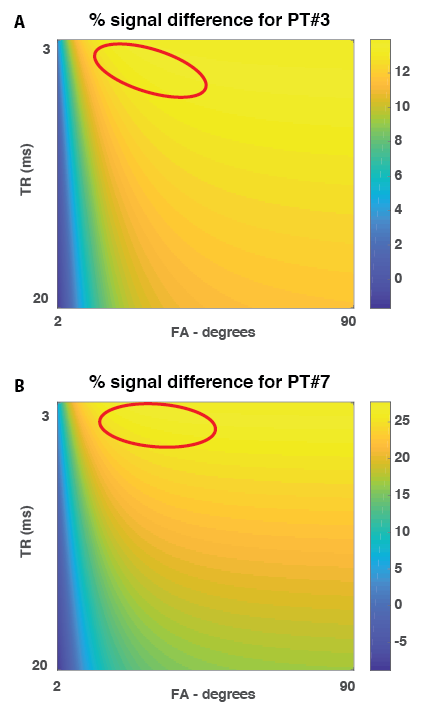
All patients underwent a prostate MRI exam on a 3T scanner (Magnetom Verio, Siemens Healthineers) including high-resolution T2w images, MR Fingerprinting, DWI with ADC mapping and T1w gradient echo sequence (VIBE) with consecutive in-gantry biopsy of suspicious lesions. After the MRF scan the relaxation times for the suspicious lesions as well as for normal transition zone were measured for each patient by drawing ROI on the individual T1maps while biopsy trajectory was planned. These relaxation times were used to simulate expected signal and signal differences between cancer and normal tissue for a wide range of possible acquisition parameters with 3D FS Gradient Echo T1w imaging (VIBE on the Siemens platform) (Figure 1). Based on this simulation, for each patient we identified the optimal combination of TE, TR and flip angle that maximized the signal difference between the lesion and NTZ. These settings were used to adjust the VIBE acquisition. Due to time constraints and in order to not interfere with the biopsy workflow, only one T1w VIBE acquisition per patient was performed. In-gantry biopsy was performed as usual after the VIBE scan.Results
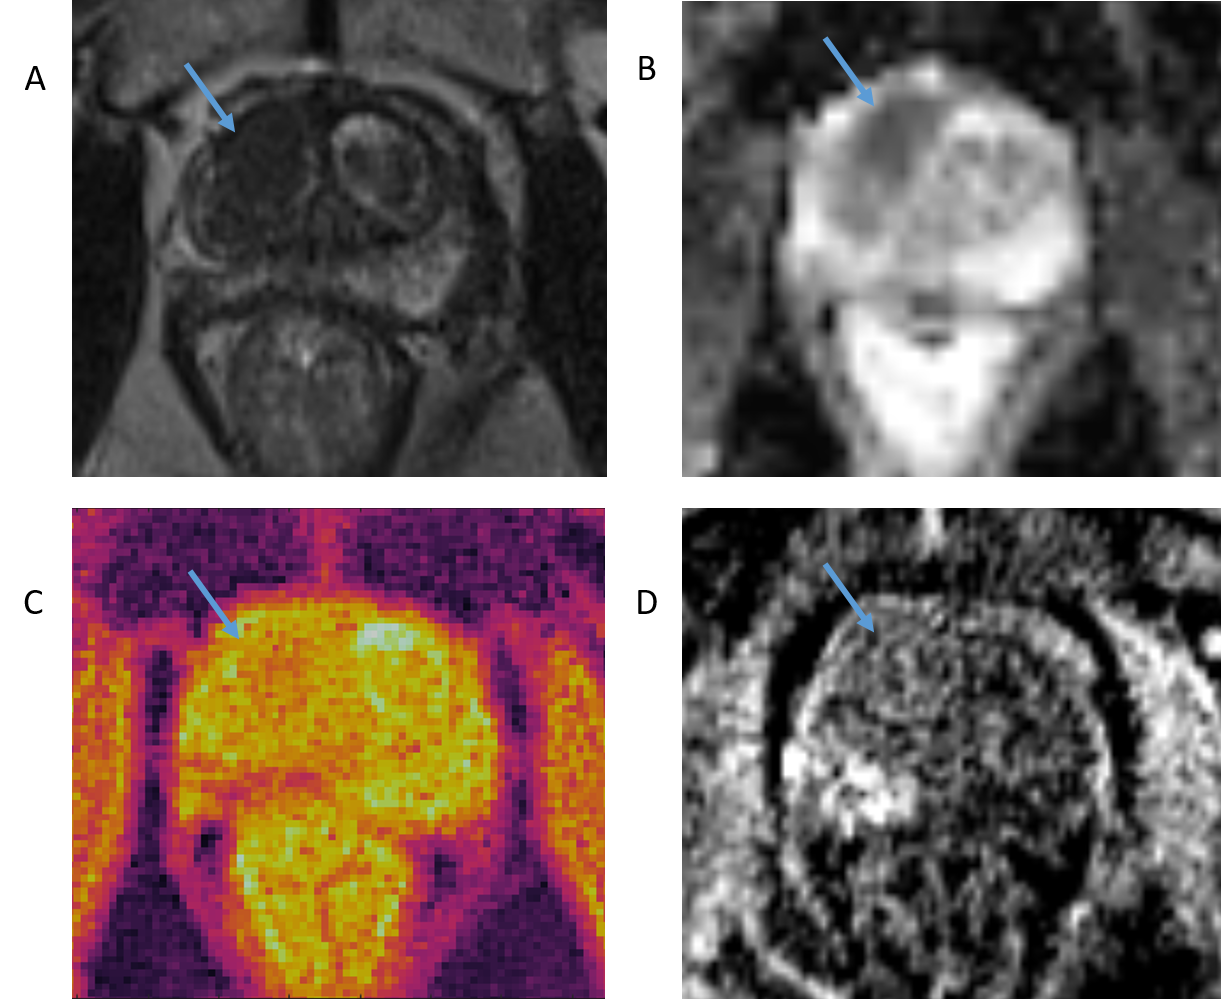
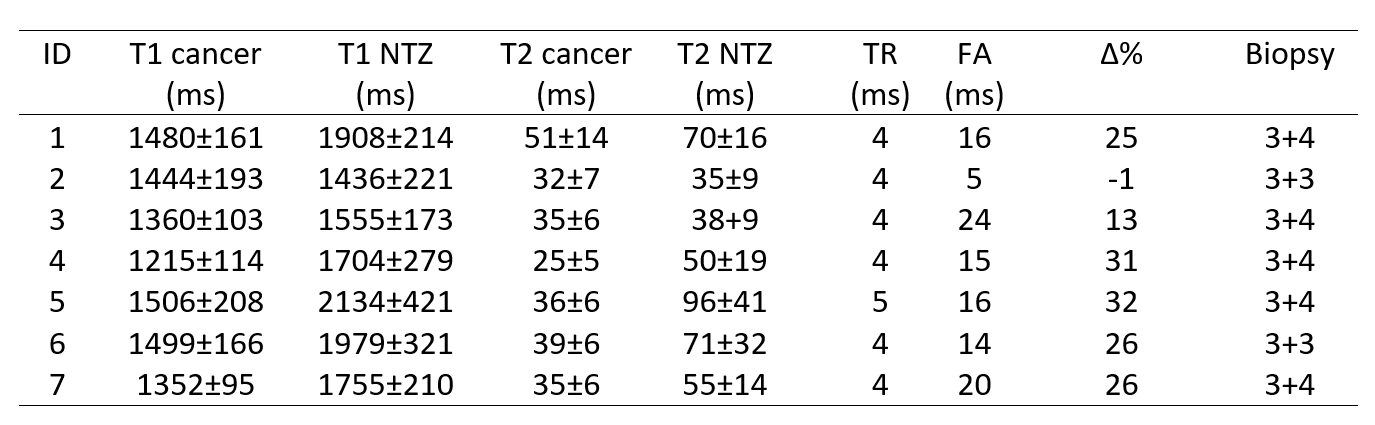
In 7 patients (median age 70 years, range 54-80 years) measured T1 and T2 relaxation times demonstrated in Table 1. Mean T1 values for cancer lesions were 1408 ± 98 ms and 1782 ± 82 ms for NTZ. Table 1 also shows the calculated TR and FA for each patient ranging between 4-5 ms (TR) and 5-32° (FA) and are demonstrated in Table 1. Projected maximal percent signal differences ranged between -1 and 32%. To demonstrate this range of signal difference, Figure 1 visualizes the simulation plots from two different patients with a result of 13 and 27% in Figure 1A) and 1B), respectively. The acquired VIBE images resulting from different combinations of TE, TR and FA did not reveal consistent detection of the TZ lesions known from T2w, DWI images and/or T1/T2 maps from MRF. A patient example with only subtle visual difference between tumor and NTZ is given in Figure 2.Discussion
Although calculated percent signal differences for transitional zone prostate cancer and normal transition zone relaxation times were up to 32%, the resulting visual contrast was very subtle (see, for example Figure 2). The lesion seen in right anterior transition zone can be retrospectively identified based on T1w contrast, but prospective detection with such a sequence would be difficult. As demonstrated in prior studies (3), the overall difference in the TZ between T1 of cancer and NTZ is in the range of 200-300 ms (13-23%). This results in a maximal absolute signal difference of 0.01 (considering initial magnetization of 1 for both tissues in simulation). Even though percent differences are high, actual contrast between normal and cancer tissues remains low. Each patient’s T1w VIBE scan was optimized based on the same patient’s relaxation times and not a group average or results from the literature. This approach ensures the maximum possible contrast in a T1w scan. In the presence of noise, this may not be large enough magnitude for visual detection.Conclusion
While T1maps are a helpful tool in addition to T2 and ADC measurements to quantitatively characterize transitional zone cancer, T1w images are not useful in the cancer detection step, due to insufficient contrast between lesion and adjacent tissue.Acknowledgements
This research was supported by NIH Grant 1R01CA208236-01A1 and Siemens Healthineers.References
1. Patel V, Merrick GS, Allen ZA, Andreini H, Taubenslag W, Singh S, et al. The incidence of transition zone prostate cancer diagnosed by transperineal template-guided mapping biopsy: implications for treatment planning. Urology. 2011;77(5):1148-52.
2. Weinreb JC, Barentsz JO, Choyke PL, Cornud F, Haider MA, Macura KJ, et al. PI-RADS Prostate Imaging - Reporting and Data System: 2015, Version 2. European urology. 2016;69(1):16-40.
3. Panda A, Margevicius S,Jiang Y, et al. MR Fingerprinting and ADC Mapping for Characterization of Lesions in Transitional Zone of Prostate. Abstract 7514. Proc Int Soc Mag Res Med 26:4502 (2018). Paris, France.
Figures