1835
Integrating Computer-aided Diagnosis as Concurrent Reader into Prostate Multiparametric MRI Diagnostic Process - Reader Performance Study1Radiology, Peking University First Hospital, Beijing, China
Synopsis
Many computer-aided diagnosis (CAD) systems based on prostate multiparametric MRI (mpMRI) have been developed with good stand-alone diagnostic efficacy. Before its widely use in daily clinical work, further study still should be done for CAD reading paradigm and the interaction between CAD and radiologists. In this article, we integrated CAD as concurrent reader into prostate mpMRI diagnostic process in real clinical practice to determine effect on radiologist performance. The results showed that concurrent CAD reading could improve radiologist sensitivity and reduce the reading time.
Introduction
Evaluate integrating computer-aided diagnosis (CAD) as concurrent reader into prostate multiparametric MRI (mpMRI) diagnostic process in real clinical practice to determine effect on radiologist performance.Methods
This retrospective study included 153 consecutive patients with suspected prostate cancer (PCa) from our department between May 2014 and September 2016, who underwent cognitive TRUS-MRI fusion prostate biopsy within 3 months after mpMRI (including T2WI, DWI and DCE) examination. Finally, 89 patients were confirmed as PCa and 64 patients were confirmed as non-PCa by biopsy.
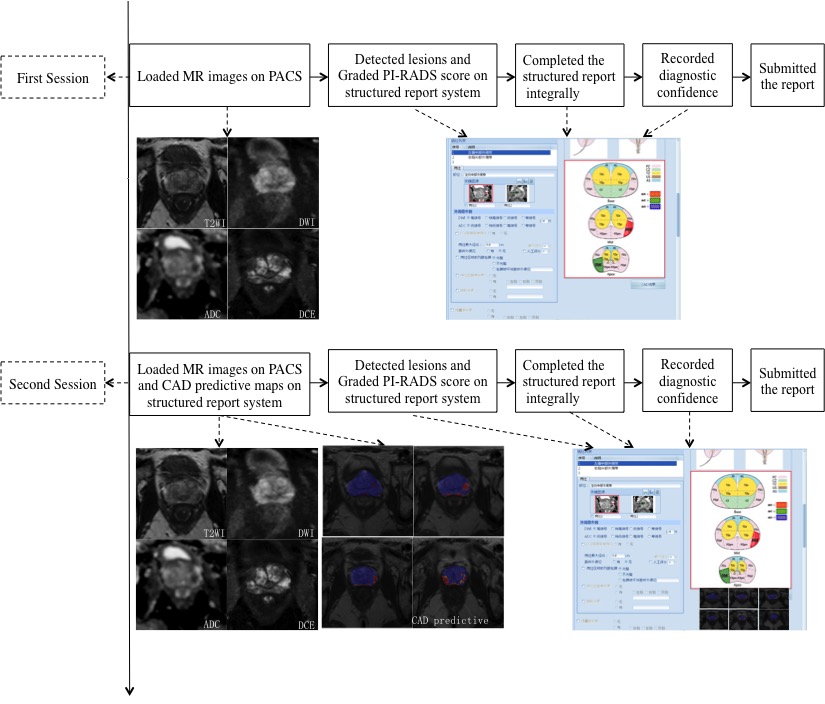
Ten readers were all residents with less than 1 year of experience in prostate imaging(<200 prostate MRI reports). The readers evaluated the cases (per reader 15 or 16 cases) on personal workstations, blinded to pathologic results. In the first session, the readers loaded the MR images on picture archiving and communication system (PACS) and interpreted the images using structured report as routine clinical work. They detected the lesions in the prostate and graded 1-5 points according to PI-RADS v2. When the readers completed the integral structured report, they recorded diagnosis confidence with 1-5 points and submitted the report. After a six-week washout, the readers evaluated the same cases. They loaded mpMRI and CAD predictive maps at the same time. They could choose the right images according to their own preferences during the interpretation.They completed the integral structured report as the same way of the first session (Fig 1). The structured report system automatically recorded the interpretation time of each step.
Per patient analysis, when more than one lesion was detected within the prostate on mpMRI, the highest PI-RADS score was the final score of the patient. ROC curve was generated for PI-RADS scores basis on patients. MRI was considered positive if PI-RADS ≥3. Sensitivity, specificity, diagnostic confidence and reading time were evaluated and compared for the two sessions.
Results
Per patient analysis
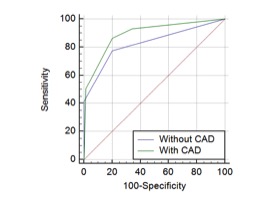
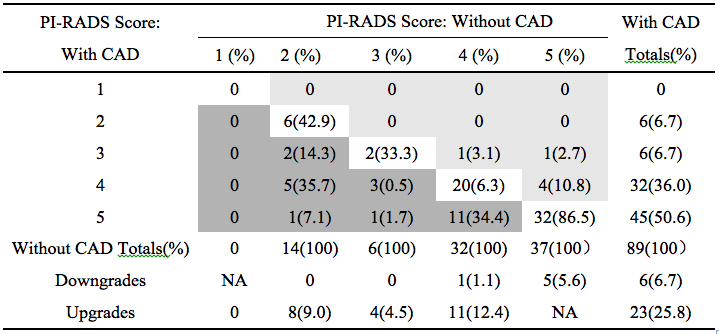
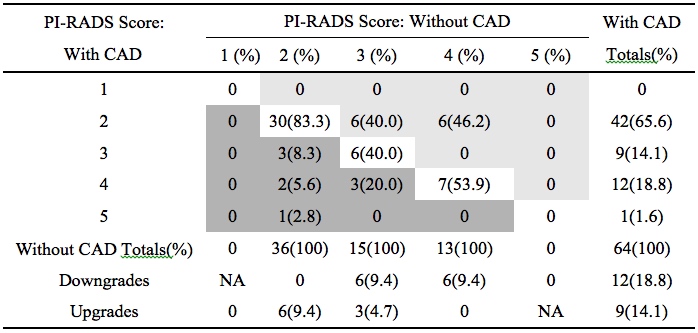
With CAD assistance, the overall area under the ROC curve (Fig 2) (AUC) increased from 0.83(95% CI: 0.76-0.89) to 0.89(95% CI: 0.83-0.94; p=0.016). Distributions of PI-RADS scores assigned to PCa patients ( Table 1) and non-PCa patients ( Table 2) are summarized respectively. The overall sensitivity was significantly improved from 84.3%(95%CI: 75.0%-91.1%) to 93.3%(95% CI: 85.9%-97.5%; p=0.008). Per-patient specificity with CAD (65.6%; 95% CI: 52.7%-77.1%) was higher than that without CAD (56.3%; 95% CI: 43.3%-68.6%), the difference was not significant (p=0.238).
Per lesion analysis
Among the 116 PCa lesions, 89 PCa lesions were detected totally without CAD. Additional 15 PCa lesions were detected with CAD, 80%(12/15) of which had the greatest dimension≤1.4cm. With CAD the overall sensitivity was improved significantly from 76.7%(95%CI: 68.0%-84.1%) to 88.8%(95%CI: 81.6%-93.9%; p=0.001),especially if only lesions with the greatest dimension ≤1.4cm were considered (64.4%, 95%CI:50.9%-76.5% vs 84.8%,95%CI:73.0%-92.8%; p<0.001). However, for PCa lesions ≥1.5cm, there was no significant difference in sensitivity (p>0.05).
The average diagnostic confidence with CAD was improved significantly (p<0.001). The overall reading time of each case decreased significantly from 10.9minutes(1st–3rd quartile, 6.2–17.0min) to 7.8 minutes (1st–3rd quartile, 4.7–13.0min;p<0.001).
Discussion
There are few studies on prostate CAD reading paradigm based on real clinical setting. In this article, we implemented CAD simulating clinical practice. The results showed that concurrent CAD reading significantly improved the sensitivity whether based on patients or based on lesions. It indicated that CAD might help guide the biopsy.With CAD per-patient specificity of readers was not significantly improved. In contrast, Niaf et al. 1evaluated a dataset of 30 PCa patients based on prefined lesions on PZ,the results demonstrated that CAD system could increase reading specificity. The differences in the methodology and database selection should be taken into consideration for the outcome discrepancy. Furthermore, with CAD the diagnostic confidence of readers increased and interpretation time decreased significantly. Probably CAD providing more diagnostic information saved readers hesitation time during the interpretation. However, whether with CAD or without CAD, the diagnosis time of each case in our study were both longer than that in previous studies2.The reason might be that our research simulated clinical work flow with a comprehensive evaluation of the case rather than just assigned scores on prostate lesions.Conclusion
Integrating CAD as concurrent reader into prostate mpMRI diagnostic process can improve radiologist sensitivity and reduce the reading time.Acknowledgements
No acknowledgement found.References
1. Niaf E, Lartizien C, Bratan F, et al. Prostate focal peripheral zone lesions: characterization at multiparametric MR imaging--influence of a computer-aided diagnosis system. Radiology.2014;271(3): 761-769.
2. Giannini V, Mazzetti S, Armando E, et al. Multiparametric magnetic resonance imaging of the prostate with computer-aided detection: experienced observer performance study. European radiology. 2017; 27(10): 4200–4208
Figures