1829
Visualization of gold fiducial markers in the prostate using phase-cycled bSSFP MRI for MR-only radiotherapy1Center for Image Sciences, Imaging Division, UMC Utrecht, Utrecht, Netherlands, 2UMC Utrecht, Utrecht, Netherlands, 3Utrecht University, Utrecht, Netherlands, 4Department of Radiotherapy, Imaging Devision, UMC Utrecht, Utrecht, Netherlands
Synopsis
Existing MR techniques for the visualization of fiducial markers (FMs) in the prostate are usually based on spoiled-gradient-echo imaging. FMs appear as signal voids in magnitude images. It is therefore difficult to distinguish them from hemorrhages and calcifications. FMs detection is crucial for MR-only radiotherapy, where CT images are not available. Automatic FMs detection methods are available, but require special software which is not available at the MR console. With this work, we propose a new method for distinctive FMs visualization in the prostate for MR-only radiotherapy which facilitates FMs detection directly at the MR console without using any additional post-processing or software.
Purpose
Spoiled gradient-echo (SPGR) MR imaging is commonly used as a technique for visualization of gold fiducial markers (FMs) in the prostate. FMs appear as signal voids in magnitude SPGR images, which makes it difficult to distinguish them from hemorrhages and calcifications [1]. Being able to distinguish FMs on the MR images is crucial for MR-only radiotherapy, where CT images are not available. Automatic FMs detection methods are available [2], but require special software which is not available at the MR console. In this work, we investigated a new method for distinctive FMs visualization in the prostate for MR-only radiotherapy which facilitates FMs detection directly at the MR console.Methods
RF phase cycled bSSFP is a dynamic scan, where for each dynamic acquisition the phase of the RF pulse is increased stepwise according to a RF phase incrementing scheme.
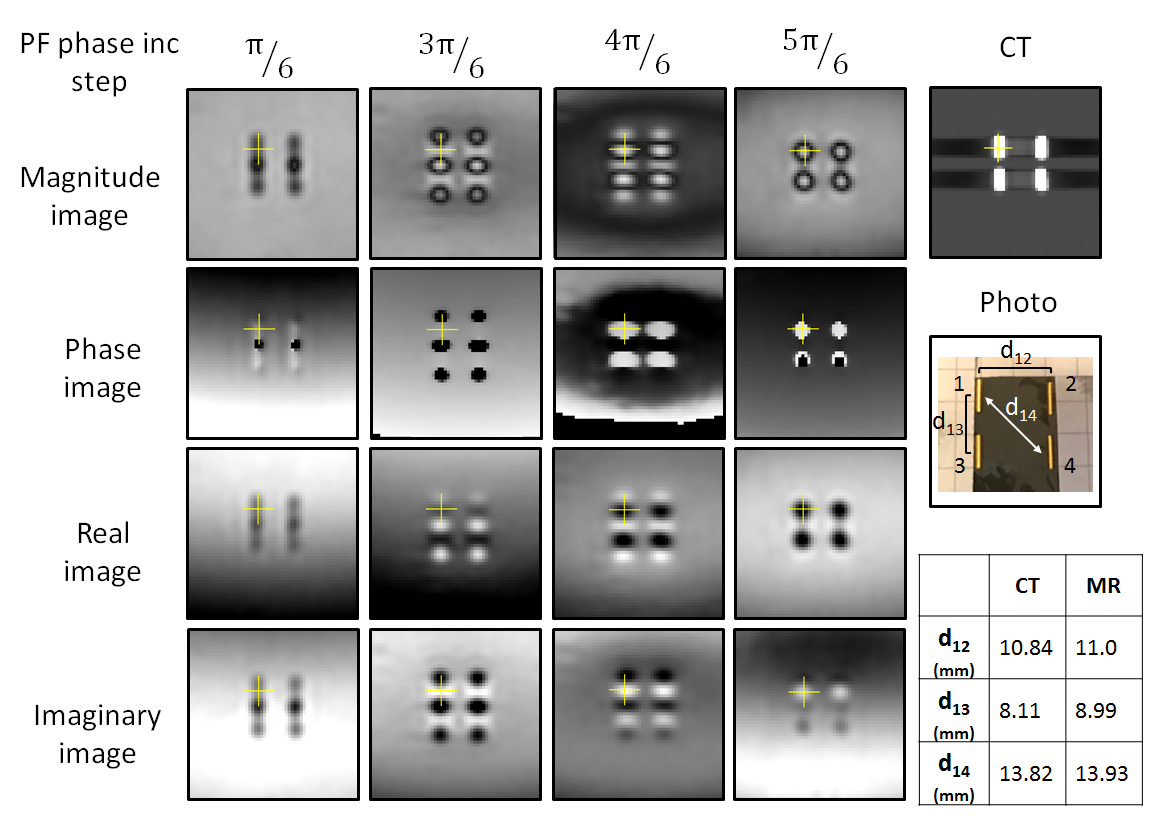
Complex phase-cycled bSSFP images were first acquired in a phantom (agar phantom with 4 gold FMs GM1054 implanted) using a clinical 3T MR scanner (Philips Ingenia, Best, The Netherlands). A 16-channel head receive coil was used. The protocol parameter settings were used: TR 9.2 ms, TE 4.6 ms, FA 20˚, FOV 200x200x80 mm3, acquisition voxel size 2x2x2 mm3, reconstruction voxel size 1x1x1 mm3, 6 dynamics acquisitions with RF phase increment of π/3, scan time 01:48 min. A CT (Philips Brilliance CT Big Bore) scan of the phantom was also acquired, and the distances between the centers of the markers were measured both on MRI and CT images by 1 observer using an in-house tool [3]. The accuracy of detecting FMs was assessed by comparing the measured distances between FMs on MRI and CT images.
Next, complex phase-cycled bSSFP images were acquired in 9 patients at the same MR scanner using a 16-channel anterior receive coil combined with the posterior receive coil integrated in the MR table. The following parameters were used: TR 6.7 ms, TE 3.3 ms, FA 30˚, FOV 320x320x60 mm3, acquisition voxel size 1.5x1.5x2 mm3, reconstruction voxel size 1x1x1 mm3, 6 dynamics acquisitions with RF phase increment of π/3, scan time 02:07 min. ProSet (type 1-3-3-1) was used for fat suppression. CT scans were acquired for 4 patients (other 5 patients were scanned using MR-only protocol). The distances between the centers of the markers were measured for one patient on MRI and CT images using the same an in-house tool [3]. The accuracy of detecting FMs was assessed by comparing the measured distances between FMs on MRI and CT images.
On each dynamic acquisition the manifestations of the magnetic field distortions around the FMs (the artifacts) are different due to different frequency offset related to the corresponding RF phase. Thus, the contrast from FMs in the images appears different for each dynamic acquisition.
Results
The experimental results in the phantom are shown in Figure 1. Complex MR images are shown for one coronal slice for different dynamic acquisitions corresponding to different RF phase increment step. These images show a distinct MR contrast given by the FMs for each dynamic acquisition. A CT image is shown as comparison. The differences between the distances between all FMs measured using MR and CT are within 1 mm, proving correct FMs detection.
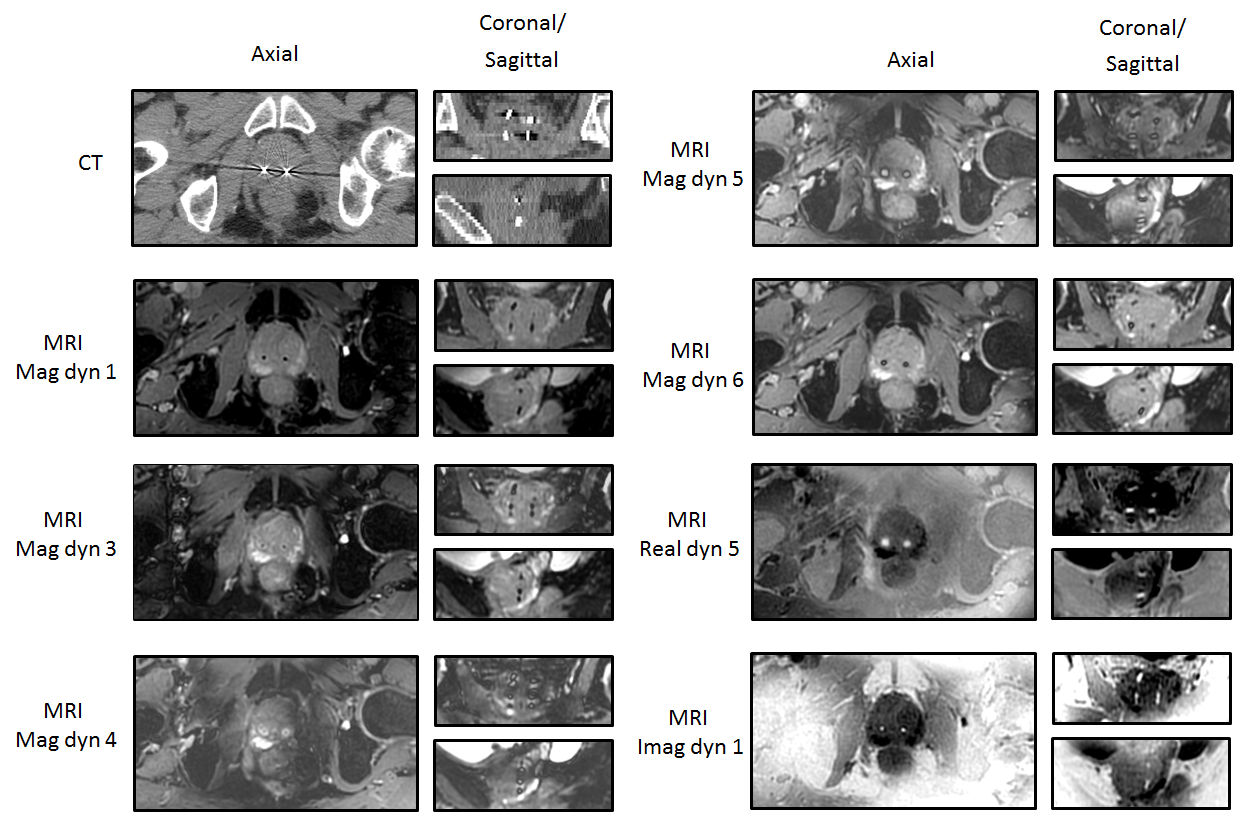
The CT and MR images of the prostate with 4 implanted FMs are shown in Figure 2 for one patient. The same variable contrast (dependent on the RF phase increment used) produced by FMs in the phantom, can be seen in the patient. FMs can be clearly seen on the acquired images. They appear very bright on the dynamic 1 of the Imaginary image, and on dynamic 5 of the Real image. This positive contrast allows for distinguishable manual localization of the FMS by an observer. Similar results were observed in the other 8 patients. The use of fat suppression additionally allows for good prostate contouring.
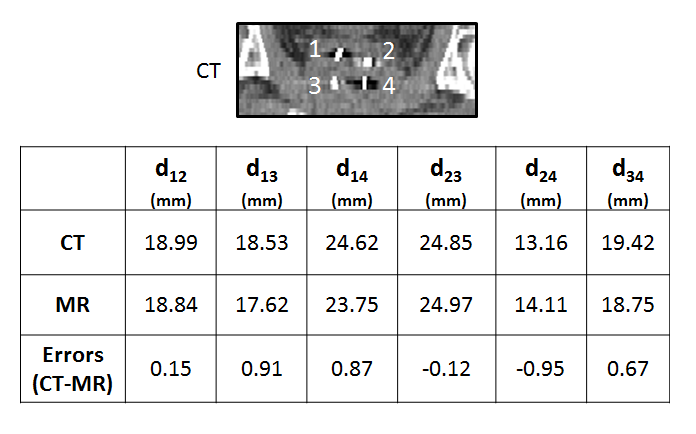
The < 1 mm differences in the distances between all FMs measured for one patient using MR and CT proves correct FMs detection (Figure 3).
Conclusion
We have presented a new method for direct FMs visualization in the prostate for MR-only radiotherapy. The method is based on phase-cycled bSSFP imaging, providing different contrast of FMs dependent on RF phase increment used. Additionally, the fat suppression may be used for prostate contouring. The method does not require any additional post-processing or software. Thus detection of FMs can be easily done directly at the MR console, which is relevant for MR-only prostate RT.Acknowledgements
This research was supported by The Netherlands Foundation for Scientific Research Institutes (NWO), Domain Applied and Engineering Sciences; grant 12813References
(1) Chan et al. 2015 Technol. Cancer. Res. Treat. 14; (2) Maspero et al. 2017 Phys. Med. Biol. 62; (3) Bol et al. 2003 Phys. Med. 19Figures