1827
Comparative Analysis of the Value of Diffusion Kurtosis Imaging and Diffusion-weighted Imaging in Evaluating the Histological Features of Endometrial Cancer1Department of MR, the First Affiliated Hospital,Xinxiang Medical University, Weihui, China, 2Department of Radiology, the First Affiliated Hospital,Xinxiang Medical University, Weihui, China, 3MR Research China, GE Healthcare, Beijing, China
Synopsis
Diffusion kurtosis imaging (DKI) can quantify the diffusion state of non-Gaussian water molecules in tissues, thus correcting the offset of the diffusion-weighted imaging(DWI) model and improving the detection of lesions compared with DWI.At present, there is only a few comparative studies of DWI and DKI in endometrial cancer(EC).Our results show that compared with DWI, the DKI model is a more complete mathematical model with more sensitive parameters, which can more effectively evaluate the pathological and physiological characteristics of EC.
Introduction
Endometrial cancer (EC) is one of the most common malignancies among women1. Researchs have shown that the histological grade for EC is closely associated with planning the treatment and determining the prognosis2.Conventional diffusion weighted imaging (DWI) is based on the Gaussian distribution of water molecules in diffusion motion and has been shown to be valuable in diagnosing EC and assessing the degree of differentiation in many studies3,4. However, Jensen et al.argued that the water diffusion distribution function can be considered as non-Gaussian because of the presence of barriers (e.g.cell membranes) and compartments (e.g.intracellular and extracellular spaces) in the tissue5,6.Therefore, DWI does not truly reflect the diffusion motion of water molecules. Theoretically, DKI can quantify the diffusion state of non-Gaussian water molecules in tissues, thus correcting the offset of the DWI model and improving the detection of lesions compared with DWI.The purpose of the present study was to evaluate the feasibility of DKI in diagnosing and histologically grading EC and to determine whether DKI is superior to DWI.Methods
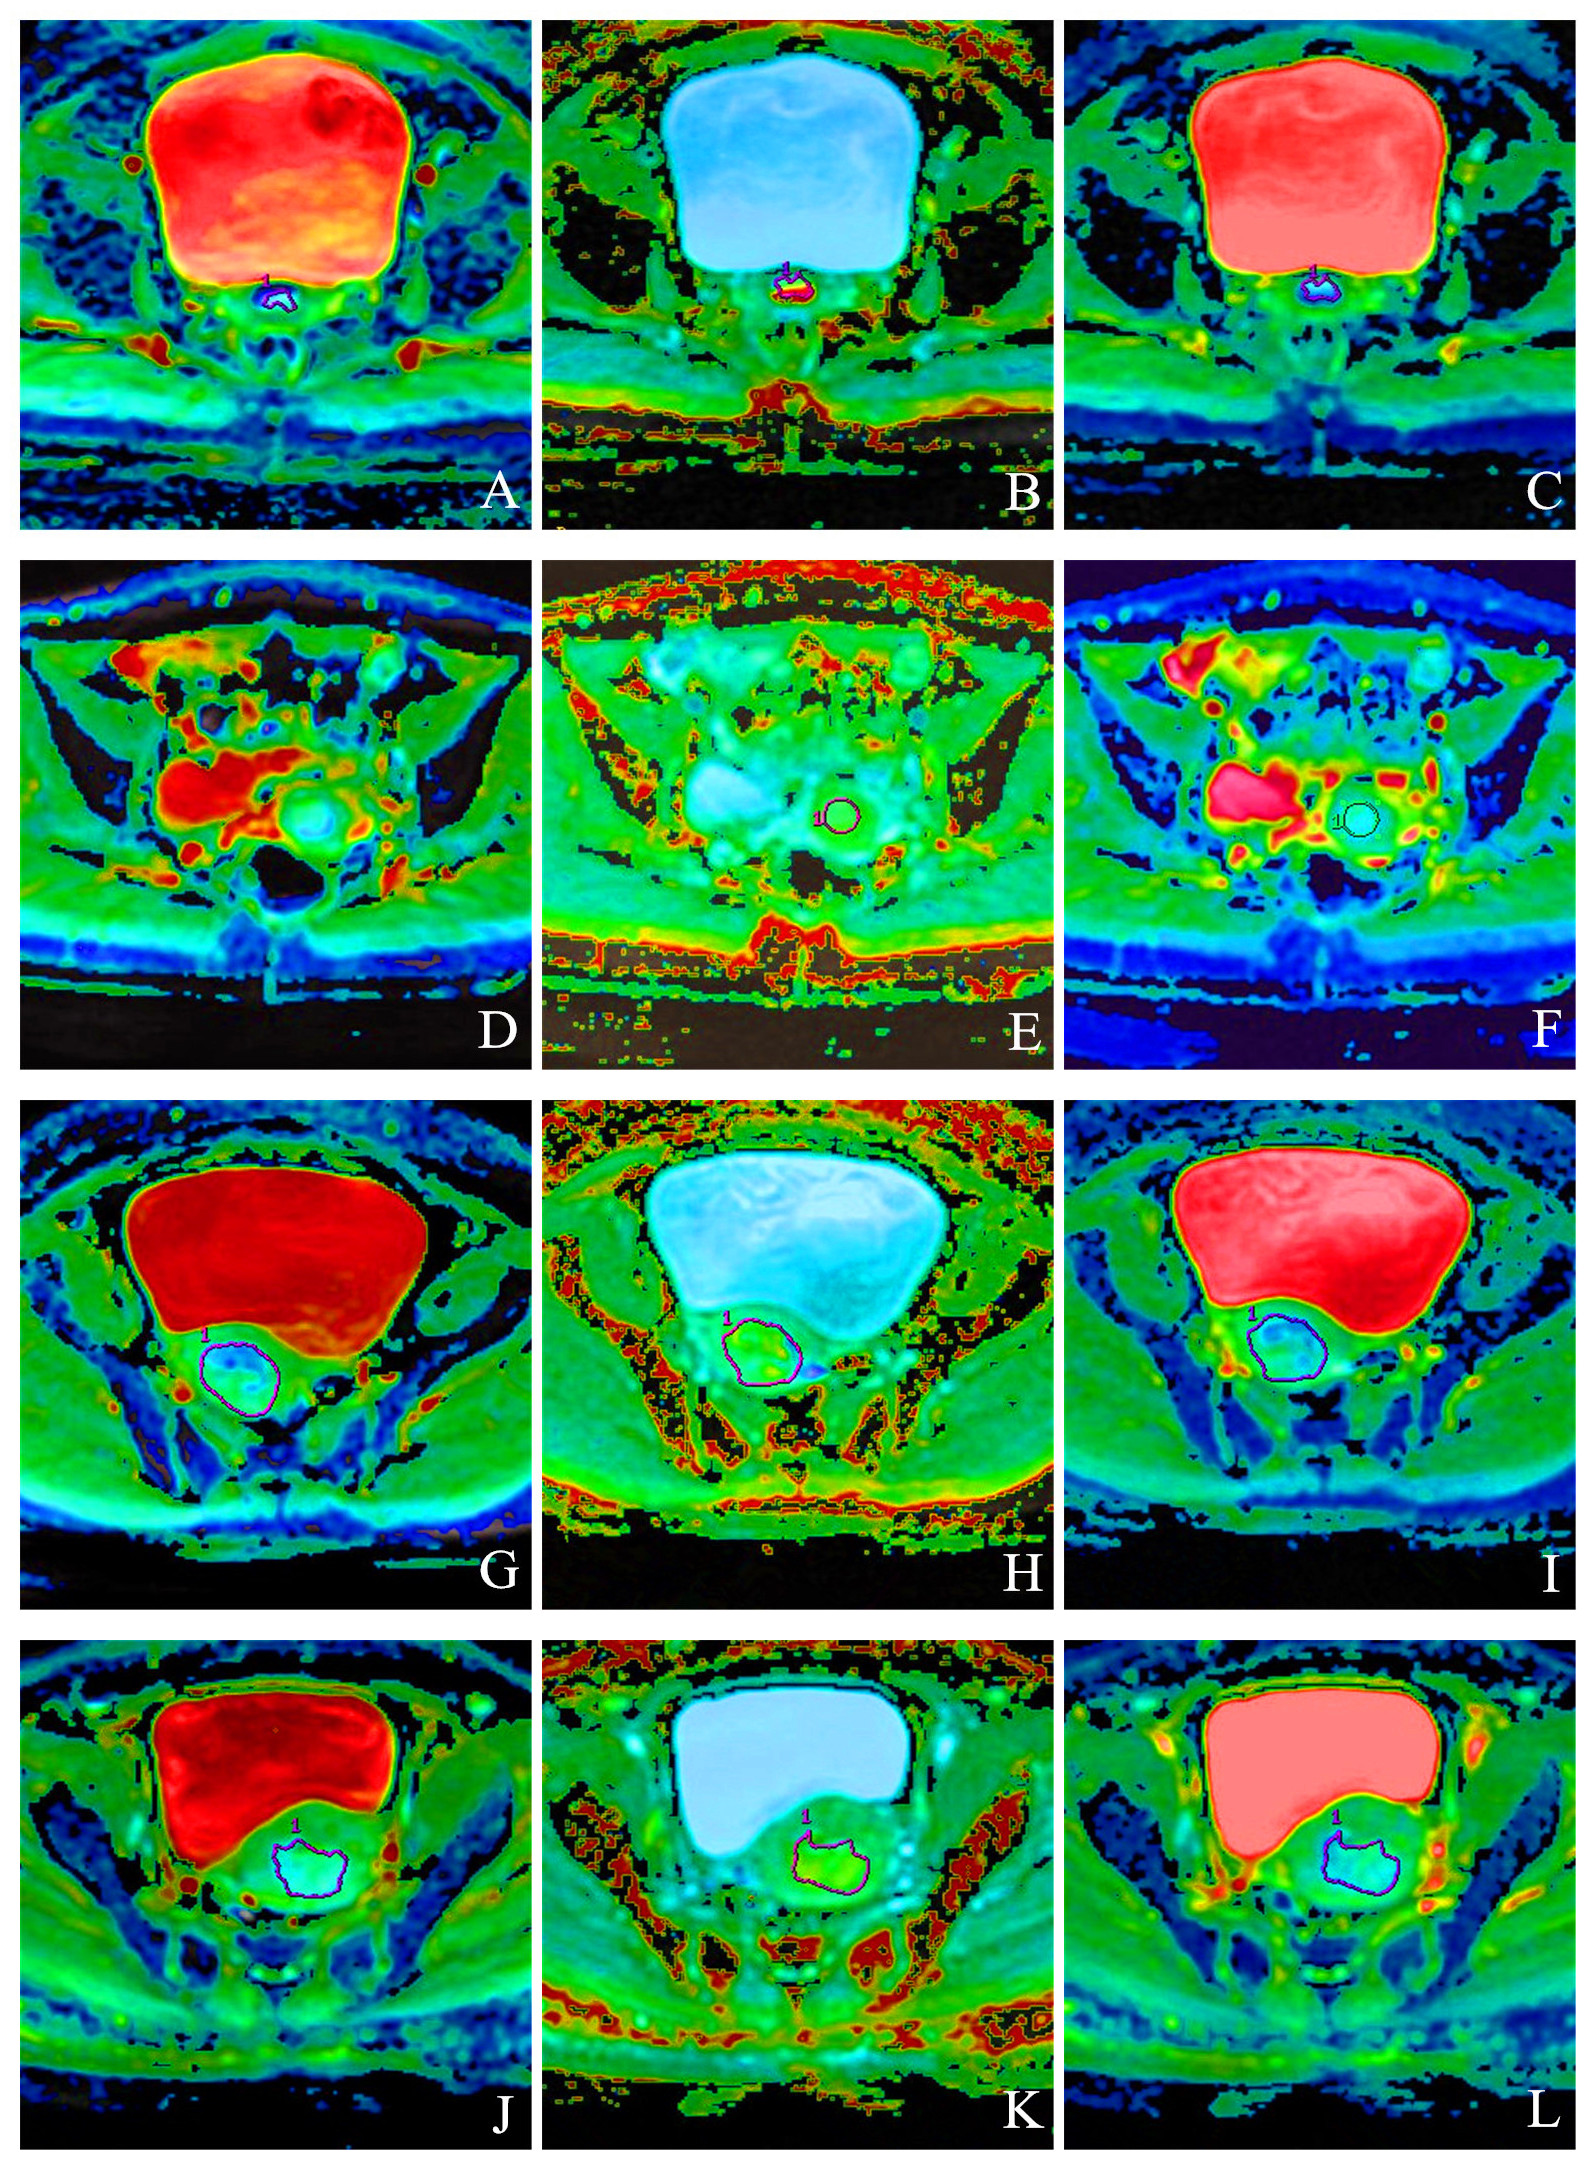
Using pathology results as the gold standard,91 patients are selected in this research, including 61 patients with EC (17 of G1(well differentiated), 24 of G2(moderately differentiated) and 20 of G3(poorly differentiated)); 30 patients with G0(normal endometrium). Studies were carried out by using a 3.0 T MR system (Discovery MR750, GE Healthcare) with a 32 channel phased-array torso coil. T2WI without fat suppression sequence at oblique axial view was taken as reference with the clearest indication of lesion. DWI data were collected with TR=3000 ms, TE=12.0 ms, FOV=360×280 mm2,slice thickness: 5 mm, spacing=1 mm,b=800 s/mm2.Spin-echo echo-planar imaging was used to acquire the DKI sequence with the following parameters:FOV=360×280 mm2, slice thickness=5 mm, spacing=1 mm, TR=2500 ms, TE=79.3 ms, b= 0, 500, 1,000, 1500, and 2000 s/mm2, and 30 uniformly distributed dispersion directions. The ROI was manually selected layer by layer on the level of the DWI/DKI sequence. Reference standards: 1) the ROI should contain solid tumor issues or normal endometrium as much as possible;2) ROI placement was chosen to avoid necrotic, cystic, or bleeding regions. (Fig 1).SPSS 23.0 and Med Calc 11.1 are used for data analysis. Individual sample t is used to check and compare the differences in MK, MD, ADC values between the EC group and normal group, between the G1/G2 EC groups, and between the G2/G3 EC groups. ROC curve is used to evaluate the diagnostic performance of MK, MD, ADC values. Hanley & McNeil test is used to compare the differences of AUC in MK, MD, ADC values. Spearman related coefficients are used to analyze the correlation between MK, MD, ADC values and the differentiation grade of EC. P<0.05 is considered statistically significant.Results
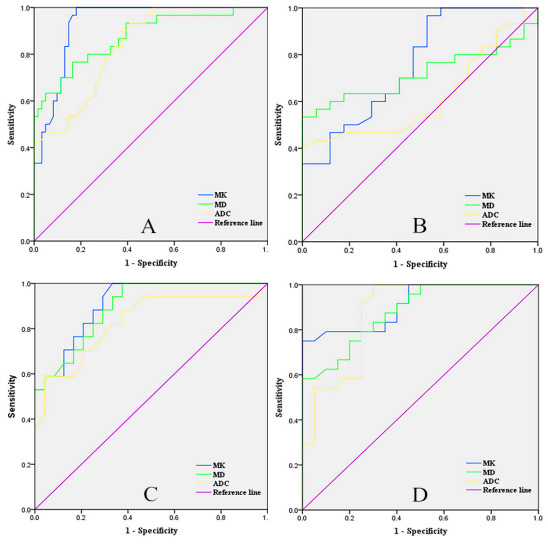
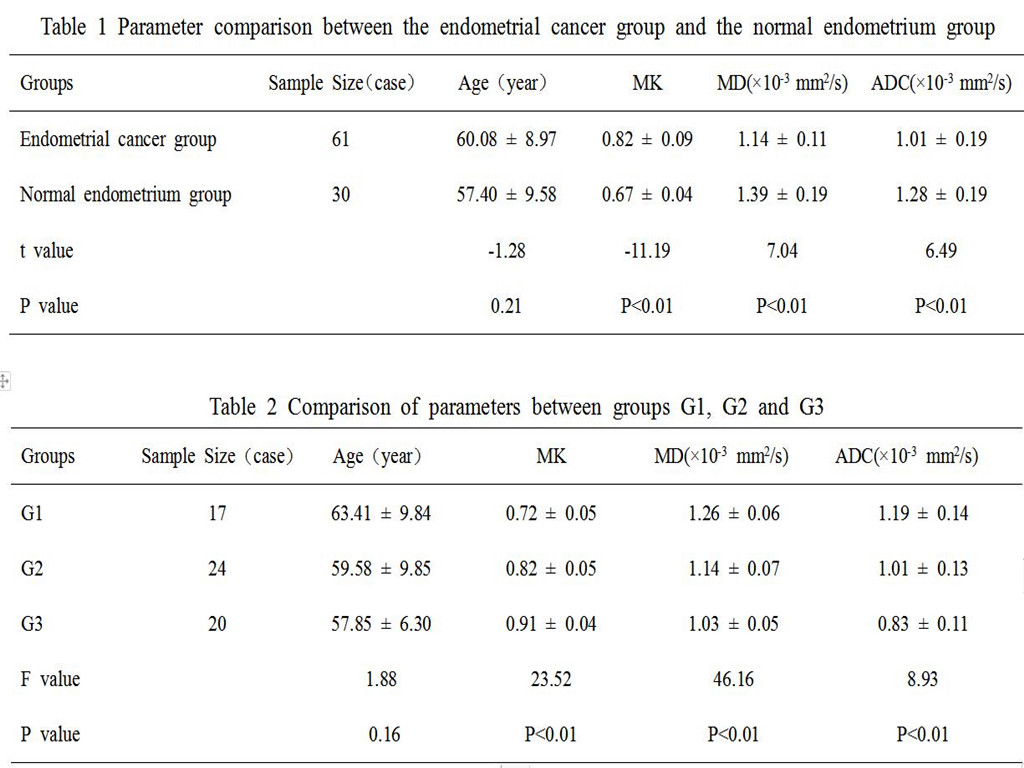
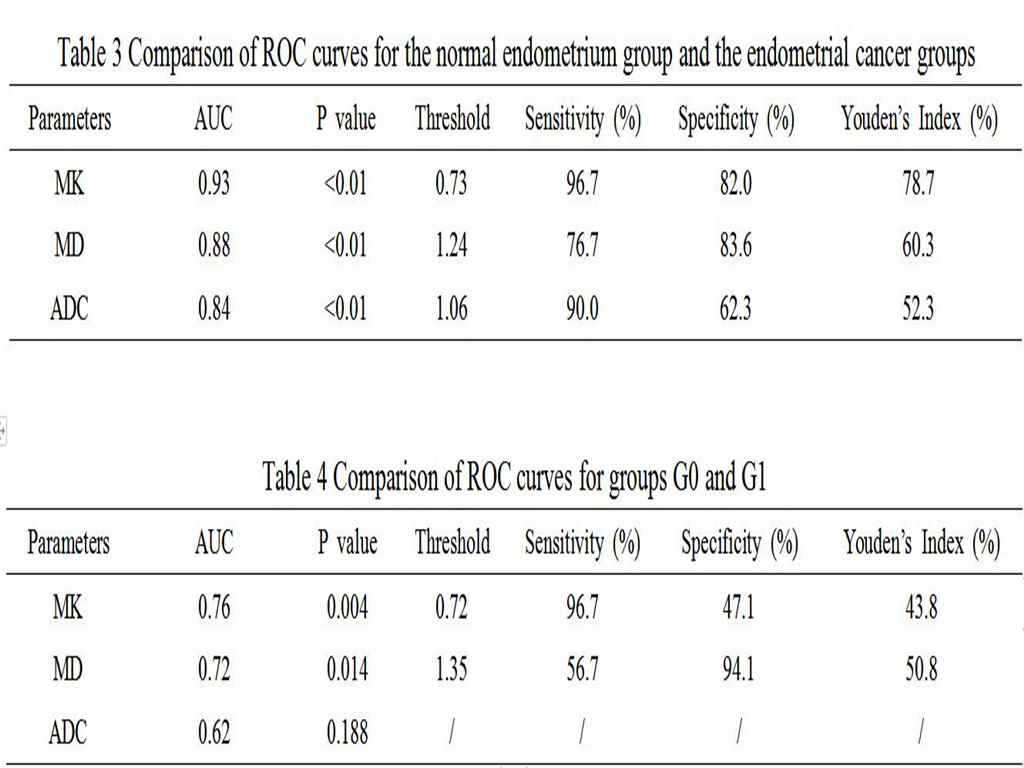
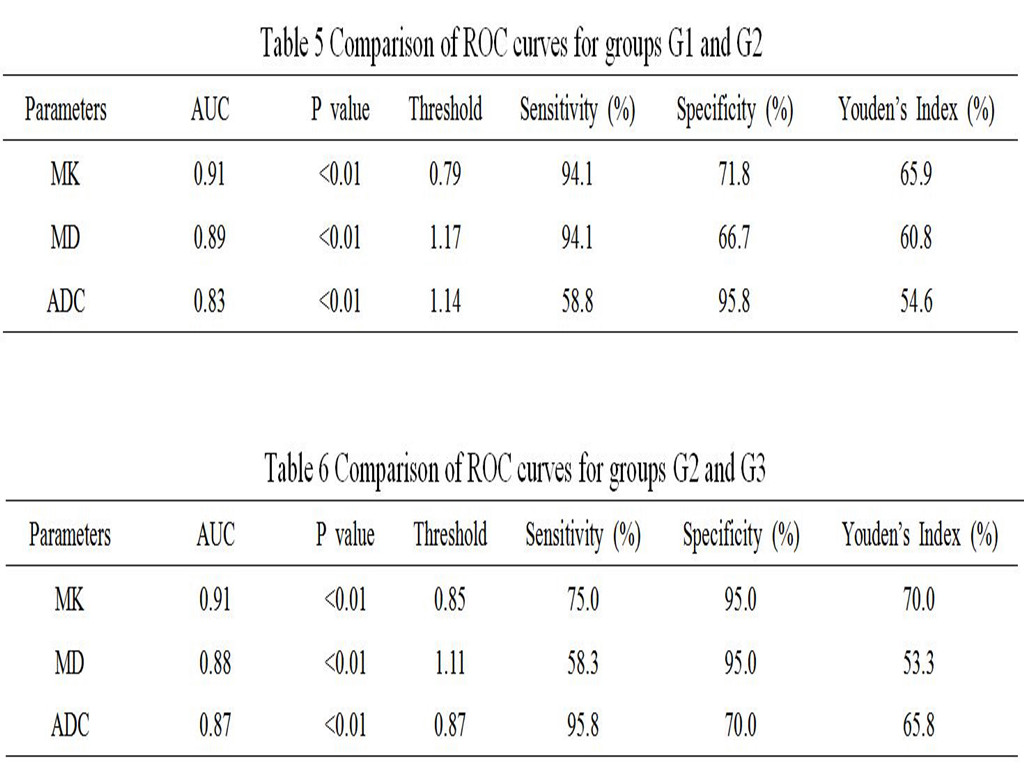
The MK value was higher in the EC group than that in the normal group (P<0.01), and the MD and ADC values were lower in the EC group than that in the normal group (P<0.01,Fig 1,Table 1). The MK value was highest in group G3, followed groups G2 and G1 (P<0.01), whereas the MD and ADC values were highest in G1, followed by groups G2 and G3(P<0.01,Fig 1,Table 2). The difference in ADC values between groups G0 and G1 were not significant (P=0.09,Table 4). In all groups,the AUC value of MK was the highest, followed by those of MD and ADC (Fig 2,Tables 3, 4, 5, and 6). The correlation between parameters and histological grade was maximal for MK, followed by MD and ADC (r = -0.85, +0.82, +0.76, P <0.01).Discussion
The MK/MD/ADC values are significantly different among the different groups, which may be related to these factors such as cell density, the nucleocytoplasmic ratio, and the ratio between free and bound water7,8. These factors are normally stable and the MK/MD/ADC values are approximately constant. However, abnormal cancer cell proliferation causes various factors to become imbalanced and hinders normal water molecule movement. This imbalance and hindrance increases with the increasing degree of malignancy of malignant tumors. Compared with DWI, DKI is a more useful technique for identification and diagnosis of EC and different levels of EC, because DKI has a higher b-value and provides a more complete model for data fitting9,10. Therefore, DKI can sensitively detect minor factors that affect water movement, such as cell membranes and organelles.Conclusion
We concluded that DKI may be a more useful technique than DWI for identification and diagnosis of EC and different levels of EC, which could have an important impact on the clinical therapy strategy for patients with EC.Acknowledgements
The Henan Science and Technology Office of China (grant numbers 172102310503).References
1. Faria SC, Sagebiel T, Balachandran A, et al. Imaging in endometrial carcinoma[J]. The Indian journal of radiology & imaging, 2015,25(2):137-147.
2. Nougaret S, Reinhold C, Alsharif SS, et al. Endometrial Cancer: Combined MR Volumetry and Diffusion-weighted Imaging for Assessment of Myometrial and Lymphovascular Invasion and Tumor Grade[J]. Radiology, 2015,276(3):797-808.
3. Ghosh A, Singh T, Singla V, et al. Comparison of Absolute Apparent Diffusion Coefficient (ADC) Values in ADC Maps Generated Across Different Postprocessing Software: Reproducibility in Endometrial Carcinoma[J]. AJR. American journal of roentgenology, 2017,209(6):1312-1320.
4. Roethke MC,Kuder TA,Kuru TH,et al.Evaluation of Diffusion Kurtosis Imaging Versus Standard Diffusion Imaging for Detection and Grading of Peripheral Zone Prostate Cancer[J].Investigative radiology,2015,50(8):483-489.
5. Jensen JH. MRI quantification of non-Gaussian water diffusion by kurtosis analysis[J]. NMR in biomedicine, 2010,23(7):698-710.
6. Jensen JH, Helpern JA, Ramani A, et al. Diffusional kurtosis imaging: the quantification of non-gaussian water diffusion by means of magnetic resonance imaging[J]. Magnetic resonance in medicine, 2005,53(6):1432-1440.
7. Si Y.Diagnostic Performance of Monoexponential DWI Versus Diffusion Kurtosis Imaging in Prostate Cancer: A Systematic Review and Meta-Analysis[J].AJR. American journal ofroentgenology,2018,211(2):358-368.DOI:10.2214/AJR.17.18934.
8. Nougaret S, Lakhman Y, Vargas HA, et al. From Staging to Prognostication: Achievements and Challenges of MR Imaging in the Assessment of Endometrial Cancer[J]. Magneticresonance imaging clinics of North America, 2017,25(3):611-633.
9. Lin L,Bhawana R, Xue Y, et al.Comparative Analysis of Diffusional Kurtosis Imaging,Diffusion Tensor Imaging, and Diffusion-Weighted Imaging in Grading and Assessing Cellular Proliferation of Meningiomas[J]. AJNR. American journal of neuroradiology, 2018,39(6):1032-1038.
10. Yin J, Sun H, Wang Z, et al. Diffusion Kurtosis Imaging of Acute Infarction: Comparison with Routine Diffusion and Follow-up MR Imaging[J]. Radiology, 2018,287(2):651-657.
Figures