1819
DKI and DCE-MRI in Identifying the Malignancy of Lymph Node during the Primary Staging of Rectal Cancer: MRI with Node-for-Node Matched Histopathology validation1Department of Radiology, Shuguang Hospital, Shanghai University of Traditional Chinese Medicine, Shanghai, China, 2MR Scientific Marketing, Siemens Healthcare, Shanghai, China, 3Department of Pathology, Shuguang Hospital, Shanghai University of Traditional Chinese Medicine, Shanghai, China, 4Department of Gastrointestinal Surgery, Shuguang Hospital, Shanghai University of Traditional Chinese Medicine, Shanghai, China
Synopsis
We investigated the potential of Diffusion kurtosis imaging (DKI) and Dynamic Contrast Enhancement (DCE) to accurately detect lymph node (LN) metastases in rectal cancer. Our study showed that DKI and DCE-MRI may be useful to differentiate the TD and metastatic LN from benign LN.
Background and Purpose
The LN evaluation is very important for staging the rectal cancer, evaluating the prognosis and deciding on therapy. In previous studies, DKI was used to identify malignancy of LN, but the LNs were dissected that did not match with MR imaging with node for node. This study aimed to accurately assess benign and malignant LNs in patients with rectal cancer before operation by DKI and DCE MRI with node-for-node matched histopathology validation.Methods
An eighty-two male patient with rectal adenocarcinoma who met our inclusion criteria was enrolled. Data were collected on a MAGNETOM Skyra 3.0T scanner (MAGNETOM Skyra, Siemens Healthcare, Erlangen, Germany) with a 18-channel body coil. An axial DKI with b values of 0, 700, 1400, 2100 sec/mm2 (with no. of averages=1, 2, 8, 8, respectively) was performed with the following parameters: TR/TE = 7200/88ms; FOV = 200×200mm2, slice thickness = 2mm, scan matrix = 220×220, voxel size = 0.9×0.9×2.0mm3, phase oversampling = 30%, no. of slice = 40. For more accurate pharmacokinetic analysis, two precontrast T1-weighted volumetric interpolated breath-hold examinations were acquired with different flip angles (2◦/15◦). The applied sequence parameters are: TR/TE = 4.09/1.47 ms, FOV = 200 × 200 mm, matrix = 160×160, slice thickness = 2 mm. DCE series with fat suppression in the oblique axial plane (TR/TE = 5.06/1.98 ms, flip angle = 15◦, slice thickness = 2.0 mm, temporal resolution = 7.4 seconds) were acquired over 5 minutes 3 seconds with an intravenous bolus injection of 0.1 mmol/kg gadopentetate dimeglumine at a rate of 3 mL/s, followed by a 25-mL saline flush. The patient underwent total mesorectal excision of the rectum were studied. After the specimen was fixed in formalin, the locations of LN were matched with its corresponding MRI as main reference standard of superior rectal artery and its branches by two radiologists and two pathologists.Results
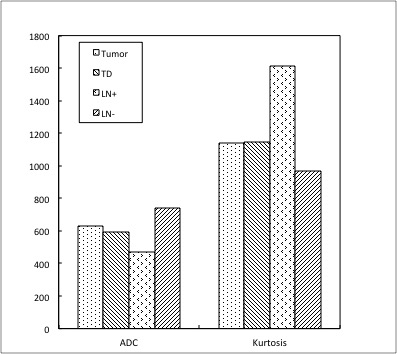
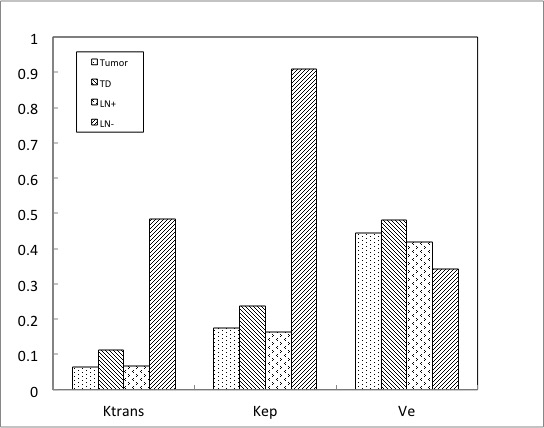
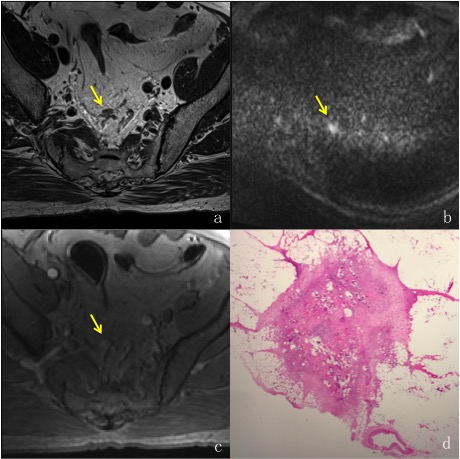
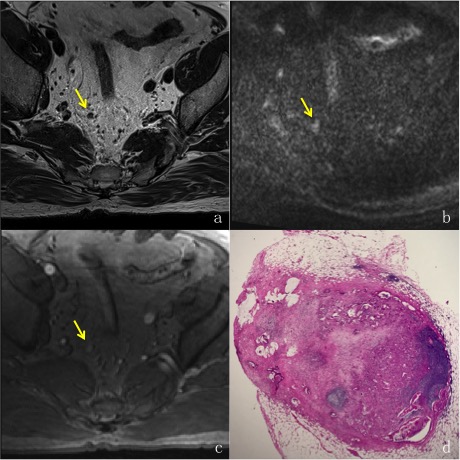
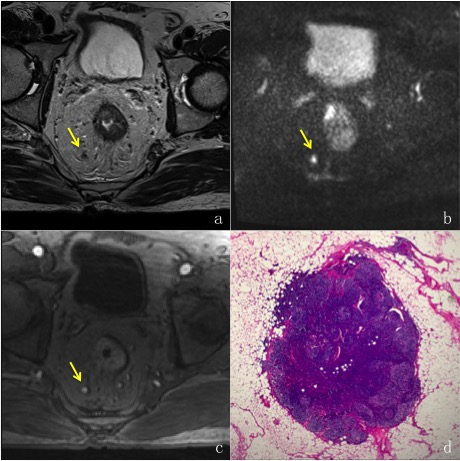
We evaluated tumor, one tumor deposit (TD) (Figure 3), one malignancy LN (LN+) ( Figure 4) and one benign LN (LN-) (Figure 5). The sizes of TD, LN- and LN+ were 8.7×6.2mm2, 6.2×5.3mm2, 5.0×4.0mm2, respectively. ADC values were lower for tumor, TD and LN+ than for LN- (628.3, 595.8, 468.4 vs 741.4, respectively). Kurtosis values were higher for tumor, TD and LN+ than for LN- (1143.0, 1148.4, 1612.4 vs 968.1, respectively)(Figure 1). Ktrans and Kep values of tumor, TD and LN+ were significantly lower than LN- (0.065, 0.113, 0.068 vs 0.483; 0.175, 0.236, 0.163 vs 0.91, respectively). Ve values were higher for tumor, TD and LN+ than for LN- (0.443, 0.481, 0.420 vs 0.343, respectively) (Figure 2). As a result, the Ktrans and Kep have great significance in difference benign and malignancy.Discussion and Conclusion
DKI and DCE-MRI may be useful to differentiate the TD and metastatic LN from benign LN. The present results lay a solid foundation for future differentiation between malignancy and benign LNs using 3.0T MRI. In future, larger number sizes are needed to confirm our findings.Acknowledgements
No acknowledgement found.References
1. Edler D, Öhrling K, Hallström M, et al. The number of analyzed lymph nodes – a prognostic factor in colorectal cancer. Acta Oncologica, 2007, 46(7):975.
2. Yu J, Dai X, Zou H H, et al. Diffusion Kurtosis Imaging in Identifying the Malignancy of Lymph Node during the Primary Staging of Rectal Cancer. Colorectal Disease, 2018, 20(2).
3. Park J S, Jang Y J, Choi G S, et al. Accuracy of Preoperative MRI in Predicting Pathology Stage in Rectal Cancers: Node-for-Node Matched Histopathology Validation of MRI Features. Diseases of the Colon & Rectum, 2014, 57(1):32.
4. Yan X , Zhu L , Fu C , et al. Diffusion Kurtosis Imaging Study of Rectal Adenocarcinoma Associated with Histopathologic Prognostic Factors: Preliminary Findings. Radiology, 2016, 284(1):160094.
Figures